The document provides an analysis and outlook for various global economies and financial markets in January 2014. Regarding the US, it summarizes that the Fed commenced a cautious tapering of bond purchases in December 2013 and expects similar gradual reductions going forward, with quantitative easing ending by late 2014. It also notes the Fed's commitment to keeping rates low for the foreseeable future. For the Eurozone, it discusses the ECB strengthening its forward guidance on keeping rates low and signals the ECB will maintain an accommodative policy stance as the domestic economy shows signs of recovery. However, further disinflation remains a risk.


![Page 4 of 20 This marketing communication cannot be deemed as being impartial. This means that RI can act or may have acted on the
information contained therein. Please see last page for important information.
Monthly Outlook
14 January 2014 www.rabotransact.com
Eurozone
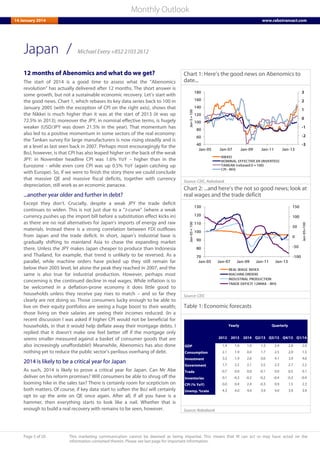
Beefed-up forward guidance…
In the January press conference, ECB President Draghi firmed up the
forward guidance language: “[…] the Governing Council strongly
emphasises that it will maintain an accommodative stance of monetary
policy for as long as necessary […] Accordingly, we firmly reiterate our
forward guidance that we continue to expect the key ECB interest rates to
remain at present or lower levels for an extended period of time.” He then
underscored that the Governing Council “remain[s] determined to
maintain the high degree of monetary accommodation and to take further
decisive action if required.” The timing for this change in language did
not come entirely unexpected. Now that the Fed has initiated a
tapering cycle and economic data are slowly improving, a firming up of
its language is likely to be more successful than during much of 2013
when it was ill striving against the stream for the ECB. This is largely
because the ECB’s forward guidance is conditional and asymmetric in
nature. By talking dovish amidst improving conditions the ECB can
finally distinguish itself from other central banks, the Federal Reserve in
particular, even as the latter has retained a dovish stance. Overall, we
expect the ECB to maintain policy in the coming months. But it is likely
to act quickly if there is any discernible deterioration in either the
growth, inflation or money market outlook. The March meeting (when
it publishes fresh staff projections) is likely to be our next reality check.
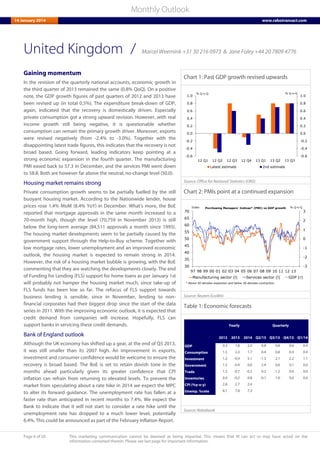
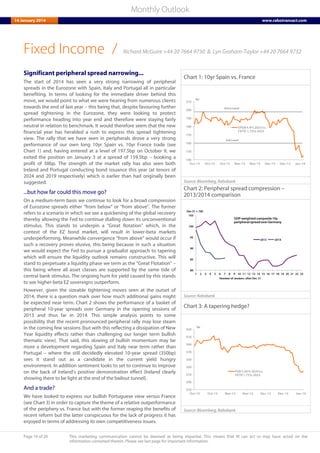
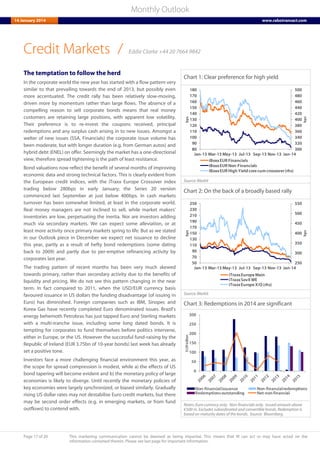
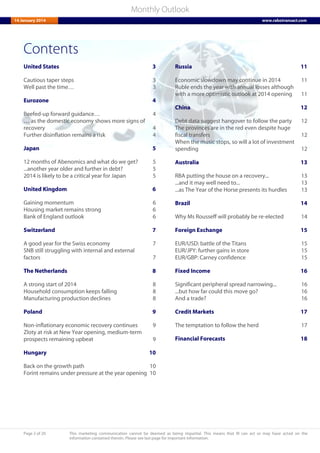
… as the domestic economy shows more signs of recovery
Draghi has clearly indicated that the Governing Council will resist
tightening action even when the economy continues to recover. On
that note, perhaps the most encouraging news is that it is domestic
demand that appears to be strengthening, notably in the periphery.
Figure 1 shows the impressive acceleration in retail sales growth in the
periphery, albeit from a low base. Recent data for retail sales, consumer
confidence and retail surveys suggest that overall eurozone
consumption expanded at a pace of around 0.2% QoQ in Q4.
Unemployment remains at a high level, but appears close to stabilising.
In the medium-term the low inflation environment should support a
gradual recovery in consumer spending. Meanwhile, business surveys
also point to a somewhat stronger pickup in investment spending
growth than we had previously pencilled in. The credit environment,
deleveraging pressures and government finances are likely to keep a lid
on the economy’s growth potential for a protracted period of time,
however. We have slightly upped our 2013Q4 growth forecast.
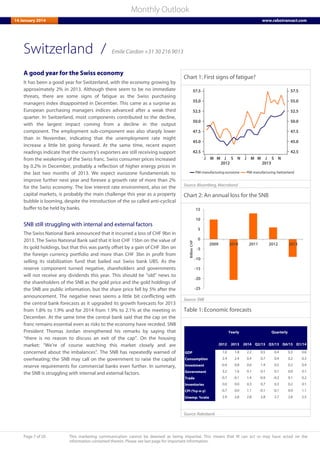
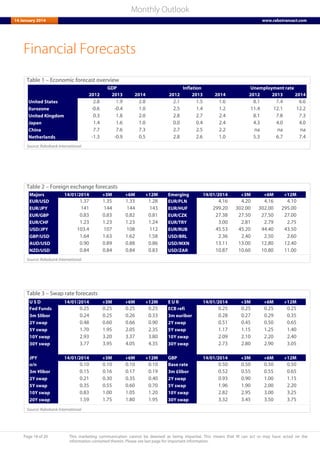
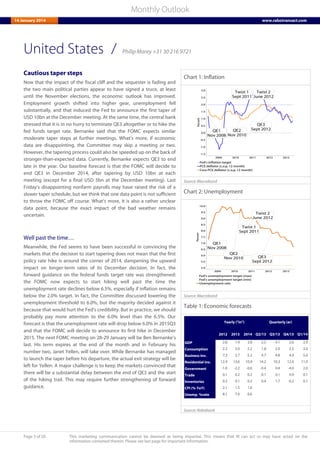
Further disinflation remains a risk
The elephant in the room is inflation and President Draghi has signalled
that the Governing Council will not accept a significant deterioration in
the medium-term outlook. We would stress that recent declines in core
inflation have been partly driven by technical factors and indirect taxes
falling out of the comparison base. Super-core inflation (Figure 2) has
not shown a discernible downward trend since end-2012. We expect
headline inflation to move within a fairly narrow range over the next six
months (between 0.8% to 1%), but a persistent fall below it may spur
the ECB into action again. Initially this would likely be a combination of
liquidity measures and a further beefing-up of the forward guidance.
We remain sceptical of negative deposit rates, conditional LTROs and
asset purchases (particularly at his stage), but – clearly - nothing can be
excluded should deflation risks be seen as being on the up.
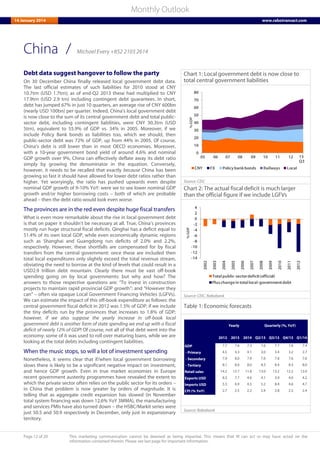
Chart 1: Retail sales growth: core vs. periphery
-10
-8
-6
-4
-2
0
2
4
6
05 06 07 08 09 10 11 12 13
%YoY
core periphery
Source: Macrobond, Rabobank
Chart 2: Core and super-core inflation
Source: Macrobond, Rabobank
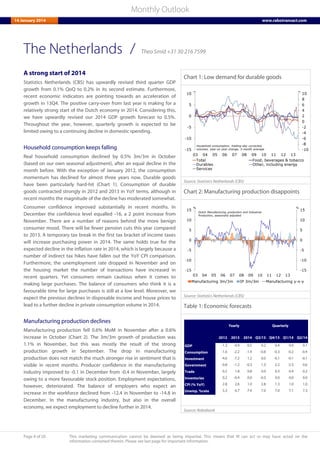
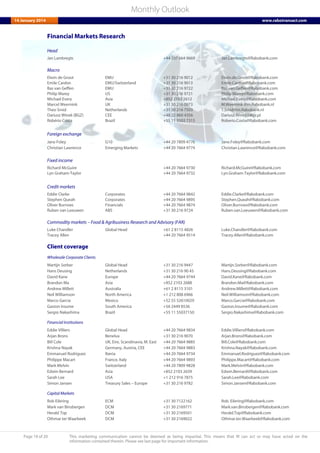
Table 1: Economic forecasts
2012 2013 2014 Q3/13 Q4/13 Q1/14 Q2/14
GDP -0.6 -0.4 1.0 0.1 0.3 0.3 0.2
Consumption -1.4 -0.5 0.5 0.1 0.2 0.1 0.1
Investment -3.9 -3.1 1.6 0.4 0.5 0.3 0.4
Government -0.6 0.2 0.3 0.2 -0.1 0.1 0.2
Trade 1.7 0.6 0.2 -0.4 0.1 0.1 0.0
Inventories -0.6 -0.1 0.2 0.3 0.0 0.0 0.1
CPI (%y-o-y) 2.5 1.4 1.2 1.3 0.8 0.9 1.0
Unemp. %rate 11.4 12.1 12.2 12.1 12.2 12.2 12.2
Yearly Quarterly
Source: Rabobank
/ Elwin de Groot +31 30 216 9012](https://image.slidesharecdn.com/35fc3797-0dab-4c69-af95-09390866ba43-150414124046-conversion-gate01/85/GlobalOutlook-4-320.jpg)