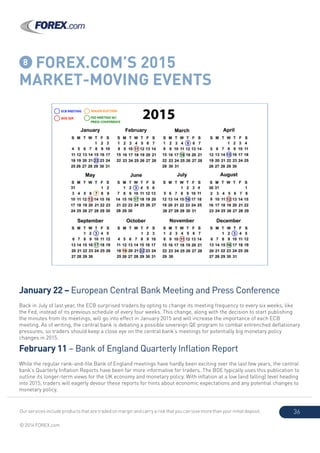
SlideShare a Scribd company logo
Our services include products that are traded on margin and carry a risk that you can lose more than your initial deposit.
© 2014 FOREX.com
1
$
$
¥
¥
¥
¥
£
€ €
€
€
$
$
MARKET OUTLOOK 2015
A YEAR OF OPPORTUNITY
Our services include products that are traded on margin and carry a risk that you can lose more than your initial deposit.
© 2014 FOREX.com
2
2015 OUTLOOK
2 STOCKS: MAJOR INDICES OUTLOOK
2014 has been another stunning year for US equities. We assess whether the market can make it a hat-trick and give you our
view on whether the S&P 500 can make another record year.
European markets have lagged behind their US peers, but some markets are starting to look like a good value. Get our take on
whether Europe can steal the limelight from the US.
3 COMMODITIES: GOLD AND OIL
Oil has fallen more than 30% in the second half of 2014 with OPEC looking unlikely to cut production. We ask whether oil has
fallen far enough that it could be due a recovery this year.
4 EMERGING MARKETS OUTLOOK
In 2013 we had the taper-tantrum: could we get rate-rage in 2015? We assess the impact of a US rate hike on emerging
economies and look at what countries are most at risk in 2015.
5 VOLATILITY OUTLOOK 2015
What could cause volatility to spike this year? Should we be on our guard, or will volatility fall back to 2014’s record lows?
What are the most volatile currencies to keep an eye on and how does a strong dollar create market fear?
6 ELECTION WATCH: UK
This is one of the most important elections in years. If UKIP’s star continues to ascend could it disrupt the UK political system?
We assess potential outcomes of the election and discuss what this means for the UK’s position within the EU and the impact
on the pound and UK-based assets.
7 FX FORECASTS
8 ECONOMIC CALENDAR
9 STOCKS: GALVAN’S ONES TO WATCH FOR 2015
This is compiled with help from the newest addition to the GAIN Capital team – Galvan Research, who have chosen three of the
most promising stocks for 2015 and give you their take on why they are worth watching.
1 GLOBAL GROWTH OUTLOOK:
With Europe, China and the UK all showing signs of slowing down, we assess whether the US can prop up global growth
singlehandedly. We also look at what this means for global monetary policy and ask whether the Fed will bite the bullet and
hike rates mid 2015. We also look at the prospect of QE from the ECB, and what the Europeans can do if deflation takes hold.
10 EXCLUSIVE: TOP TAIL RISKS FOR 2015
We give you our most outrageous predictions for 2015, from the prospect of UKIP taking power in the US, a collapse in the oil
price, the return of Berlusconi to front-line Italian politics and the prospect of the USD/JPY reaching 180.
Our services include products that are traded on margin and carry a risk that you can lose more than your initial deposit.
© 2014 FOREX.com
3
1 GLOBAL GROWTH OUTLOOK
US: Growth via Tangential Quantitative Easing
The US economy had been in recovery mode in 2014 with big improvements in GDP and the unemployment rate, which
fell to its lowest level since 2008. Inflation was the one weak spot, as it was stubbornly lower than the Fed may have
desired; however, it remains stable as we move into 2015. Those who were expecting the US economy to fail miserably
once monthly stimulus from the Federal Reserve ended in October were briefly validated as stocks tumbled in the
immediate days following the announcement, but rebounded thereafter and appear strong heading in to the end of
2014.
Despite the dangers of weakness in the economies of Europe and Asia to the US, the measures taken by those other
nations could actually help the US maintain its current level of strength, especially if we see the ECB embark on QE
at some stage in 2015. All in all, the future looks bright for the world’s largest economy, and if oil prices continue to
decline as they have in the latter half of 2014, the US may keep this momentum going even if the Fed starts to increase
rates to a more historically normal level at some stage this year.
	 Figure 1
	 Source: FOREX.com
Our services include products that are traded on margin and carry a risk that you can lose more than your initial deposit.
© 2014 FOREX.com
4
Federal Reserve: Committed to Hawkish Policy?
The Federal Reserve is expected to take its first steps towards normalizing monetary policy in the middle of 2015,
with the market anticipating a rate rise sometime in June or July. The US is in a position of cyclical leadership with
the economy doing well, particularly the jobs market, and the US managing to buck the global disinflation trend. The
US created over 300,000 jobs in November, but more important to Fed policy was the 0.4% rise in hourly earnings for
November, which was the largest monthly rise since October 2011.
The expected rate rise from the Fed has been one of the major factors behind dollar strength in 2014. The greenback
has outperformed all of the major currencies and all of the emerging market currencies bar the Indian rupee (INR)
and the Hong Kong dollar (HKD). Due to the divergent monetary policy paths between the Fed and other major central
banks, the dollar is in a good position to continue to outperform in 2015, at least for the first half of the year.
In the first few months of 2015 we think that the focus will shift towards what the Fed will do after the first rate
hike. Right now the market is looking for two further hikes for the rest of the year, which has been supported by the
economic data; however, the bigger risk in our view is that the Fed is not as hawkish as some expect.
The Fed may have adopted a hawkish tone at its October meeting, but it could change its tune if the economic data
starts to deteriorate or if the US catches the disinflation bug from the steep drop in oil prices. The other major risk to
the Fed outlook is the dollar. So far the Fed has been remarkably tolerant of a strengthening greenback while other
major central banks have been happy to see their currencies depreciate, including the Bank of Japan and the ECB. If
the strong dollar trend continues in the first half of next year, the Fed may decide that it no longer wants to lose the
race to the bottom. If the Fed starts to talk down the prospect of multiple rate hikes next year then we could see a sharp
reversal in the dollar, and some respite for emerging market currencies that have fallen sharply against the greenback
including the Brazilian real, South African rand and Russian ruble.
While we expect the dollar to reign supreme in Q1 2015, its performance for the second half of the year could be tricky
depending on the Fed’s tolerance of dollar strength. FX markets could face another year trying to parse Fed statements
to see if Fed members are happy with the level of the buck. Thus, 2015 could be a year of two halves for the Fed: the
first half could be about making the long-awaited rate hike, while the second half could be a more cautious Fed who
tempers its rate-hike talk to limit dollar upside.
Eurozone: To QE or Not To QE, That Is the Question…
Big things are expected of the European Central Bank in 2015. After the Fed ended its quantitative easing program in
October, the market has been waiting for the ECB, along with the BOJ, to take its place by providing the global financial
system with Fed-style liquidity. But while the BOJ have been willing to step into the Fed’s shoes by announcing a second
round of QE late last year, the same may not be true for the ECB.
The ECB held steady at its December meeting; however, ECB President Draghi has sounded more supportive about
the prospect of further easing and potential QE in recent weeks. As we move into 2015 we continue to think that the
bar to QE remains high. According to German press reports after the December ECB meeting, three members of the
ECB’s six-strong executive board refused to sign off Mr. Draghgi’s statement. Considering there is still a legal challenge
outstanding on the ECB’s OMT program, don’t expect the opposition to QE to soften by the time of the first ECB meeting
of 2015 on January 22nd.
Our services include products that are traded on margin and carry a risk that you can lose more than your initial deposit.
© 2014 FOREX.com
5
A caveat to our theory that the ECB will not embark on QE would kick in if inflation falls below 0% in December. If
this happens then we could see the ECB take some action, but we doubt that the ECB will fill the Fed’s shoes when
it comes to QE, or even match Draghi’s pledge to boost the ECB balance sheet by EUR 1 trillion. Draghi talked about
this six months ago and said a larger balance sheet was needed to ward off deflation fears. But since then nothing has
happened and the ECB’s balance sheet has shrunk by EUR 100 billion.
But will an ECB QE program actually work? Unfortunately for the ECB, the answer isn’t as clear as it may hope. The
two most recent large-scale versions of QE were the US version (QE3) and the Japanese version (QQE); one has been
a resounding success so far, the other not so much. As the US enjoys accelerated job growth, healthy GDP growth
and inflation on the lower end of acceptability, Japan has experienced a worsening economy and still too low inflation
despite the enormous size of stimulus in terms of the size of their economy.
What Europe needs to find is at least some semblance of what the Fed has done with its version of QE. However, you
will notice that there is a “3” next to the Fed’s QE which means that this was the third time around for the world’s most
influential central bank, so getting it right isn’t easy.
The easiest outcome for Mario Draghi would be a large take-up of its longer-term refinancing operations (known as
TLTRO). Back in September the Bank only managed to attract bids to the value of EUR 82.6 billion for its cheap loans.
The market will be looking for take-up around the EUR 150 billion mark at future auctions. If this happens then QE may
not be deemed necessary, which could save Draghi a fight with his German colleagues.
Apart from QE, the ECB could have more pressing problems to deal with in 2015. Greece is expected to have a general
election sometime in spring, which could see a win for the anti-euro SYRIZA party. This may widen sovereign credit
spreads, and could make it hard for Greece to remain in the currency bloc if its new government does not adhere to the
strict terms of its 2010 bailout.
The impact on the EUR is likely to be negative. Widening sovereign spreads combined with QE could trigger another leg
lower to below 1.20 vs. the USD. However, even though deflation fears and Greek political risks could prove toxic for the
EUR, bears need to be careful. Firstly, the EUR has already had a sharp fall vs. the USD. Secondly, the market is already
short the EUR which leaves the single currency at risk of a reversal. Lastly, as we mention above, the Fed may not be
comfortable with dollar strength and could adjust its policy towards the middle of 2015 to limit upside in the greenback.
Overall, the outlook is negative for the EUR, albeit with a potential slowdown in the pace of depreciation in the second
half of 2015.
Japan: Sowing the Seeds of Hyperinflation
Do a quick Google search on “Japan” and “hyperinflation” and you’ll likely come across a litany of articles and
prophecies declaring that The Land of the Rising Sun has already pulled a Wile E. Coyote; namely that they’ve
already run off the inflationary cliff, but we’re just waiting for them to realize it and plummet to the earth. Granted,
some of those doomsayers were saying the same thing back in 2010 or 2013 or probably even before then if you dig
deep enough. The problem for these prognosticators is that it hasn’t come to fruition despite all the warning signs
blinking red across the board. In fact, for years Japan has been adding to situations that historically help trigger a
hyperinflationary event.
Our services include products that are traded on margin and carry a risk that you can lose more than your initial deposit.
© 2014 FOREX.com
6
One of the most frequently quoted metrics for determining the future fate of Japanese inflation is their debt-to-GDP
ratio, or gross government debt as a percentage of GDP. In this category, Japan is at the top of the world at 237.92%,
and they really shouldn’t want to be there. The list of nations that are actually doing BETTER than Japan in this category
is a who’s who of economic strife: Zimbabwe, Greece, Portugal, Italy, Iceland, Ireland, and Lebanon, just to name a few.
In its defense, Japan does have plans to try to lower that debt-to-GDP burden as a consequence of Prime Minister
Shinzo Abe’s economic stimulus program (lovingly dubbed “Abenomics”), but it hasn’t gone according to plan so far. In
an effort to bring budgets closer to actual revenue there was a consumption tax hike back on April 1st 2014 (that wasn’t
an April Fool’s joke), which was supposed to be followed by another hike in 2015 that has now been delayed for 18
months due to a struggling economy. In addition, the Bank of Japan has increased Quantitative Easing in an effort to get
interest rates so low that Japanese investors stop buying Japanese Government Bonds.
Past hyperinflationary episodes were largely caused by an increase in money supply to help pay off debts, the most
well-known being the Weimar Republic in Germany in the 1920s. In an effort to bring Germany out of recession and pay
off reparation debts from WWI, the German Papiermark was devalued by 50% in 1919 which kicked off the inflationary
episode economists love to reference. Eventually, the Papiermark was replaced by the Rentenmark at a conversion of 1
trillion to 1 in 1923, which is utterly ridiculous when you think about it. However, it wasn’t just debt that helped trigger
hyperinflation; there was also political uncertainty and overall loss of confidence as the Great Depression was felt
especially hard in Germany.
While Japan hasn’t outright devalued their currency in one fell swoop like Germany did back in 1919, they have
devalued it by over 50% in the last two years as the USD/JPY has risen from sub 80 to over 120 at the time of this
writing. In addition, the Bank of Japan has pledged to add to their already large QE (15% of GDP per annum) by double if
the economy doesn’t start to recover, which would take that already burdensome debt-to-GDP ratio even higher. When
Germany started experiencing hyperinflation, their debt-to-GDP ratio was just under 300%. Also Japanese politics are
in flux as Abe has called for new elections and Japanese consumer confidence has declined in the latter half of 2014.
When perceived as a whole, it appears that Japan has sown all the necessary seeds to bring about hyperinflation in
the struggling state. However, once again, these seeds have been sown for many years now as doomsayers have been
keen to point out. So will 2015 be the year that Japan finally falls down the rabbit hole? Whether hyperinflation is the
ultimate result or not, it appears that the JPY might be losing even more value as the hyperinflationary seeds continue
to germinate.
Bank of England: Shifting to a Dovish Stance
The last weeks of 2014 saw a sharp reduction in expectations around the timing of the first rate hike from the Bank
of England. In the middle of 2014 the market had expected the BOE to hike rates at the end of Q1 2015; however, after
a sharp fall in inflation and a deterioration in the UK’s growth outlook, expectations for the first rate hike have been
pushed back to August 2015.
This recalibration of rate expectations for the UK has been reflected in the pound, which has fallen more than 3%
versus the USD since the start of the fourth quarter. The outlook remains bleak for the pound as we start the new year
on the back of falling inflation expectations and monetary policy divergence with the Federal Reserve in the US.
Falling inflation is a big risk for the pound this year, as the BOE may find it tough to hike interest rates if prices continue
to fall. The Bank of England’s 12-month inflation expectations survey for November saw expectations fall to their lowest
level since February 2010 (see the chart below). This is problematic for the Bank as maintaining price stability is its only
mandate, yet inflation is falling sharply and could drop below 1% early next year.
Our services include products that are traded on margin and carry a risk that you can lose more than your initial deposit.
© 2014 FOREX.com
7
If inflation continues to miss the BOE’s 2% target rate then we would expect some more dovish talk from the MPC.
While we don’t think that they will boost policy action to try and stem the disinflationary trend, we do think that they will
be happy to push back market rate expectations until late 2015.
From a currency perspective this is pound negative, but economic fundamentals may also weigh on the pound next year.
The UK’s current account deficit is still a large 5.17% of GDP; this compares with a deficit of 2.25% of GDP in the US
and a 2.41% surplus in the Eurozone. We think that the market will be less forgiving of the UK’s economic imbalances,
especially as the other major economies have made large improvements. Added to this, political risk is back to the fore
with the General Election in May (see our election preview for more).
The pound’s performance next year could be somewhere in the middle between the US dollar and the Euro. We think it
will continue to fall versus the USD due to political risk, a deteriorating growth outlook and divergent monetary policy
paths for the Fed and the BOE, while it may continue to rise versus the EUR, especially if the ECB embarks on QE at
some stage this year.
	 Figure 2:
	 Source: FOREX.com
Our services include products that are traded on margin and carry a risk that you can lose more than your initial deposit.
© 2014 FOREX.com
8
Australia and New Zealand Continue
to Head in Different Directions
It’s going to be a very important year for Australia and New Zealand. Both economies face many trials in the year ahead,
but New Zealand may emerge as the victor in the Trans-Tasman battle for growth.
In Australia during 2013-14 a strong property market showed potential to spur economic growth in the broader
economy, but the rest of the economy failed to respond and activity at the ground level remains restrained. This is set
against a backdrop of retreating mining investment and falling key commodity prices, which doesn’t bode well for
Australia’s all-important resources sector.
It’s not all doom and gloom Down Under, however. There is some hope that a falling exchange rate and accommodative
monetary policy will carry the economy through 2015. Since September 2014 the Australian dollar has taken a mauling,
with AUDUSD down over 10% at the time of writing (this report was written in early December). The onus is on
policymakers to help support the economy and foster sustainable economic growth. Further monetary policy loosening
by the RBA next year should keep the economy from stalling, but GDP growth may fall to around 2.5% in 2015. This
assumes the exchange rate remains in the low 0.8000’s and commodity prices don’t fall off another cliff.
In NZ, the economy is much better situated to deal with threats to growth originating from falling commodity prices
and even lackluster global commodity demand. NZ is heavily reliant on certain commodity exports, particularly dairy
products. However, NZ has other avenues of growth to fall back on.
Rebuilding efforts in Canterbury, a generally solid construction market and strong net immigration are expected to
augment domestic demand in 2015. These reliable sources will provide a solid platform for growth this year. At the
same time, the economy is dealing very efficiently with high levels of growth. In other words, it can sustain a high
growth rate without booming inflation, which in turn gives the RBNZ more room to keep monetary policy at a more
accommodative level for longer.
The differing economic conditions and tolerances between Australia and NZ are expected to widen the interest-rate
gap between the two nations. In Australia, the threat of a strong housing market is always going to be in the back of the
RBA’s mind, but it can use macro-prudential tools to limit price pressures in the housing market. This will free up the
RBA to use traditional monetary policy to support the broader economy. As such, we expect the RBA will cut the official
cash rate next year. We believe that the RBA may hike rates twice next year, which would bring the cash rate to 2.00% by
the end of 2015.
Across the Tasman, the RBNZ is expected to begin tightening monetary policy next year, but not until Q3 or Q4. Easing
price pressures in the housing market and only mild inflationary forces in the rest of the economy, largely due to falling
commodity prices, mean that the RBNZ can maintain looser monetary policy for longer than would be possible if
inflationary pressures were stronger. We see the RBNZ raising the cash rate to 3.75% late in the third quarter or early
in Q4 2015.
$
€
Our services include products that are traded on margin and carry a risk that you can lose more than your initial deposit.
© 2014 FOREX.com
9
Figure 3:
Source: FOREX.com
The widening gap between monetary policy expectations in Australia and NZ is already playing out in the FX market.
AUDNZD was assaulted by the bears in the final quarter of 2014 and we expect it will continue to broadly weaken in
2015. In fact, we put AUDNZD below 1.0500 by the end of year with a 50% chance it will break parity. Looking at figure 4
we can see that AUDNZD still has further to fall based on the current divergent monetary policies of NZ and Australia.
Figure 4:
Source: FOREX.com
Our services include products that are traded on margin and carry a risk that you can lose more than your initial deposit.
© 2014 FOREX.com
10
RBA policy action next year may also keep AUDUSD depressed, although this is largely dependent on the outlook for US
interest rates which is in turn dependent on the US labor market and inflation numbers. NZDUSD is also susceptible to
widespread USD strength and possible central bank intervention on the part of the RBNZ.
China’s Slow Descent Continues
Beijing has been forced to reconsider its position regarding the use of broad-based stimulus measures to support
China’s decelerating economy as more threats emerge both externally and internally. At the end of 2014 the PBoC
shocked the market by cutting interest rates for the first time since July 2012. Despite some initial comments from
the PBoC suggesting that this move shouldn’t have signaled a change in policy, the move was unquestionably more
aggressive than the targeted stimulus measures we witnessed earlier in the year. The door is now open for further
easing from Beijing as it attempts to prevent its economy from stalling this year, but we still suspect real GDP will slow
to 7.0% by year-end, from an estimated 7.4% in 2014.
The mixture of lackluster global growth, falling property prices and stagnant domestic demand is weighing on China’s
growth outlook. Early in 2014 Beijing was attempting to support the economy without stoking China’s red-hot property
market. This was done by introducing a raft of measures aimed at cooling the booming market. Later in the year most
of these tools were slowly withdrawn as property prices began to tumble across the board. In fact, property prices were
falling so precipitously that it raised concerns about a possible crash and despite the relaxation of property curbs these
concerns haven’t been entirely alleviated (out of the 70 cities surveyed, 69 are still experiencing falling property prices –
see figure 5).
Figure 5:
Source: FOREX.com
Our services include products that are traded on margin and carry a risk that you can lose more than your initial deposit.
© 2014 FOREX.com
11
At the same time Beijing must addresses other weaknesses emerging from China’s economy. There are two main
sources for growth in a modern economy: domestic demand and global demand. China has historically been an export-
based economy, but it is attempting to transition towards a more effective growth model that takes advantage of China’s
massive population. As urbanization continues to transform China into a more developed economy, it can tap into more
reliable and sustainable growth conduits from within its own economy.
However, the near-term outlook for domestic demand isn’t good, particularly given recent soft import data, stagnant
inflation numbers and persistent disinflation in producer prices. While China can still largely rely on its robust export
market for growth, it cannot seek long-term sustainable growth from this area. This puts even more focus on the
strength of domestic demand in China. As is evident from figure 6, consumer price growth has flatlined and imports are
declining; some of the weak import data can be attributed to falling commodity prices but some is clearly the result of
softening domestic demand.
What Kind of Response Can We Expect from Beijing?
Beijing has been carefully managing China’s slowdown since it began, and nothing is expected to change in this regard.
Throughout 2014 the PBoC was using targeted stimulus to support the financial sector by injecting liquidity into the
nation’s biggest banks and small lenders, either through direct injections or by lowering funding costs. Later in the year
China’s central bank cut its one-year lending rate by 40 bps to 5.6% and its one-year saving rate by 25 bps to 2.75%. As
Figure 6:
Source: FOREX.com
Our services include products that are traded on margin and carry a risk that you can lose more than your initial deposit.
© 2014 FOREX.com
12
we stated earlier, this signaled to the market that the PBoC is primed to use its big guns once more to spur demand.
Yet more monetary easing may be needed in China, although the decision to ease further must be weighed against
the advancement of structural reforms and local government debt management. Deposits at China’s major banks are
suffering as people seek out other investment alternatives, so now these banks are pressuring the PBoC to cut its 20%
RRR, thereby allowing them to lend more of their deposits. Given the ineffectiveness of the first interest-rate cut in two
years, the threats to growth, the fact that inflation is well below target and the PBoC’s apparent alacrity to pull out its
big guns, we believe the bank may cut interest rates again as well as banks’ Reserve Requirement Ratio (RRR).
The Yuan May Soften again in 2015
Part of the attractiveness of CNY-denominated assets are the generally high yields on offer as well as the safety that
comes from the guarantees that Beijing has placed on some assets. The fact that the yuan was thought of as a one-
way bet only encouraged more hot money into China, thereby compounding the upward pressure on the exchange
rate. While the idea that the renminbi could only strengthen was mostly dispelled earlier this year by the PBoC as they
engineered a decline in the exchange rate, the aforementioned attractiveness of the yuan couldn’t be ignored.
However, the severity of the economic issues facing China may see the yuan weaken for its second year in a row against
the US dollar. The prospect of further interest rate or RRR cuts on the back of softening economic conditions in China
make the renminbi less attractive and increase the PBoC’s motivation to engineer a fall in the exchange rate to support
exporters. Further policy loosening could flood the market with renminbi, especially if the PBoC elects to cut the RRR.
This may see USDCNY push towards 6.35 by the end of 2015.
Figure 7:
Source: FOREX.com
Our services include products that are traded on margin and carry a risk that you can lose more than your initial deposit.
© 2014 FOREX.com
13
2 2015 EQUITIES OUTLOOK
2014 has been another great year for US equities and a mixed one for Europe. As of early December, the S&P 500 was
up 13% year to date, Nasdaq 100 up 22% and Dow Jones was 9% higher. In contrast, Germany’s DAX index was ‘only’
up 7% while Britain’s FTSE was literally flat year to date. Despite the geopolitical tensions in Ukraine and the Middle
East and the slump in oil prices, investors’ appetite for equities has been strong as global central banks stick to their
accommodative monetary policies.
Some of the themes from 2014 are likely to remain in place in 2015 for stocks, especially the support from central
banks. The ECB for example may move to expand its asset purchases program to include government debt as it
fights deflationary threats from falling oil prices and weaker wage growth. This could be a boon to German stocks
in particular. The US is again likely to lead the global economic recovery while the weaker commodity prices
could alleviate the pressure on emerging markets. But weaker oil and metal prices could also mean the FTSE, a
commodity-heavy index, could underperform once again. As monetary policy in the US is heading towards the path of
normalization, we envisage only moderate further gains for US stocks, at least compared to recent years. But from a
technical point of view, the major US indices are still not in the parabolic phase of the bubble, assuming one is forming.
So, there could be further sharp gains to come before the bubble potentially bursts, perhaps toward the end of 2015.
DAX Could Outperform in 2015
Although we think that the economic outlook for the Eurozone is fairly bleak for 2015, we think Germany will lead
growth in the Eurozone and we are therefore bullish on the DAX. After consistent falls in the German Ifo Business
Climate index throughout 2014, there was an upward surprise in the November reading. Though one month’s worth
of data may not be a game changer, we think the Ifo will continue to improve in 2015. The lower oil prices will likely
help lower the production costs for German manufacturers and builders, which could in turn boost their bottom lines.
Traders should watch the “Business Expectations” sub-index of the Ifo very closely this year as it tends to lead the
Business Climate.
¥
€
Figure 8:
Source:
FOREX.com
Our services include products that are traded on margin and carry a risk that you can lose more than your initial deposit.
© 2014 FOREX.com
14
If the Ifo does improve as we expect it to, the DAX index could potentially outperform the US indices, for it may also have
the added support of the European Central Bank who may embark on QE (see our euro section for more). If introduced,
this could provide further support for stocks as the ultra-loose monetary policy from the ECB will hopefully encourage
households and businesses to spend more. A weaker euro may also be positive for the export-oriented German
economy.
Technical Outlook : DAX
At the time of this writing the DAX was just shy of the 10,000 mark. This level had provided significant resistance earlier
in 2014 and so there is a chance the index may hesitate again around this psychological area as the buyers continue to
take profit going into year-end. Nevertheless, the long-term technicals are still supportive, which bodes well for at least
the early part of 2015. The DAX is clearly in an upward trend, as pointed out, for example, by the still-rising 50-week
moving average. Indeed, the momentum indicators are trending higher too: the weekly MACD has just created a bullish
crossover while the RSI has broken its downward trend. We think that there is further momentum left in this rally that
started in mid October. Thus, a decisive break above the 10k mark, which would be a very bullish development from a
technical point of view, may be on the cards.
As the DAX is trading near the record high it had achieved earlier in 2014, Fibonacci extension levels can be handy to
give us a view of where this index could go next if we are to expect further upside. As you can see on the chart below,
we have plotted the extension levels of the most recent sell-off from the previous record high of about 10050 to a low of
8350. The 127.2% extension level of this move comes in at 10510 while the 161.8% is just shy of 11100. Also, in between
these levels is 10985; this level corresponds with the 161.8% Fibonacci extension of the entire 2007-2009 crash. So,
our key bullish targets for 2015 are 10510, 10985 and 11100. Meanwhile, some of the key supports we are watching for
2015 include 9800, 9465 and 9000, levels that were formerly resistance. We will be paying particularly close attention
to the bullish trend line that has been derived from connecting the low point of 2011 with that of 2014. If and when
the DAX breaks below this trend, we could easily see a sharp correction. An even more bearish outcome would be a
decisive break below the October 2014 low of 8350. But our base case is that the DAX could continue to appreciate while
expectations for further ECB action run still high. Thus, we expect a couple of our bullish targets could be reached in
the first quarter of 2015.
Figure 9:
Source: FOREX.com.
Please note this
product is not available
to US clients.
Our services include products that are traded on margin and carry a risk that you can lose more than your initial deposit.
© 2014 FOREX.com
15
Commodity-Heavy FTSE 100 May Struggle Again
The UK’s FTSE 100 could be among the European indices which may underperform in 2015, not least because, unlike
the ECB, the Bank of England is unlikely to ease policy further. The relatively higher interest rates in the UK may put
further upward pressure on the pound against the euro which could weigh on exports to the Eurozone – the UK’s
largest trading partner. Meanwhile, miners and energy stocks could remain under pressure if commodity prices stay
weak in 2015, which we think will be the case. The energy sector makes up 14% of the FTSE 100, with BP and Shell
alone accounting for more than 10% of the index. Thus, if the weaker oil prices persist in 2015, these companies could
weigh heavily on the FTSE 100 as they have done towards the end of 2014. Another factor that could weigh on the FTSE
100 is uncertainty ahead of the May 2015 general election and financial shocks due to increased regulations. In the
Autumn Statement, Chancellor George Osborne announced plans to raise £4bn by limiting banks’ ability to use losses
suffered during the global financial crisis to cut taxes on current profits. However, Mr. Osborne also unveiled new stamp
duty rates that could save 98% of UK homebuyers money. In theory, this should help to increase demand for mortgages
and also homebuilding, thus providing support for both banks and homebuilders. Support for the FTSE could also come
in the form of increased M&A deals. The stronger US dollar was partly responsible for the M&A boom in 2014 and if
this trend continues then so too could the number of deals. A weaker GBP/USD in 2015 could make British companies
attractive takeover targets for US firms.
The Technical View: FTSE 100
The FTSE has had many unsuccessful attempts to break above 6900 over the past two years. The last time they tried
to break above 6900 was in September of 2014 when the index hit a fresh multi-year peak of 6905; but here, the rally
once again stalled and the pace of the selling accelerated soon after. From that peak, the index went on to drop by 835
points to a low of 6070 by mid-October when the markets bottomed out. The bears were thus unable to break the major
support area between 6000 and 6100 for the second time. This is potentially a very bullish outcome and we think that if
the FTSE were to make a few more attempts at 6900 it may break decidedly higher.
On a side note, it is worth pointing out that the long period of consolidation below 6900 suggests that an eventual
breakout could potentially be quite significant in terms of magnitude. This would not only deliver a hammer blow to
the existing sellers but also encourage fresh buyers to enter the market – particularly those who have so far been
discouraged by the index’s lackluster performance in recent years.
A decisive break above the 6900 level on the FTSE could pave the way for a move towards the Fibonacci extension
levels around 7130/5 (127.2%) and then 7420/5 (161.8). The latter also corresponds with the upper resistance trend
of the bullish channel. The intra-day record high of 6950, achieved in December 1999, should also be paid some
attention should we get there. Meanwhile on the downside, the key supports that we will be watching in 2015 include
the abovementioned 6000/6100 range, as well as the long-term Fibonacci retracement levels. Ahead of these are some
near-term support levels, including 6525 and 6400.
Our services include products that are traded on margin and carry a risk that you can lose more than your initial deposit.
© 2014 FOREX.com
16
Stronger Dollar = Bad News for Earnings
In 2014, US companies continued to surprise with their earnings results as the economy expanded at a moderate pace.
According to research from FactSet, the telecoms, financials, material and healthcare sectors did particularly well in
the third quarter while consumer discretionary was the only sector which reported a year-over-year decline in earnings.
Compared to a year earlier, the overall S&P 500 earnings growth rate was a healthy 8% while the revenue growth
was 4% in Q3. Some 77% of the S&P companies managed to beat profit expectations, making this the best quarterly
performance since the second quarter of 2010 when 79% of the companies beat earnings estimates.
As you can see in the chart below, US stocks and the dollar moved together for sustained periods in 2014. If the dollar
continues to push higher in 2015 then this could be bad news for US exports. Clothing retailers and automakers could
be among the worst hit, particularly in Europe where the euro may weaken further amid continued ECB intervention
and lackluster growth.
Figure 10:
Source: FOREX.com. Please note this product is not available to US clients.
Our services include products that are traded on margin and carry a risk that you can lose more than your initial deposit.
© 2014 FOREX.com
17
A slowing global economy could start to hurt US corporate profits in Q4 2014. During the first two months of the
quarter, analysts have lowered their Q4 earnings estimates by 3.9%. Unsurprisingly, the estimate reductions were led
by the commodity-based sectors following the declines in crude and metal prices. Analysts have also trimmed their
estimates for Q1 and Q2 of 2015, although this is subject to change closer to the time.
Meanwhile companies themselves have been lowering their forecasts, with 76 out of 95 (80%) already issuing negative
earnings guidance for Q4. So far, however, the markets have ignored these fundamental developments with the S&P
trading at a record high at the time of this writing. The divergence between the index and the Q4 earnings estimates
therefore increases the probability for a correction at some point in early 2015.
But despite our slightly negative view on earnings, we are still overall bullish on stocks at the start of 2015. Some of
the key risks to our outlook in 2015 include among other things the deterioration in emerging market economies,
stagnation in the Eurozone and central banks’ inability to defeat deflation or at least create inflation (e.g. in Japan and
now the Eurozone). The ongoing geopolitical tensions in Ukraine and to a lesser degree in the Middle East are also
a concern. Meanwhile the Volatility Index (VIX) continues to trade near historic lows which suggests that the bullish
complacency is extremely high.
Figure 11:
Source: FOREX.com.
Our services include products that are traded on margin and carry a risk that you can lose more than your initial deposit.
© 2014 FOREX.com
18
Technical View: S&P 500
The S&P 500 has been trending consistently higher in recent years. The recent acceleration in the trend suggests that
the index could smash through this barrier and embark on a vicious rally. If it does that, then one should proceed with
extra caution for we will have potentially entered the parabolic phase of the stock market bubble. Even then, the rally
could extend far beyond most people’s imagination and in a very short period of time, too. But eventually the bubble
will burst – the same way, for example, that silver’s did in 2011 – and we could then see a large unwinding of longs and
the start of a major downward trend. When this will happen is a million-dollar question, but a good clue will be the first
sharp pullback following an extensive parabolic-like rally. But until that happens, the “trend is your friend.”
As the S&P is trading in unchartered territories, Fibonacci extensions and psychological levels are tools we can use as
projections for potential turning points or bullish targets. The first such area is between 2137 and 2147: the lower end
of this range corresponds with the 161.8% Fibonacci extension of the entire 2007 to 2009 crash while the upper end is
the 161.8% extension of the correction we saw around September/October of 2014. We envisage that the S&P will at
least pause for breath around this area if and when it gets there. Beyond this area are the psychological levels of 2200
and 2300 and further out still is the 261.8% Fibonacci extension at 2350. The latter looks like an extremely ambitious
target, but we could get there in the event of a parabolic-like rally. Meanwhile old resistance levels are likely to turn
into support. In this regard, the area around 2000/22 should be watched carefully. If the index breaks below here then a
move towards the 50-week moving average or the support trend of the bullish channel could be next. A break below the
latter would be a particularly bearish development.
Figure 12:
Source: FOREX.com. Please note this product is not available to US clients.
Our services include products that are traded on margin and carry a risk that you can lose more than your initial deposit.
© 2014 FOREX.com
19
3 2015 COMMODITIES OUTLOOK
Crude Oil
2014 was a wild ride for crude oil traders. After initially moving sideways in a relatively narrow range, prices embarked
on a surprise rally at the start of the summer as traders put the excessive supply and weaker demand worries behind
them and concentrated on the geopolitical risks in the Middle East and, to a lesser degree, Ukraine. In particular it was
the advance of the terrorist group ISIS in Iraq that unnerved oil speculators the most. However, once traders realized
that most of the fighting was taking place in the country’s north, well away from the oil export terminals in the south,
they quickly unwound their speculative long positions. This caused the price of oil to fall viciously in the space of just a
few weeks, leading to the breakdown of a long-term bullish trend line on the Brent contract which encouraged further
followup technical selling. Meanwhile the selling was exacerbated by the return of Libyan oil production towards
normal levels following several months of rebel occupation of major oil terminals in the country. At the same time
Iran was allowed to sell more oil as the country succumbed to western pressures and agreed to lower its uranium
enrichment levels. The US and other non-OPEC oil producers were also contributing towards the supply glut, thanks
mainly to the boom in shale oil output. As the world’s supply of oil increased dramatically and the growth in demand
remained weak, prices took a huge drop in the second half of the year. The sell-off was made worse in November after
the OPEC refused to concede more ground to shale producers by maintaining its production quota of 30 million barrels
per day (mbpd) intact.
Not only did the OPEC refuse to lower its production target, the cartel’s most important member, Saudi, has been
selling oil cheaper than international benchmarks to its customers in Asia and the US. In other words, Saudi has
potentially started a price war as it seeks to defend its market share against the rising US shale output. If this trend
continues, there could well be further falls in the price of oil in early 2015. Whether or not US shale producers will be
able to weather Saudi’s proverbial counterattack in excessive oil production is difficult to say, but one thing for certain
is that the weaker oil prices are undoubtedly chipping away at their margins. This is reflected in the huge drops in
share prices of the three large US companies that are involved in the fracking business: Halliburton, Baker Hughes and
Weatherford. Since the summer of 2014, these stocks have lost between 25 to 50 percent of their value.
The apparent desire of US shale producers to scale back their operations, combined with the very weak oil prices,
suggest that the supply of US oil may now turn out to be a lot less in 2015 than it would have been the case under
calmer market conditions. The major oil forecasters such as the OPEC, EIA and IEA may therefore have to cut their
already-optimistic non-OPEC production estimates. The prospects of a tighter oil market therefore means prices could
well stabilize very soon, particularly given the market’s exaggerated response to the OPEC news in late 2014.
Still, with Saudi Arabia unwilling to cut back its production levels, and this combined with the threat of oil supply
continuing to rise from other OPEC countries such as Iran, Iraq and Libya, concerns over excessive supply are unlikely
to go away any time soon. With the OPEC being responsible for about 40% of global oil supply, further increases in
production from this group may keep a lid on prices for the foreseeable future. A weak global economic recovery also
argues against a major price recovery in 2015.
Taking the supply and demand forces into consideration, it is really difficult to be bullish on crude oil going into 2015. At
the same time, the extent of the price plunge makes us think that further sharp losses will be limited. So, overall, we
envisage only moderate further losses in 2015 and expect prices to be a lot less volatile compared to 2014. We think that
if prices were to stage a meaningful recovery, it would more likely be towards the end rather than start of 2015 when the
global economy will hopefully be on a more stable and sustainable path of recovery. The main risk to our moderately
bearish 2015 oil outlook is the escalation of geopolitical risks in the Middle East and North Africa (MENA) regions; we
strongly believe that the market is under-pricing these risks at the moment. Meanwhile uncertainty over the direction
of the US monetary policy and its impact on the dollar poses an additional risk to our forecast. A stronger dollar should
undermine buck-denominated commodities, all else being equal.
Our services include products that are traded on margin and carry a risk that you can lose more than your initial deposit.
© 2014 FOREX.com
20
Crude Oil Technical View
Brent
Even from a technical point of view it is extremely difficult, if not impossible, to predict when oil prices may bottom out.
But the speed of the drop since mid-2014 suggests that a recovery may not be too far out. On top of this, the weekly RSI
– at just above 10 – has drifted further into the extreme oversold territory. Meanwhile prices have now fallen about $40
since the last major reversal pattern occurred i.e. the break of the long-term bullish trend line. The last time a major
reversal pattern came about was in early 2012 when a double top/false breakout pattern drove prices down viciously.
Then, too, oil prices dropped about $40 from a high of above $128 to around $88, in a similar, parabolic-like, manner.
Thus if history were to repeat itself, Brent oil prices could find a base around or just below $67/$68. That said, the
fundamental drivers are different this time around and there has been a clear shift in paradigm, so prices could take
another or additional legs lower before stabilizing in early 2015.
A key support level to watch out for is $68. This is where Brent had previously formed a double bottom reversal back in
2010. In addition, oil has now achieved at least a 61.8% retracement from its peak in 2012. But that’s not to say prices
will necessarily bottom out here. Indeed, if the bears manage to push prices lower then that could give rise to further
followup technical selling towards the next psychological round handles at $65 followed by $60. The long-term 78.6%
Fibonacci retracement level comes in around $56, and below that is the next psychological level at $50. At this stage,
the major long-term resistance levels that we will be watching are $80 and $88.50 – levels that were formerly support.
Figure 13:
Source: FOREX.com. Please note this product is not available to US clients.
Our services include products that are traded on margin and carry a risk that you can lose more than your initial deposit.
© 2014 FOREX.com
21
WTI
Like Brent, WTI (or US) crude was also testing a major support area when we were putting this report together: around
$65. As well as a major psychological level, this is also where a long-term bullish trend line comes into play. In addition,
the 61.8% Fibonacci retracement level of the 2008-11 bull trend is also just below this $65 mark. So, while a bounce
back here is possible, another potential break lower could pave the way for fresh selling pressure towards $60 and
potentially even $50 at some point in 2015.
Given the abovementioned fundamental drivers, we are only expecting moderate price recoveries throughout 2015. In
our view, the buyers would do very well to push WTI prices above the $90 handle, let alone $100, at any point in 2015.
But a counter-trend move towards $80 is more plausible particularly given that prices are already oversold.
 
Figure 14:
Source: FOREX.com. Please note this product is not available to US clients.
Our services include products that are traded on margin and carry a risk that you can lose more than your initial deposit.
© 2014 FOREX.com
22
Precious Metals
Gold had a quiet year in 2014 as it traded inside a $260 range in a sideways trend. In fact, at the time of this writing in
early December, the shiny metal was hovering around the flat line for the year – albeit near the lower end of its yearly
range. But given that the US dollar and equities have both risen considerably, gold has held its own remarkably well
as it can move in the opposite direction of these two assets (see the chart below). The yellow metal’s performance as
an asset that pays no interest or dividend becomes even more impressive when you consider the fact that inflation has
been virtually nonexistent in the major global economies. Nevertheless, the general bias and market sentiment was
bearish towards gold and generally many market participants expect this theme to continue in 2015.
Something historic could be happening to the gold price. If the greenback continues in its upward trajectory, but gold
fails to head in the opposite direction (or at least by a similar magnitude), then that would suggest investors are finally
starting to treat gold as an independent asset, not a USD-denominated FX pair.
Physical Demand could Increase in Early 2015
There was actually a good reason for gold to have climbed higher in November, which was driven by news from the
Figure 15:
Source: FOREX.com. Please note this product is not available to US clients.
Our services include products that are traded on margin and carry a risk that you can lose more than your initial deposit.
© 2014 FOREX.com
23
physical market; in a surprise move at the end of that month, India lifted some of the gold import restrictions. The
so-called 80:20 rule, requiring importers to sell 20% of their shipments to jewelers for re-export, was abolished
with immediate effect. Although the 10% import tax is still there and likely to remain in place throughout 2015, the
removal of the 80:20 rule may help to shore up the physical demand in the former top gold consumer nation.
Meanwhile the main wedding season in India is now underway and will last until about late January. During this time,
large amounts of gold jewelry can be purchased by the Indians. Then it will be over to China where jewelry purchases
are likely to increase ahead of their Lunar New Year on February 19. Indeed, we think that the main source of
support for gold will probably come from the physical rather than the paper market in 2015 because, as mentioned,
speculators are more likely to hold stocks rather than gold amid the record-low interest and inflation rates.
Technical Outlook
Gold
The pace of gold’s decline slowed down towards the end of 2014 as the sellers once again struggled to hold their
ground below the key $1180 level. As can be seen on the chart, the yellow precious metal has shown relative
strength around this area for the best part of two years now. This has caused the Relative Strength Index (RSI) to
create several instances of positive divergence, confirming that the bearish trend has weakened. In addition to
horizontal support at $1180, gold has also found some support from its long-term 61.8% Fibonacci level at $1155.
What the bulls would like to see now is a break above the long-term bearish trend and resistance around $1240. If
seen, this could lead to the unwinding of further bearish positions which could thus add to the bullish momentum.
The next significant levels beyond $1240 are $1345, $1390 and $1435. These are among our bullish targets for 2015
(subject to price breaking decisively above $1240 first).
However as things stand, the long-term trend is still technically bearish for gold, so the vast majority of the market
may still be positioned short. Therefore the possibility for further losses is there. If gold breaks below the 61.8%
Fibonacci level, there is little support seen until the next psychological barrier at $1000.
Figure 16:
Source: FOREX.com.
Our services include products that are traded on margin and carry a risk that you can lose more than your initial deposit.
© 2014 FOREX.com
24
Silver
The price action in silver suggests that the end of the four-year bearish trend in approaching, with the monthly chart
below showing an almost perfect example of how the different phases of a bubble form. Although the grey metal has
bounced off the key psychological $15 mark, there is still the possibility for perhaps one more vicious sell-off that could
push its price momentarily below the long-term bullish trend line before it stages a recovery as it returns to the mean.
In other words, we probably haven’t seen the “despair” part of the “blow off” phase yet. If we do witness that in 2015,
the price of silver could potentially fall to around $10 before the bubble deflates fully.
But whether or not it will get to $10 is anyone’s guess. Instead, traders should watch closely what silver may do if it
rises towards the old key support around $19; only a decisive break above here will signal that the long-term downward
trend is over. Until then the trend will remain bearish for silver.
Figure 17:
Source: FOREX.com.
Our services include products that are traded on margin and carry a risk that you can lose more than your initial deposit.
© 2014 FOREX.com
25
4 EMERGING MARKETS OUTLOOK:
THE IMPACT OF COLLAPSING
COMMODITIES
As of writing in early December, emerging market currencies are on in the midst of a painful plunge. According to
JPMorgan’s Emerging Market Currency Index, which measures the strength of a number of developing country’s
currencies against the US dollar, EM currencies are at their lowest level since at least 2000.
Of course, the recent broad-based strength in the dollar has driven all currencies lower on a relative basis, but the
dollar’s strength has also impacted EM FX indirectly, through its impact on commodities. As we go to press, the
S&P Goldman Sachs Commodity Index (GSCI, not shown) is down over 20% on the year, and certain widely followed
commodities including oil have fallen even more. This big drop in commodity prices will have a major impact on growth,
inflation, and monetary policy throughout the emerging market world.
What Could Falling Commodity Prices Mean for EM FX?
The most obvious impact of falling commodity prices is that the inflation should continue to fall heading into 2015.
Emerging markets are particularly leveraged to commodity prices through consumption of food and energy, and the
Figure 18:
Source: FOREX.com and Bloomberg
£ $
Our services include products that are traded on margin and carry a risk that you can lose more than your initial deposit.
© 2014 FOREX.com
26
corresponding drop in inflation could cause EM central banks to push back rate hikes or ease monetary policy in 2015.
This impact may be particularly strong in economies that are struggling with relatively high inflation rates already, such
as Turkey, South Africa and Russia.
Likewise, major EM commodity producers may see a hit to growth as the beneficial impact of lower import prices is
overwhelmed by the deleterious effect of lower export prices. As a result, fundamental traders should closely monitor
each country’s terms of trade, or the price ratio between a country’s exports and imports, to evaluate whether falling
commodity prices are benefiting or hurting each country.
Below, we discuss a number of emerging countries (and their currencies) individually, but readers would be wise to note
that emerging markets can be interrelated and the market’s attitude about one country can spread to other countries at
a moment’s notice, as we saw in early 2014.
USDMXN: Mexico Taking a Cue from its Northern Neighbor
More than any other EM economy, Mexico is closely linked to its neighbor to the north. The relative outperformance of
the US economy has spilled across the 30th parallel, and as a result, Mexico’s economy and currency are projected to
hold up relatively well in 2015. Referring back to our commodity theme, Mexico is actually a net exporter of oil, so the
recent collapse in crude prices does serve as a possible headwind for growth. That said, major structural reforms in
recent years, along with projected strong growth in the US in 2015, should allow Mexico’s Banxico to hike interest rates
later in 2015.
On a technical basis, USDMXN consolidated around 13.00 for most of last year before the peso finally gave in to the
dollar rally in December. Moving forward, a break of the five-year high at 14.60 may open the door for a continuation all
the way toward the 2009 high near 15.55, though we anticipate that the peso may hold up better than some of its EM
brethren against the greenback this year.
Figure 19:
Source: FOREX.com.
Our services include products that are traded on margin and carry a risk that you can lose more than your initial deposit.
© 2014 FOREX.com
27
USDRUB: Could Ruble’s Collapse Continue in 2015?
Of course, it’s impossible to discuss EM FX without checking in on 2014’s resident basket case, the Russian ruble. The
RUB was sold throughout the year on geopolitical risk from military incursions into Ukraine, the related economic
sanctions from Western countries, falling oil prices and generally poor economic performance in the Mother Country.
As we roll into 2015, the outlook for Russia’s economy remains weak, with the country struggling with a classic
stagflation dynamic, as GDP growth is hovering below 0.5% and inflation is rising at more than 9% per year. The
ongoing collapse in the ruble will only exacerbate price pressures in 2015, though the currency’s drop may provide
some support to GDP growth.
Speaking of the ruble, USDRUB has exploded all the way up to trade above 50 as of writing after the Central Bank of
Russia (CBR) was forced to allow it to float freely in Q4. The efficacy of technical analysis is limited in such a parabolic,
emotion-driven surge, but traders’ first impulse will be to buy dips in USDRUB in 2015 until the ruble can show signs of
stabilizing.
Figure 20:
Source: FOREX.com
Our services include products that are traded on margin and carry a risk that you can lose more than your initial deposit.
© 2014 FOREX.com
28
USDZAR: Economy Poised to Rebound, but ZAR Still Struggling
A prolonged mining strike derailed South Africa’s economy in 2014, but the country’s economy could see substantial
improvement this year. Moving forward, the expected normalization of activity in the mining and manufacturing sectors
should contribute positively to growth, especially in the first half of the year. Meanwhile, the drop in oil prices should
reduce the country’s elevated inflation rate, though this impact may be partially offset by the sustained decline in the
rand over the last few years. Given this economic backdrop, the South African Reserve Bank (SARB) is likely to remain
on hold for the first half of the year and we anticipate that the rand will track EM FX as a whole next year.
While the fundamental picture is cautiously optimistic for South Africa, the technical perspective is decidedly bearish.
The pair has just broken out from a multi-month cup-and-handle pattern, hinting that the rally may accelerate heading
into 2015. To the topside, the next level of resistance will be the Great Financial Crisis high at 11.84, followed round
handle resistance at 12.00. Only a break below the established uptrend would shift the near-term bias back to neutral
at this point.
Figure 21:
Source: FOREX.com
Our services include products that are traded on margin and carry a risk that you can lose more than your initial deposit.
© 2014 FOREX.com
29
USDTRY:
Objectively, Turkey’s economy is doing poorly heading into 2015. The country saw a negative 0.5% q/q Q3 2014 GDP
reading, bringing the country’s annualized GDP growth down to just 2.1%. Meanwhile, the country is struggling with
an unemployment rate above 10%, inflation at 9%, and a current account deficit equal to nearly 8% of GDP. That said,
markets are always forward looking, and like its EM rival South Africa, Turkey’s economy is poised for improvement in
2015. The biggest risk to Turkey’s economy in the coming year will be its dependence on external sources to finance its
current account deficit, but anticipated further easing in the Eurozone should help in that regard.
Turning our attention to the chart, the Turkish lira (TRY) held up relatively well against the dollar in 2014 beyond the
brief EM panic in January. USDTRY is currently pressing a short-term bearish trend line off the January high, and if that
barrier is eclipsed, a continuation toward the previous highs at 2.30 or 2.40 will be on the radar for 2015. Of course, a
pullback in the dollar would leave plenty of room for weakness in USDTRY, with support initially at 2.20, followed by all
the way down at 2014’s low near 2.0750.
Figure 22:
Source: FOREX.com
Our services include products that are traded on margin and carry a risk that you can lose more than your initial deposit.
© 2014 FOREX.com
30
5 VOLATILITY OUTLOOK 2015:
DID 2014 MARK A SECULAR LOW IN
VOLATILITY?
Volatility is always a sticky subject for traders. By definition, some volatility is required to make profitable trades, but too
much volatility can lead to erratic markets and unexpected losses. Lately though, traders have been having far more
issues with the former than the latter: according to JP Morgan’s G7 Volatility Index, last summer’s doldrums marked
an all-time low in currency market volatility, with the index dropping below its pre-Great Financial Crisis trough of six
before volatility picked up heading into the end of the year.
Figure 22:
Source: Bloomberg, FOREX.com
Our services include products that are traded on margin and carry a risk that you can lose more than your initial deposit.
© 2014 FOREX.com
31
Naturally, the question on every trader’s mind is, “Will volatility finally rise this year or will it fall back to 2014’s record
lows?” To answer this question, let’s analyze the primary catalyst that has pushed volatility consistently lower since
2009’s peak: easy monetary policy.
Above all, the decline in currency market volatility since 2009 has been driven by unprecedented liquidity injections
from global central banks. Beyond keeping interest rates at historically low levels, the Federal Reserve has enacted
three separate iterations of QE (not to mention its Operation Twist program), while the Bank of Japan and the Bank of
England have both maintained large asset purchase programs of their own over the past few years. While the Fed finally
wound down its QE program in October, the BOJ recently expanded asset purchases, and there is a high likelihood that
the ECB will also have to jump on the QE bandwagon in the first quarter of this year. As a result, some traders suggest
that other central banks will simply pick up the Fed’s slack and that the prolonged five-year decline in volatility will
stretch into 2015.
Color us skeptical. Though the spigots of global liquidity remain wide open, another factor driving volatility lower has
been the uniformity of monetary policy. That is, nearly every major central bank has been in easing mode for years
(barring last year’s short-lived tightening cycle from the RBNZ), leaving little reason for long-term traders to shift their
positions. Of course, many central banks will remain accommodative throughout 2015, but futures markets are still
pricing in interest rate hikes from the Federal Reserve, BOE, and RBNZ later in the year. With incoming economic data
likely to have a more direct and immediate impact on monetary policy this year, volatility is unlikely to revisit last year’s
snore-inducing lows, in our view.
Extending the above line of thought, volatility is likely to be highest in currencies with central banks that are on the
verge of making changes to monetary policy. As of writing in late November, pressure is growing on the European
Central Bank to start a sovereign QE program to stimulate its moribund economy, so volatility may be centered on
the euro early in the year. As the year develops, volatility should start to increase in the US dollar, New Zealand dollar,
and British pound (as their respective central banks grow more serious about raising interest rates), as well as the
Australian dollar, which could even see the RBA cut rates later in the year.
Of course, markets don’t always play out exactly as expected, but for now, the markets’ New Year Resolution may be to
offer more volatility to traders.
Our services include products that are traded on margin and carry a risk that you can lose more than your initial deposit.
© 2014 FOREX.com
32
6 UK: A DRAMATIC SHIFT IN THE UK’S
POLITICAL LANDSCAPE
At this early stage the outcome of the UK’s general election, which will take place on 7th May 2015, is uncertain. We are
too far away from the election to be able to derive much from the latest political polls; however, there have been some
interesting developments in the last year. YouGov, the market research firm, found that November was the first month
when more voters would vote for some other party than pick either the Conservatives or Labour party on their own.
Digging a bit deeper into the YouGopv poll, we found that Labour were just about in the lead with 33% of votes and 32%
of people said they would vote for the Conservatives, which would leave 35% who would vote for some other party. But
while the share of the Tory and Labour vote has been falling in recent years, it is the Liberal Democrats (currently in
a coalition with the Conservatives) who have seen the share of their vote dwindle to just 7%, the lowest level in this
parliament.
As the Lib Dems have faded in recent years, the three other remaining parties had some of their best results in their
history. For example, UKIP, the anti-EU UK Independence Party, received 16% of the votes, an all-time high. The
Scottish Nationalist Party reached 5% for the first time, and the Greens reached 6%. This is a sea change for British
politics, and if current trends play out then we could see a radically different Parliament after this election.
These polls suggest that the UK is likely to have another coalition government, so what outcome could we expect? At
this stage it is worth pointing out that many voters could change their mind come election day and “go home” to the
main parties, according to YouGov. However, we continue to believe that a coalition is likely and with the Lib Dems star
descending, we thought it was worth looking at some potential outcomes:
1, Conservative and UKIP
This would push the UK towards the right on issues like tax and immigration, but the biggest concern for the financial
markets would be Britain’s position in Europe. UKIP want the UK out of the EU, while British PM David Cameron has
promised an in/out referendum on the UK’s membership of the EU in 2017. This referendum could be brought forward
if UKIP are involved in a coalition.
2, Labour and the Greens
This pairing would trigger a shift to the left for the UK, with the Greens pushing for an environmentally friendly agenda
that could be deemed unfriendly to business. Labour has promised to end austerity, increase taxes and boost public
sector spending that could aggravate the UK’s deficit over the coming years, causing bond yields to rise.
Overall, the two examples above would be a shift for British politics from the center either the left or the right. If this
happens then it could trigger market panic as investors remain concerned about political uncertainty. This could
trigger a sharp fall in the pound, a rise in Gilt yields, and a decline for the FTSE 100, as markets tend to react badly to
uncertainty.
Our services include products that are traded on margin and carry a risk that you can lose more than your initial deposit.
© 2014 FOREX.com
33
Although the Labour party is traditionally considered bad for UK business and UK assets, we think that a Tory/ UKIP
coalition could also trigger market panic and economic weakness as it would leave the UK’s position in the EU on
shaky ground. At this stage the international community and some powerful figures in the business sector still see a
UK exit (or Brexit) from the EU as a bad economic move that could hurt the UK’s major industries including finance and
exports.
Thus, as we move into January there are plenty of uncertainties to digest, which could weigh on the pound and other
UK-based assets in the first half of the year.
¥
€
£
Our services include products that are traded on margin and carry a risk that you can lose more than your initial deposit.
© 2014 FOREX.com
34
2014 Q1
Cross Previous Ranges Predicted
Range
Bullish/
Bearish
Comments
The ECB’s Draghi pretty much laid
out QE in 2015 which may be very
bearish in the near term.
The ECB’s QE should be effective,
but maybe not as much as Japan’s
QQE and Abenomics.
Since the SNB set the 1.20 floor in
the EUR/CHF, price action has
become less compelling and will
likely continue to be so.
Both the ECB and BoE have
concerns over too little inflation
which may be a neutralizing factor
between these closely linked
currencies.
A brewing slowdown in China
along with the RBNZ taking a more
subdued stance could weigh
heavily on the NZD.
The furious rally in Q4 has shown
the power the BoJ wields with
QQE, and more may be in store for
the future.
Since the SNB peg on EUR/CHF,
the USD/CHF has essentially been
the antithesis of EUR/USD.
The UK’s connectedness with
Europe could hamper their
currency, particularly against the
recently dominant USD.
The Chinese slowdown has had a
negative impact, and combined
with declining commodity prices, a
recovery may be a long shot.
With the US increasing oil produc-
tivity and falling oil prices, the CAD
may lose some luster as the US’s
largest supplier becomes less
vital.
EUR/USD
EUR/JPY
EUR/CHF
EUR/GBP
NZD/USD
USD/JPY
USD/CHF
GBP/USD
AUD/USD
USD/CAD
Bearish
Bullish
Slightly
Bullish
Neutral
Bearish
Bullish
Bullish
Bearish
Bearish
Bullish
1.3476 – 1.3966
490 pips
136.22 – 145.11
889 pips
1.2103 – 1.2393
290 pips
0.8157 – 0.8399
242 pips
0.8050 – 0.8696
646 pips
101.68 – 105.43
375 pips
0.8698 – 0.9155
457 pips
1.6251 – 1.6822
571 pips
0.8659 – 0.9277
618 pips
1.0587 – 1.1277
690 pips
1.3502 – 1.3992
490 pips
137.69 – 143.46
577 pips
1.2139 – 1.2248
109 pips
0.7958 – 0.8312
354 pips
0.8401 – 0.8792
391 pips
100.81 – 104.12
331 pips
0.8702 – 0.9036
334 pips
1.6553 – 1.7114
561 pips
0.9201 – 0.9460
259 pips
1.0645 – 1.1069
424 pips
1.2627 – 1.3699
1072 pips
135.72 – 141.21
549 pips
1.2043 – 1.2176
133 pips
0.7765 – 0.8065
300 pips
0.7707 – 0.8834
1127 pips
101.06 – 109.84
878 pips
0.8855 – 0.9595
740 pips
1.6051 – 1.7190
1139 pips
0.8682 – 0.9504
822 pips
1.0619 – 1.1218
599 pips
1.18 – 1.26
800 pips
145.00 – 155.00
1000 pips
1.20 – 1.2150
150 pips
0.7750 – 0.8050
400 pips
0.7350 – 0.78
450 pips
117.00 – 126.00
900 pips
0.96 – 1.01
500 pips
1.53 – 1.58
500 pips
0.7950 – 0.8550
600 pips
1.13 – 1.17
400 pips
2014 Q2 2014 Q3
7 FX RATE EXPECTATIONS:
Our services include products that are traded on margin and carry a risk that you can lose more than your initial deposit.
© 2014 FOREX.com
35
subdued stance could weigh
heavily on the NZD.
The furious rally in Q4 has shown
the power the BoJ wields with
QQE, and more may be in store for
the future.
Since the SNB peg on EUR/CHF,
the USD/CHF has essentially been
the antithesis of EUR/USD.
The UK’s connectedness with
Europe could hamper their
currency, particularly against the
recently dominant USD.
The Chinese slowdown has had a
negative impact, and combined
with declining commodity prices, a
recovery may be a long shot.
With the US increasing oil produc-
tivity and falling oil prices, the CAD
may lose some luster as the US’s
largest supplier becomes less
vital.
As with most pairs related to JPY,
bullish momentum appears never
ending, especially considering
more possible action from the BoJ.
Both the RBNZ and RBA prefer
their currencies to fall, but falling
milk prices and commodities may
weigh heavier on the NZD.
The ascent of the USD along with
declining data in China indicates
that this pair may find strength in
Q1 and beyond.
USD/JPY
USD/CHF
GBP/USD
AUD/USD
USD/CAD
GBP/JPY
AUD/NZD
USD/CNH
Bullish
Bullish
Bearish
Bearish
Bullish
Slightly
Bullish
Bullish
Bullish
101.68 – 105.43
375 pips
0.8698 – 0.9155
457 pips
1.6251 – 1.6822
571 pips
0.8659 – 0.9277
618 pips
1.0587 – 1.1277
690 pips
163.86 – 174.82
1096 pips
1.0489 – 1.0944
455 pips
6.0148 – 6.2177
2029 pips
100.81 – 104.12
331 pips
0.8702 – 0.9036
334 pips
1.6553 – 1.7114
561 pips
0.9201 – 0.9460
259 pips
1.0645 – 1.1069
424 pips
169.48 – 174.08
460 pips
1.0642 – 1.1033
391 pips
6.1853 – 6.2710
857 pips
101.06 – 109.84
878 pips
0.8855 – 0.9595
740 pips
1.6051 – 1.7190
1139 pips
0.8682 – 0.9504
822 pips
1.0619 – 1.1218
599 pips
169.33 – 180.70
1137 pips
1.0621 – 1.1294
673 pips
6.1299 – 6.2184
885 pips
117.00 – 126.00
900 pips
0.96 – 1.01
500 pips
1.53 – 1.58
500 pips
0.7950 – 0.8550
600 pips
1.13 – 1.17
400 pips
185.00 – 200.00
1500 pips
1.0750 – 1.11
350 pips
6.15 – 6.24
900 pips
Cross Previous Ranges Predicted
Range
Bullish/
Bearish
Comments
Our services include products that are traded on margin and carry a risk that you can lose more than your initial deposit.
© 2014 FOREX.com
36
8 FOREX.COM’S 2015
MARKET-MOVING EVENTS
January 22 – European Central Bank Meeting and Press Conference
Back in July of last year, the ECB surprised traders by opting to change its meeting frequency to every six weeks, like
the Fed, instead of its previous schedule of every four weeks. This change, along with the decision to start publishing
the minutes from its meetings, will go into effect in January 2015 and will increase the importance of each ECB
meeting. As of writing, the central bank is debating a possible sovereign QE program to combat entrenched deflationary
pressures, so traders should keep a close eye on the central bank’s meetings for potentially big monetary policy
changes in 2015.
February 11 – Bank of England Quarterly Inflation Report
While the regular rank-and-file Bank of England meetings have hardly been exciting over the last few years, the central
bank’s Quarterly Inflation Reports have been far more informative for traders. The BOE typically uses this publication to
outline its longer-term views for the UK economy and monetary policy. With inflation at a low (and falling) level heading
into 2015, traders will eagerly devour these reports for hints about economic expectations and any potential changes to
monetary policy.
Our services include products that are traded on margin and carry a risk that you can lose more than your initial deposit.
© 2014 FOREX.com
37
March 5 – European Central Bank Meeting and Press Conference
Back in July of last year, the ECB surprised traders by opting to change its meeting frequency to every six weeks, like
the Fed, instead of its previous schedule of every four weeks. This change, along with the decision to start publishing
the minutes from its meetings, will go into effect in January 2015 and will increase the importance of each ECB
meeting. As of writing, the central bank is debating a possible sovereign QE program to combat entrenched deflationary
pressures, so traders should keep a close eye on the central bank’s meetings for potentially big monetary policy
changes in 2015.
March 18 – Federal Reserve Monetary Policy Meeting, Summary of
Economic Projections and Press Conference
Over the past couple of years, the Fed has reserved major monetary policy meetings for its quarterly meetings that also
feature the release of the central bank’s Summary of Economic Projections (including the so-called “dot chart”) and
press conferences so it can fully explain the decision. This year, these supercharged Fed meetings take place in March,
June, September, and December, so readers should be prepared for a possible spike in volatility around those releases
as traders look for more insight from the notoriously inscrutable central bank. As we go to press, futures markets
are pricing in an interest rate hike by the Federal Reserve midway through 2015, but that expectation will undoubtedly
fluctuate based on incoming economic data.
March 22 – Sweden General Election
As we go to press, the ruling Social Democrat-led government in Sweden has called for snap elections after
surprisingly losing a budget vote. By law, this poll cannot be made official until December 29th, but assuming it is
called as expected, the Swedish krone may face headwinds from political uncertainty in the first quarter of the year.
April 15 – European Central Bank Meeting and Press Conference
Back in July of last year, the ECB surprised traders by opting to change its meeting frequency to every six weeks, like
the Fed, instead of its previous schedule of every four weeks. This change, along with the decision to start publishing
the minutes from its meetings, will go into effect in January 2015 and will increase the importance of each ECB
meeting. As of writing, the central bank is debating a possible sovereign QE program to combat entrenched deflationary
pressures, so traders should keep a close eye on the central bank’s meetings for potentially big monetary policy
changes in 2015.
May 7 – United Kingdom General Election
For information on the general election, see section 6 - UK: A Dramatic Shift in the UK’s Political Landscape.
May 13 – Bank of England Quarterly Inflation Report
While the regular rank-and-file Bank of England meetings have hardly been exciting over the last few years, the central
bank’s Quarterly Inflation Reports have been far more informative for traders. The BOE typically uses this publication to
outline its longer-term views for the UK economy and monetary policy. With inflation at a low (and falling) level heading
Our services include products that are traded on margin and carry a risk that you can lose more than your initial deposit.
© 2014 FOREX.com
38
into 2015, traders will eagerly devour these reports for hints about economic expectations and any potential changes to
monetary policy.
June 3 – European Central Bank Meeting and Press Conference
Back in July of last year, the ECB surprised traders by opting to change its meeting frequency to every six weeks, like
the Fed, instead of its previous schedule of every four weeks. This change, along with the decision to start publishing
the minutes from its meetings, will go into effect in January 2015 and will increase the importance of each ECB
meeting. As of writing, the central bank is debating a possible sovereign QE program to combat entrenched deflationary
pressures, so traders should keep a close eye on the central bank’s meetings for potentially big monetary policy
changes in 2015.
June 17 – Federal Reserve Monetary Policy Meeting, Summary of
Economic Projections and Press Conference
Over the past couple of years, the Fed has reserved major monetary policy meetings for its quarterly meetings that also
feature the release of the central bank’s Summary of Economic Projections (including the so-called “dot chart”) and
press conferences so it can fully explain the decision. This year, these supercharged Fed meetings take place in March,
June, September, and December, so readers should be prepared for a possible spike in volatility around those releases
as traders look for more insight from the notoriously inscrutable central bank. As we go to press, futures markets
are pricing in an interest rate hike by the Federal Reserve midway through 2015, but that expectation will undoubtedly
fluctuate based on incoming economic data.
July 16 – European Central Bank Meeting and Press Conference
Back in July of last year, the ECB surprised traders by opting to change its meeting frequency to every six weeks, like
the Fed, instead of its previous schedule of every four weeks. This change, along with the decision to start publishing
the minutes from its meetings, will go into effect in January 2015 and will increase the importance of each ECB
meeting. As of writing, the central bank is debating a possible sovereign QE program to combat entrenched deflationary
pressures, so traders should keep a close eye on the central bank’s meetings for potentially big monetary policy
changes in 2015.
August 12 – Bank of England Quarterly Inflation Report
While the regular rank-and-file Bank of England meetings have hardly been exciting over the last few years, the central
bank’s Quarterly Inflation Reports have been far more informative for traders. The BOE typically uses this publication to
outline its longer-term views for the UK economy and monetary policy. With inflation at a low (and falling) level heading
into 2015, traders will eagerly devour these reports for hints about economic expectations and any potential changes to
monetary policy.
September 3 – European Central Bank Meeting and Press Conference
Back in July of last year, the ECB surprised traders by opting to change its meeting frequency to every six weeks, like
the Fed, instead of its previous schedule of every four weeks. This change, along with the decision to start publishing
the minutes from its meetings, will go into effect in January 2015 and will increase the importance of each ECB
Our services include products that are traded on margin and carry a risk that you can lose more than your initial deposit.
© 2014 FOREX.com
39
meeting. As of writing, the central bank is debating a possible sovereign QE program to combat entrenched deflationary
pressures, so traders should keep a close eye on the central bank’s meetings for potentially big monetary policy
changes in 2015.
September 17 – Federal Reserve Monetary Policy Meeting, Summary of
Economic Projections and Press Conference
Over the past couple of years, the Fed has reserved major monetary policy meetings for its quarterly meetings that also
feature the release of the central bank’s Summary of Economic Projections (including the so-called “dot chart”) and
press conferences so it can fully explain the decision. This year, these supercharged Fed meetings take place in March,
June, September, and December, so readers should be prepared for a possible spike in volatility around those releases
as traders look for more insight from the notoriously inscrutable central bank. As we go to press, futures markets
are pricing in an interest rate hike by the Federal Reserve midway through 2015, but that expectation will undoubtedly
fluctuate based on incoming economic data.
October 19 – Canadian Federal Election
October 22 – European Central Bank Meeting and Press Conference
Back in July of last year, the ECB surprised traders by opting to change its meeting frequency to every six weeks, like
the Fed, instead of its previous schedule of every four weeks. This change, along with the decision to start publishing
the minutes from its meetings, will go into effect in January 2015 and will increase the importance of each ECB
meeting. As of writing, the central bank is debating a possible sovereign QE program to combat entrenched deflationary
pressures, so traders should keep a close eye on the central bank’s meetings for potentially big monetary policy
changes in 2015.
November 11 – Bank of England Quarterly Inflation Report
While the regular rank-and-file Bank of England meetings have hardly been exciting over the last few years, the central
bank’s Quarterly Inflation Reports have been far more informative for traders. The BOE typically uses this publication to
outline its longer-term views for the UK economy and monetary policy. With inflation at a low (and falling) level heading
into 2015, traders will eagerly devour these reports for hints about economic expectations and any potential changes to
monetary policy.
December 3 – European Central Bank Meeting and Press Conference
Back in July of last year, the ECB surprised traders by opting to change its meeting frequency to every six weeks, like
the Fed, instead of its previous schedule of every four weeks. This change, along with the decision to start publishing
the minutes from its meetings, will go into effect in January 2015 and will increase the importance of each ECB
meeting. As of writing, the central bank is debating a possible sovereign QE program to combat entrenched deflationary
pressures, so traders should keep a close eye on the central bank’s meetings for potentially big monetary policy
changes in 2015.
Our services include products that are traded on margin and carry a risk that you can lose more than your initial deposit.
© 2014 FOREX.com
40
December 16 – Federal Reserve Monetary Policy Meeting, Summary of
Economic Projections and Press Conference
Over the past couple of years, the Fed has reserved major monetary policy meetings for its quarterly meetings that also
feature the release of the central bank’s Summary of Economic Projections (including the so-called “dot chart”) and
press conferences so it can fully explain the decision. This year, these supercharged Fed meetings take place in March,
June, September, and December, so readers should be prepared for a possible spike in volatility around those releases
as traders look for more insight from the notoriously inscrutable central bank. As we go to press, futures markets
are pricing in an interest rate hike by the Federal Reserve midway through 2015, but that expectation will undoubtedly
fluctuate based on incoming economic data.
No date set – Major IPOs
A number of major private companies are mulling over Initial Public Offerings (IPOs) in 2015, including the UK’s
Everything Everywhere mobile phone operator and Ferrari, the Italian luxury auto maker. Expect global equity markets
to exhibit elevated volatility and volume on these days.
Our services include products that are traded on margin and carry a risk that you can lose more than your initial deposit.
© 2014 FOREX.com
41
9 Stocks: Galvan’s ones to watch
for 2015
Our research and advisory arm, Galvan, have kindly contributed to this year’s 2015 Outlook. Here their head of research,
Andrew Gibson, gives us his three ones to watch for 2015.
1, Lancashire Holdings (LRE): The secret dividend stock in
the UK market
It’s hard to get a decent income from investing right now. In the UK, saving accounts offer barely 1% interest and rising
property and share prices have driven down yields.
However, with a bit of digging you can still find some high-yield opportunities. One that’s caught our eye is Lancashire
Holdings (Lancashire).
Lancashire is one of the most successful specialist insurers on the London Stock Exchange. It provides insurance in
areas such as property, aviation, marine, energy and terrorism.
Insurance is a cyclical industry, meaning it goes through periods of rising rates and falling rates. Lancashire
approaches these cycles in a disciplined way.
Effectively, when rates are high, the company writes more business and when rates are low (like now), they write less.
Unlike other insurers, Lancashire’s priority is profits, not growth.
This can be clearly seen in its combined ratio, which measures the cost of claims relative to the premiums collected
(the lower the better). Lancashire’s combined ratio over the last five years has averaged 59.2%, miles better than the
90.4% average of its peer group.
Because Lancashire’s underwriting is so much more profitable, it can take a very conservative approach to
investing. The majority of its premiums are invested in cash and low-risk bonds.
Another important factor in Lancashire’s business model is that it has a strongly diversified portfolio with no reliance
on a single source of revenue or profit. Reinsurance is also used as a way of keeping exposure limited to any particular
geography or insurance class.
These differentiating factors have enabled Lancashire to offer a very generous dividend policy. Each year it pays out
most of its profits through dividends, via a steady regular dividend and a variable special dividend.
The regular dividend has remained at 15¢ (around 10p) for the last five years, which is okay but nothing to get excited
about. However, the special dividends have been huge: 110¢ in 2008, 125¢ in 2009, 140¢ in 2010, 80¢ in 2011, 195¢ in
2012 and 65¢ in 2013 and 120¢ in 2014.
To put that into context, a total dividend payout of 135¢ (around 86p) in 2014 puts the shares on an astonishing yield of
13.8%. This is not a freak year either. The average dividend yield on the shares over the last five years has been more
than 10%.
Our services include products that are traded on margin and carry a risk that you can lose more than your initial deposit.
© 2014 FOREX.com
42
Sure, the special dividend varies year-on-year, but it allows Lancashire to maximise the pay-out by taking into account
its current needs.
Interestingly, when you run a search across the FTSE for high-dividend yields, you won’t see Lancashire come up.
That’s because screening software ignores special dividends. So Lancashire’s massive dividend payouts remain a
bit of a secret.
Overall, Lancashire is a high-quality insurer that has a good track record of paying its shareholders big dividends. As an
income stock, it’s hard to argue with.
2, InternetQ (INTQ): The company that can infiltrate 300 million
smartphone apps
The smartphone explosion has taken the world by storm. This year the total number of users will reach 1.75 billion.
That’s one in four people on the planet.
For many people smartphones offer the most convenient way to access the internet. This year mobile internet traffic
has overtaken PCs for the first time in history.
There’s no doubt this is an incredibly lucrative market. However, manufacturing smartphones is becoming increasingly
competitive, driving down costs and reducing margins. As the market evolves, investors are now looking for
opportunities in the smartphone software sector, which is expanding faster than ever.
InternetQ is a clever little company that’s set to profit from this boom. It has two main businesses: mobile marketing
and music streaming.
If you’ve ever used a smartphone app chances are you will have seen an advertisement run by MiniMob. This is a clever
piece of software from InternetQ that allows developers to get paid for the apps they create. It’s already been installed
over 300 million times and this figure is increasing at a rate of one to two million every day!
The mobile ad market is currently worth around £12bn per year and is growing quickly. Analysts at Gartner expect
it to reach £27bn by 2017.
Once MiniMob has been installed on a user’s device it gains access to all kinds of data, such as what type of apps they
like, when they use them etc. This information is very useful because it means ads can be targeted, increasing the
number of hits and revenue.
InternetQ also runs Akazoo, a mobile music-streaming business with staggering potential.
This offers a service which allows subscribers paying a regular fee to access a huge collection of music. Akazoo
currently boasts over 20 million tracks with over one million subscribers worldwide.
Music streaming is rapidly becoming big business, which makes Akazoo a very exciting prospect. Apple recently paid a
whopping $3bn for a similar business called Beats. Considering Beats only has around 250,000 subscribers this deal
certainly bodes well for the value of Akazoo.
There have already been some high profile partnerships with leading smartphone manufactures, including Sony and
Samsung, who have agreed to pre-install Akazoo on the devices they sell.
InternetQ is profitable and expanding quickly, with double-digit growth in both revenue and profit for the last three
years.
Our services include products that are traded on margin and carry a risk that you can lose more than your initial deposit.
© 2014 FOREX.com
43
It looks like 2014 is on track to be another record year too. With better-than-expected results for the first nine months,
InternetQ’s strongest quarter may be yet to come. New features for both MiniMob and Akazoo are scheduled for release
soon and should also benefit Q4.
In short, InternetQ is well-placed to gain from two of the fastest growing areas in mobile software.
3, Strat Aero Plc (AERO): Benefitting from the drone boom
Unmanned aerial vehicles, or drones, are becoming big business. Mass adoption of this new technology is gathering
pace as they make the transition from military use into everyday life.
You may remember that Amazon made headlines all over the world when it proposed the idea that drones could deliver
small packages within half an hour of a customer order. And here in the UK, Domino’s Pizza uploaded a video to
YouTube of a “DomiCopter” drone flying over the countryside to deliver two pizzas.
While these stories generated plenty of publicity, neither of those things is likely to happen any time soon. But what is
likely is that the use of drones will rise considerably.
The Federal Aviation Administration in the US has predicted that the potential market for government and commercial
drones could generate “nearly $90 billion in economic activity” over the next decade.
There are so many ways in which drones could be used. Examples include patrolling borders, tracking forest fires and
flooded areas, monitoring volcanoes and extreme weather patterns, carrying out search-and-rescue missions and the
surveillance of criminal activity and civil unrest.
There are also enormous opportunities in more mundane commercial applications such as allowing farmers to monitor
their land more easily and apply pesticides and fertilizers more accurately. Drones could also help the oil and gas
industry, whose vast assets such as rigs, refineries and pipelines, are often in remote locations but need to be closely
monitored.
One of the major things holding back the global growth of drones is safety. The situation has been compared to the
early stages of the car industry. The car was obviously a major technological breakthrough, but before they could
become mainstream, people needed to learn how to drive. The same applies to drones. They’re only as safe as their
pilots.
That’s where Strat Aero comes in. Established in 2013, Strat Aero offers training and consultancy in the use and
operation of drones. While its head office is based at Gatwick Airport, the company’s flagship training complex is in
Roswell, New Mexico. The company also has plans to bring a training centre to Europe.
Strat Aero offers both training software as well as hands-on technical training and already has a contract with one of
America’s top defence firms. The company believes that one branch of the US military alone will require 750 pilots to be
trained each year. Directors expect revenue of $12,750 per pilot. So there could be big money in education.
The US Congress has imposed a September 2015 deadline to put in place a framework for use of drones within
their National Airspace System. Once the rules and regulations are in place, the market for drones could take off
exponentially.
Strat Aero looks to be a company in the right place at the right time. It’s technical and operational expertise combined
with its first mover advantage gives it a significant edge in an industry that looks set to soar.
Forex market-outlook-2015

More Related Content

What's hot

Greece negotiations and tier one US data key for traders this week
Greece negotiations and tier one US data key for traders this weekGreece negotiations and tier one US data key for traders this week
Greece negotiations and tier one US data key for traders this week
Hantec Markets
 
Trump's tariffs driving a significant impact through markets
Trump's tariffs driving a significant impact through marketsTrump's tariffs driving a significant impact through markets
Trump's tariffs driving a significant impact through markets
Hantec Markets
 
The legacy of the dovish fed is set to continue this week
The legacy of the dovish fed is set to continue this weekThe legacy of the dovish fed is set to continue this week
The legacy of the dovish fed is set to continue this week
Hantec Markets
 
Weekly outlook nov 2 2015
Weekly outlook  nov 2   2015Weekly outlook  nov 2   2015
Weekly outlook nov 2 2015
Hantec Markets
 
Trump/Kim, the FOMC and ECB all crucial this week
Trump/Kim, the FOMC and ECB all crucial this weekTrump/Kim, the FOMC and ECB all crucial this week
Trump/Kim, the FOMC and ECB all crucial this week
Hantec Markets
 
Will US stronger US relative economic performance continue?
Will US stronger US relative economic performance continue? Will US stronger US relative economic performance continue?
Will US stronger US relative economic performance continue?
Hantec Markets
 
US economic data is key for the dollar rally this week
US economic data is key for the dollar rally this weekUS economic data is key for the dollar rally this week
US economic data is key for the dollar rally this week
Richard Perry
 
Scizophrenic market
Scizophrenic marketScizophrenic market
Scizophrenic market
Don Hogan
 
Bond markets remain in focus after recent curve inversion
Bond markets remain in focus after recent curve inversionBond markets remain in focus after recent curve inversion
Bond markets remain in focus after recent curve inversion
Hantec Markets
 
Weekly Outlook April 13 2015
Weekly Outlook April 13 2015Weekly Outlook April 13 2015
Weekly Outlook April 13 2015
Hantec Markets
 
China and expectations over a Fed rate hike continue to dominate trading sent...
China and expectations over a Fed rate hike continue to dominate trading sent...China and expectations over a Fed rate hike continue to dominate trading sent...
China and expectations over a Fed rate hike continue to dominate trading sent...
Hantec Markets
 
Reaction to Fed balance sheet reduction is key
Reaction to Fed balance sheet reduction is keyReaction to Fed balance sheet reduction is key
Reaction to Fed balance sheet reduction is key
Richard Perry
 
With a dearth of US data the ECB will be key this week
With a dearth of US data the ECB will be key this weekWith a dearth of US data the ECB will be key this week
With a dearth of US data the ECB will be key this week
Richard Perry
 
FOMC meeting crucial for forex and commodities
FOMC meeting crucial for forex and commoditiesFOMC meeting crucial for forex and commodities
FOMC meeting crucial for forex and commodities
Hantec Markets
 
US dollar strengthening once more as focus remains on the data this week
US dollar strengthening once more as focus remains on the data this weekUS dollar strengthening once more as focus remains on the data this week
US dollar strengthening once more as focus remains on the data this week
Hantec Markets
 
US and China trade negotiations key this week
US and China trade negotiations key this weekUS and China trade negotiations key this week
US and China trade negotiations key this week
Hantec Markets
 
Jpc weekly market view 2 december 2015
Jpc weekly market view 2 december 2015Jpc weekly market view 2 december 2015
Jpc weekly market view 2 december 2015
Jon Taubert
 
US inflation in focus with bond markets increasingly key
US inflation in focus with bond markets increasingly keyUS inflation in focus with bond markets increasingly key
US inflation in focus with bond markets increasingly key
Hantec Markets
 
Are markets setting up for a dollar rally this week?
Are markets setting up for a dollar rally this week?Are markets setting up for a dollar rally this week?
Are markets setting up for a dollar rally this week?
Richard Perry
 

What's hot (20)

Greece negotiations and tier one US data key for traders this week
Greece negotiations and tier one US data key for traders this weekGreece negotiations and tier one US data key for traders this week
Greece negotiations and tier one US data key for traders this week
 
Trump's tariffs driving a significant impact through markets
Trump's tariffs driving a significant impact through marketsTrump's tariffs driving a significant impact through markets
Trump's tariffs driving a significant impact through markets
 
The legacy of the dovish fed is set to continue this week
The legacy of the dovish fed is set to continue this weekThe legacy of the dovish fed is set to continue this week
The legacy of the dovish fed is set to continue this week
 
Weekly outlook nov 2 2015
Weekly outlook  nov 2   2015Weekly outlook  nov 2   2015
Weekly outlook nov 2 2015
 
Trump/Kim, the FOMC and ECB all crucial this week
Trump/Kim, the FOMC and ECB all crucial this weekTrump/Kim, the FOMC and ECB all crucial this week
Trump/Kim, the FOMC and ECB all crucial this week
 
Will US stronger US relative economic performance continue?
Will US stronger US relative economic performance continue? Will US stronger US relative economic performance continue?
Will US stronger US relative economic performance continue?
 
US economic data is key for the dollar rally this week
US economic data is key for the dollar rally this weekUS economic data is key for the dollar rally this week
US economic data is key for the dollar rally this week
 
Scizophrenic market
Scizophrenic marketScizophrenic market
Scizophrenic market
 
Bond markets remain in focus after recent curve inversion
Bond markets remain in focus after recent curve inversionBond markets remain in focus after recent curve inversion
Bond markets remain in focus after recent curve inversion
 
Weekly Outlook April 13 2015
Weekly Outlook April 13 2015Weekly Outlook April 13 2015
Weekly Outlook April 13 2015
 
China and expectations over a Fed rate hike continue to dominate trading sent...
China and expectations over a Fed rate hike continue to dominate trading sent...China and expectations over a Fed rate hike continue to dominate trading sent...
China and expectations over a Fed rate hike continue to dominate trading sent...
 
Reaction to Fed balance sheet reduction is key
Reaction to Fed balance sheet reduction is keyReaction to Fed balance sheet reduction is key
Reaction to Fed balance sheet reduction is key
 
With a dearth of US data the ECB will be key this week
With a dearth of US data the ECB will be key this weekWith a dearth of US data the ECB will be key this week
With a dearth of US data the ECB will be key this week
 
FOMC meeting crucial for forex and commodities
FOMC meeting crucial for forex and commoditiesFOMC meeting crucial for forex and commodities
FOMC meeting crucial for forex and commodities
 
US dollar strengthening once more as focus remains on the data this week
US dollar strengthening once more as focus remains on the data this weekUS dollar strengthening once more as focus remains on the data this week
US dollar strengthening once more as focus remains on the data this week
 
US and China trade negotiations key this week
US and China trade negotiations key this weekUS and China trade negotiations key this week
US and China trade negotiations key this week
 
Jpc weekly market view 2 december 2015
Jpc weekly market view 2 december 2015Jpc weekly market view 2 december 2015
Jpc weekly market view 2 december 2015
 
US inflation in focus with bond markets increasingly key
US inflation in focus with bond markets increasingly keyUS inflation in focus with bond markets increasingly key
US inflation in focus with bond markets increasingly key
 
Economic outlook
Economic outlookEconomic outlook
Economic outlook
 
Are markets setting up for a dollar rally this week?
Are markets setting up for a dollar rally this week?Are markets setting up for a dollar rally this week?
Are markets setting up for a dollar rally this week?
 

Similar to Forex market-outlook-2015

2015 Investment Strategy Report
2015 Investment Strategy Report2015 Investment Strategy Report
2015 Investment Strategy ReportStephen Walker
 
Hopes and Fears for 2014 – February 2014
Hopes and Fears for 2014 – February 2014Hopes and Fears for 2014 – February 2014
Hopes and Fears for 2014 – February 2014JonGrant01
 
Olivier Desbarres - Its oh so quiet...for now
Olivier Desbarres - Its oh so quiet...for nowOlivier Desbarres - Its oh so quiet...for now
Olivier Desbarres - Its oh so quiet...for now
Olivier Desbarres
 
Economic outlook
Economic outlookEconomic outlook
Economic outlook
Ignacio Jimenez
 
Fear in the Market
Fear in the MarketFear in the Market
Fear in the Market
Marqus J Freeman
 
Caton's corner august economic update
Caton's corner august economic updateCaton's corner august economic update
Caton's corner august economic update
Josh Develop
 
7 wells fargo 2015 mid-year outlook - turning points
7 wells fargo 2015 mid-year outlook - turning points7 wells fargo 2015 mid-year outlook - turning points
7 wells fargo 2015 mid-year outlook - turning points
123jumpad
 
07.2015 TCH - Rumor of bonds’ demise greatly exaggerated... again
07.2015 TCH - Rumor of bonds’ demise greatly exaggerated... again07.2015 TCH - Rumor of bonds’ demise greatly exaggerated... again
07.2015 TCH - Rumor of bonds’ demise greatly exaggerated... againAdam Phillips
 
MTBiz January 2015
MTBiz January 2015MTBiz January 2015
MTBiz January 2015
Mutual Trust Bank Ltd.
 
Quarterly Investment Outlook - May 2015
Quarterly Investment Outlook - May 2015Quarterly Investment Outlook - May 2015
Quarterly Investment Outlook - May 2015
JonGrant01
 
Bond letter (2014.12.01 en ww)
Bond letter (2014.12.01 en ww)Bond letter (2014.12.01 en ww)
Bond letter (2014.12.01 en ww)Xavier Strauss
 
File 707525
File 707525File 707525
File 707525
jeffbrownct
 
LPL Financial Research Presents: OUTLOOK 2015
LPL Financial Research Presents: OUTLOOK 2015LPL Financial Research Presents: OUTLOOK 2015
LPL Financial Research Presents: OUTLOOK 2015
JP Marketing | NE
 
BlackRock: 2014 Outlook The List - What to Know, What to Do
BlackRock: 2014 Outlook The List - What to Know, What to DoBlackRock: 2014 Outlook The List - What to Know, What to Do
BlackRock: 2014 Outlook The List - What to Know, What to Do
Econ Matters
 
Int financial report by prof.h.b kolhoff. (1)
Int financial report by prof.h.b kolhoff. (1)Int financial report by prof.h.b kolhoff. (1)
Int financial report by prof.h.b kolhoff. (1)GOLDENFALCON6666
 
Current Thinking, Q1 2014
Current Thinking, Q1 2014Current Thinking, Q1 2014
Current Thinking, Q1 2014
Kevin Lenox
 
2012 Outlook
2012 Outlook2012 Outlook
2012 Outlook
Marshall Gittler
 
Swedbank's Global Economic Outlook, 2010 August
	Swedbank's Global Economic Outlook, 2010 August	Swedbank's Global Economic Outlook, 2010 August
Swedbank's Global Economic Outlook, 2010 August
Swedbank
 
Fasanara Capital | Investment Outlook | December 1st 2014
Fasanara Capital | Investment Outlook | December 1st 2014Fasanara Capital | Investment Outlook | December 1st 2014
Fasanara Capital | Investment Outlook | December 1st 2014Fasanara Capital ltd
 
Blackrock 2015 outlook rpt
Blackrock 2015 outlook rptBlackrock 2015 outlook rpt
Blackrock 2015 outlook rptLance Conn
 

Similar to Forex market-outlook-2015 (20)

2015 Investment Strategy Report
2015 Investment Strategy Report2015 Investment Strategy Report
2015 Investment Strategy Report
 
Hopes and Fears for 2014 – February 2014
Hopes and Fears for 2014 – February 2014Hopes and Fears for 2014 – February 2014
Hopes and Fears for 2014 – February 2014
 
Olivier Desbarres - Its oh so quiet...for now
Olivier Desbarres - Its oh so quiet...for nowOlivier Desbarres - Its oh so quiet...for now
Olivier Desbarres - Its oh so quiet...for now
 
Economic outlook
Economic outlookEconomic outlook
Economic outlook
 
Fear in the Market
Fear in the MarketFear in the Market
Fear in the Market
 
Caton's corner august economic update
Caton's corner august economic updateCaton's corner august economic update
Caton's corner august economic update
 
7 wells fargo 2015 mid-year outlook - turning points
7 wells fargo 2015 mid-year outlook - turning points7 wells fargo 2015 mid-year outlook - turning points
7 wells fargo 2015 mid-year outlook - turning points
 
07.2015 TCH - Rumor of bonds’ demise greatly exaggerated... again
07.2015 TCH - Rumor of bonds’ demise greatly exaggerated... again07.2015 TCH - Rumor of bonds’ demise greatly exaggerated... again
07.2015 TCH - Rumor of bonds’ demise greatly exaggerated... again
 
MTBiz January 2015
MTBiz January 2015MTBiz January 2015
MTBiz January 2015
 
Quarterly Investment Outlook - May 2015
Quarterly Investment Outlook - May 2015Quarterly Investment Outlook - May 2015
Quarterly Investment Outlook - May 2015
 
Bond letter (2014.12.01 en ww)
Bond letter (2014.12.01 en ww)Bond letter (2014.12.01 en ww)
Bond letter (2014.12.01 en ww)
 
File 707525
File 707525File 707525
File 707525
 
LPL Financial Research Presents: OUTLOOK 2015
LPL Financial Research Presents: OUTLOOK 2015LPL Financial Research Presents: OUTLOOK 2015
LPL Financial Research Presents: OUTLOOK 2015
 
BlackRock: 2014 Outlook The List - What to Know, What to Do
BlackRock: 2014 Outlook The List - What to Know, What to DoBlackRock: 2014 Outlook The List - What to Know, What to Do
BlackRock: 2014 Outlook The List - What to Know, What to Do
 
Int financial report by prof.h.b kolhoff. (1)
Int financial report by prof.h.b kolhoff. (1)Int financial report by prof.h.b kolhoff. (1)
Int financial report by prof.h.b kolhoff. (1)
 
Current Thinking, Q1 2014
Current Thinking, Q1 2014Current Thinking, Q1 2014
Current Thinking, Q1 2014
 
2012 Outlook
2012 Outlook2012 Outlook
2012 Outlook
 
Swedbank's Global Economic Outlook, 2010 August
	Swedbank's Global Economic Outlook, 2010 August	Swedbank's Global Economic Outlook, 2010 August
Swedbank's Global Economic Outlook, 2010 August
 
Fasanara Capital | Investment Outlook | December 1st 2014
Fasanara Capital | Investment Outlook | December 1st 2014Fasanara Capital | Investment Outlook | December 1st 2014
Fasanara Capital | Investment Outlook | December 1st 2014
 
Blackrock 2015 outlook rpt
Blackrock 2015 outlook rptBlackrock 2015 outlook rpt
Blackrock 2015 outlook rpt
 

More from FTSA Academy

Institute small-business-payroll-report
Institute small-business-payroll-reportInstitute small-business-payroll-report
Institute small-business-payroll-report
FTSA Academy
 
Statement of investor_rights_english
Statement of investor_rights_englishStatement of investor_rights_english
Statement of investor_rights_english
FTSA Academy
 
حقوق المستثمرين
حقوق المستثمرينحقوق المستثمرين
حقوق المستثمرين
FTSA Academy
 
cfa_charter_factsheet
cfa_charter_factsheetcfa_charter_factsheet
cfa_charter_factsheetFTSA Academy
 
Full Contract عقد التداول نسخة كاملة
Full Contract عقد التداول نسخة كاملةFull Contract عقد التداول نسخة كاملة
Full Contract عقد التداول نسخة كاملة
FTSA Academy
 
Strategic planing Pfiffer method
Strategic planing Pfiffer methodStrategic planing Pfiffer method
Strategic planing Pfiffer methodFTSA Academy
 
Bbva open mind-book-reinventing-the-company-in-the-digital-age-business-innov...
Bbva open mind-book-reinventing-the-company-in-the-digital-age-business-innov...Bbva open mind-book-reinventing-the-company-in-the-digital-age-business-innov...
Bbva open mind-book-reinventing-the-company-in-the-digital-age-business-innov...
FTSA Academy
 
Bbva open mind-book-change-19-key-essays-on-how-internet-is-changing-our-live...
Bbva open mind-book-change-19-key-essays-on-how-internet-is-changing-our-live...Bbva open mind-book-change-19-key-essays-on-how-internet-is-changing-our-live...
Bbva open mind-book-change-19-key-essays-on-how-internet-is-changing-our-live...
FTSA Academy
 
Wef global competitivenessreport_2014-15
Wef global competitivenessreport_2014-15Wef global competitivenessreport_2014-15
Wef global competitivenessreport_2014-15
FTSA Academy
 
Wef ygl circular_economyinnovation_positionpaper_2013
Wef ygl circular_economyinnovation_positionpaper_2013Wef ygl circular_economyinnovation_positionpaper_2013
Wef ygl circular_economyinnovation_positionpaper_2013FTSA Academy
 
Mlkslideshare 140120113126-phpapp02
Mlkslideshare 140120113126-phpapp02Mlkslideshare 140120113126-phpapp02
Mlkslideshare 140120113126-phpapp02FTSA Academy
 
Wef nr gcr_2013-2014_ar
Wef nr gcr_2013-2014_arWef nr gcr_2013-2014_ar
Wef nr gcr_2013-2014_arFTSA Academy
 
Wef global competitivenessreport_2013-14
Wef global competitivenessreport_2013-14Wef global competitivenessreport_2013-14
Wef global competitivenessreport_2013-14FTSA Academy
 
WEF World economic forum report _2011-12
WEF World economic forum report _2011-12WEF World economic forum report _2011-12
WEF World economic forum report _2011-12
FTSA Academy
 
التخطيط الإستراتيجي بنموذج فايفر
التخطيط الإستراتيجي بنموذج فايفرالتخطيط الإستراتيجي بنموذج فايفر
التخطيط الإستراتيجي بنموذج فايفرFTSA Academy
 

More from FTSA Academy (17)

Institute small-business-payroll-report
Institute small-business-payroll-reportInstitute small-business-payroll-report
Institute small-business-payroll-report
 
mean_variance
mean_variancemean_variance
mean_variance
 
GTG Introduction
GTG Introduction GTG Introduction
GTG Introduction
 
Statement of investor_rights_english
Statement of investor_rights_englishStatement of investor_rights_english
Statement of investor_rights_english
 
حقوق المستثمرين
حقوق المستثمرينحقوق المستثمرين
حقوق المستثمرين
 
cfa_charter_factsheet
cfa_charter_factsheetcfa_charter_factsheet
cfa_charter_factsheet
 
Full Contract عقد التداول نسخة كاملة
Full Contract عقد التداول نسخة كاملةFull Contract عقد التداول نسخة كاملة
Full Contract عقد التداول نسخة كاملة
 
Strategic planing Pfiffer method
Strategic planing Pfiffer methodStrategic planing Pfiffer method
Strategic planing Pfiffer method
 
Bbva open mind-book-reinventing-the-company-in-the-digital-age-business-innov...
Bbva open mind-book-reinventing-the-company-in-the-digital-age-business-innov...Bbva open mind-book-reinventing-the-company-in-the-digital-age-business-innov...
Bbva open mind-book-reinventing-the-company-in-the-digital-age-business-innov...
 
Bbva open mind-book-change-19-key-essays-on-how-internet-is-changing-our-live...
Bbva open mind-book-change-19-key-essays-on-how-internet-is-changing-our-live...Bbva open mind-book-change-19-key-essays-on-how-internet-is-changing-our-live...
Bbva open mind-book-change-19-key-essays-on-how-internet-is-changing-our-live...
 
Wef global competitivenessreport_2014-15
Wef global competitivenessreport_2014-15Wef global competitivenessreport_2014-15
Wef global competitivenessreport_2014-15
 
Wef ygl circular_economyinnovation_positionpaper_2013
Wef ygl circular_economyinnovation_positionpaper_2013Wef ygl circular_economyinnovation_positionpaper_2013
Wef ygl circular_economyinnovation_positionpaper_2013
 
Mlkslideshare 140120113126-phpapp02
Mlkslideshare 140120113126-phpapp02Mlkslideshare 140120113126-phpapp02
Mlkslideshare 140120113126-phpapp02
 
Wef nr gcr_2013-2014_ar
Wef nr gcr_2013-2014_arWef nr gcr_2013-2014_ar
Wef nr gcr_2013-2014_ar
 
Wef global competitivenessreport_2013-14
Wef global competitivenessreport_2013-14Wef global competitivenessreport_2013-14
Wef global competitivenessreport_2013-14
 
WEF World economic forum report _2011-12
WEF World economic forum report _2011-12WEF World economic forum report _2011-12
WEF World economic forum report _2011-12
 
التخطيط الإستراتيجي بنموذج فايفر
التخطيط الإستراتيجي بنموذج فايفرالتخطيط الإستراتيجي بنموذج فايفر
التخطيط الإستراتيجي بنموذج فايفر
 

Recently uploaded

APP I Lecture Notes to students 0f 4the year
APP I  Lecture Notes  to students 0f 4the yearAPP I  Lecture Notes  to students 0f 4the year
APP I Lecture Notes to students 0f 4the year
telilaalilemlem
 
how to sell pi coins on Bitmart crypto exchange
how to sell pi coins on Bitmart crypto exchangehow to sell pi coins on Bitmart crypto exchange
how to sell pi coins on Bitmart crypto exchange
DOT TECH
 
managementaccountingunitiv-230422140105-dd17d80b.ppt
managementaccountingunitiv-230422140105-dd17d80b.pptmanagementaccountingunitiv-230422140105-dd17d80b.ppt
managementaccountingunitiv-230422140105-dd17d80b.ppt
SuseelaPalanimuthu
 
The European Unemployment Puzzle: implications from population aging
The European Unemployment Puzzle: implications from population agingThe European Unemployment Puzzle: implications from population aging
The European Unemployment Puzzle: implications from population aging
GRAPE
 
how to sell pi coins on Binance exchange
how to sell pi coins on Binance exchangehow to sell pi coins on Binance exchange
how to sell pi coins on Binance exchange
DOT TECH
 
Empowering the Unbanked: The Vital Role of NBFCs in Promoting Financial Inclu...
Empowering the Unbanked: The Vital Role of NBFCs in Promoting Financial Inclu...Empowering the Unbanked: The Vital Role of NBFCs in Promoting Financial Inclu...
Empowering the Unbanked: The Vital Role of NBFCs in Promoting Financial Inclu...
Vighnesh Shashtri
 
what is the future of Pi Network currency.
what is the future of Pi Network currency.what is the future of Pi Network currency.
what is the future of Pi Network currency.
DOT TECH
 
The secret way to sell pi coins effortlessly.
The secret way to sell pi coins effortlessly.The secret way to sell pi coins effortlessly.
The secret way to sell pi coins effortlessly.
DOT TECH
 
BYD SWOT Analysis and In-Depth Insights 2024.pptx
BYD SWOT Analysis and In-Depth Insights 2024.pptxBYD SWOT Analysis and In-Depth Insights 2024.pptx
BYD SWOT Analysis and In-Depth Insights 2024.pptx
mikemetalprod
 
The Evolution of Non-Banking Financial Companies (NBFCs) in India: Challenges...
The Evolution of Non-Banking Financial Companies (NBFCs) in India: Challenges...The Evolution of Non-Banking Financial Companies (NBFCs) in India: Challenges...
The Evolution of Non-Banking Financial Companies (NBFCs) in India: Challenges...
beulahfernandes8
 
Isios-2024-Professional-Independent-Trustee-Survey.pdf
Isios-2024-Professional-Independent-Trustee-Survey.pdfIsios-2024-Professional-Independent-Trustee-Survey.pdf
Isios-2024-Professional-Independent-Trustee-Survey.pdf
Henry Tapper
 
what is the best method to sell pi coins in 2024
what is the best method to sell pi coins in 2024what is the best method to sell pi coins in 2024
what is the best method to sell pi coins in 2024
DOT TECH
 
How to get verified on Coinbase Account?_.docx
How to get verified on Coinbase Account?_.docxHow to get verified on Coinbase Account?_.docx
How to get verified on Coinbase Account?_.docx
Buy bitget
 
Commercial Bank Economic Capsule - May 2024
Commercial Bank Economic Capsule - May 2024Commercial Bank Economic Capsule - May 2024
Commercial Bank Economic Capsule - May 2024
Commercial Bank of Ceylon PLC
 
Scope Of Macroeconomics introduction and basic theories
Scope Of Macroeconomics introduction and basic theoriesScope Of Macroeconomics introduction and basic theories
Scope Of Macroeconomics introduction and basic theories
nomankalyar153
 
The new type of smart, sustainable entrepreneurship and the next day | Europe...
The new type of smart, sustainable entrepreneurship and the next day | Europe...The new type of smart, sustainable entrepreneurship and the next day | Europe...
The new type of smart, sustainable entrepreneurship and the next day | Europe...
Antonis Zairis
 
PF-Wagner's Theory of Public Expenditure.pptx
PF-Wagner's Theory of Public Expenditure.pptxPF-Wagner's Theory of Public Expenditure.pptx
PF-Wagner's Theory of Public Expenditure.pptx
GunjanSharma28848
 
US Economic Outlook - Being Decided - M Capital Group August 2021.pdf
US Economic Outlook - Being Decided - M Capital Group August 2021.pdfUS Economic Outlook - Being Decided - M Capital Group August 2021.pdf
US Economic Outlook - Being Decided - M Capital Group August 2021.pdf
pchutichetpong
 
Exploring Abhay Bhutada’s Views After Poonawalla Fincorp’s Collaboration With...
Exploring Abhay Bhutada’s Views After Poonawalla Fincorp’s Collaboration With...Exploring Abhay Bhutada’s Views After Poonawalla Fincorp’s Collaboration With...
Exploring Abhay Bhutada’s Views After Poonawalla Fincorp’s Collaboration With...
beulahfernandes8
 
The WhatsPump Pseudonym Problem and the Hilarious Downfall of Artificial Enga...
The WhatsPump Pseudonym Problem and the Hilarious Downfall of Artificial Enga...The WhatsPump Pseudonym Problem and the Hilarious Downfall of Artificial Enga...
The WhatsPump Pseudonym Problem and the Hilarious Downfall of Artificial Enga...
muslimdavidovich670
 

Recently uploaded (20)

APP I Lecture Notes to students 0f 4the year
APP I  Lecture Notes  to students 0f 4the yearAPP I  Lecture Notes  to students 0f 4the year
APP I Lecture Notes to students 0f 4the year
 
how to sell pi coins on Bitmart crypto exchange
how to sell pi coins on Bitmart crypto exchangehow to sell pi coins on Bitmart crypto exchange
how to sell pi coins on Bitmart crypto exchange
 
managementaccountingunitiv-230422140105-dd17d80b.ppt
managementaccountingunitiv-230422140105-dd17d80b.pptmanagementaccountingunitiv-230422140105-dd17d80b.ppt
managementaccountingunitiv-230422140105-dd17d80b.ppt
 
The European Unemployment Puzzle: implications from population aging
The European Unemployment Puzzle: implications from population agingThe European Unemployment Puzzle: implications from population aging
The European Unemployment Puzzle: implications from population aging
 
how to sell pi coins on Binance exchange
how to sell pi coins on Binance exchangehow to sell pi coins on Binance exchange
how to sell pi coins on Binance exchange
 
Empowering the Unbanked: The Vital Role of NBFCs in Promoting Financial Inclu...
Empowering the Unbanked: The Vital Role of NBFCs in Promoting Financial Inclu...Empowering the Unbanked: The Vital Role of NBFCs in Promoting Financial Inclu...
Empowering the Unbanked: The Vital Role of NBFCs in Promoting Financial Inclu...
 
what is the future of Pi Network currency.
what is the future of Pi Network currency.what is the future of Pi Network currency.
what is the future of Pi Network currency.
 
The secret way to sell pi coins effortlessly.
The secret way to sell pi coins effortlessly.The secret way to sell pi coins effortlessly.
The secret way to sell pi coins effortlessly.
 
BYD SWOT Analysis and In-Depth Insights 2024.pptx
BYD SWOT Analysis and In-Depth Insights 2024.pptxBYD SWOT Analysis and In-Depth Insights 2024.pptx
BYD SWOT Analysis and In-Depth Insights 2024.pptx
 
The Evolution of Non-Banking Financial Companies (NBFCs) in India: Challenges...
The Evolution of Non-Banking Financial Companies (NBFCs) in India: Challenges...The Evolution of Non-Banking Financial Companies (NBFCs) in India: Challenges...
The Evolution of Non-Banking Financial Companies (NBFCs) in India: Challenges...
 
Isios-2024-Professional-Independent-Trustee-Survey.pdf
Isios-2024-Professional-Independent-Trustee-Survey.pdfIsios-2024-Professional-Independent-Trustee-Survey.pdf
Isios-2024-Professional-Independent-Trustee-Survey.pdf
 
what is the best method to sell pi coins in 2024
what is the best method to sell pi coins in 2024what is the best method to sell pi coins in 2024
what is the best method to sell pi coins in 2024
 
How to get verified on Coinbase Account?_.docx
How to get verified on Coinbase Account?_.docxHow to get verified on Coinbase Account?_.docx
How to get verified on Coinbase Account?_.docx
 
Commercial Bank Economic Capsule - May 2024
Commercial Bank Economic Capsule - May 2024Commercial Bank Economic Capsule - May 2024
Commercial Bank Economic Capsule - May 2024
 
Scope Of Macroeconomics introduction and basic theories
Scope Of Macroeconomics introduction and basic theoriesScope Of Macroeconomics introduction and basic theories
Scope Of Macroeconomics introduction and basic theories
 
The new type of smart, sustainable entrepreneurship and the next day | Europe...
The new type of smart, sustainable entrepreneurship and the next day | Europe...The new type of smart, sustainable entrepreneurship and the next day | Europe...
The new type of smart, sustainable entrepreneurship and the next day | Europe...
 
PF-Wagner's Theory of Public Expenditure.pptx
PF-Wagner's Theory of Public Expenditure.pptxPF-Wagner's Theory of Public Expenditure.pptx
PF-Wagner's Theory of Public Expenditure.pptx
 
US Economic Outlook - Being Decided - M Capital Group August 2021.pdf
US Economic Outlook - Being Decided - M Capital Group August 2021.pdfUS Economic Outlook - Being Decided - M Capital Group August 2021.pdf
US Economic Outlook - Being Decided - M Capital Group August 2021.pdf
 
Exploring Abhay Bhutada’s Views After Poonawalla Fincorp’s Collaboration With...
Exploring Abhay Bhutada’s Views After Poonawalla Fincorp’s Collaboration With...Exploring Abhay Bhutada’s Views After Poonawalla Fincorp’s Collaboration With...
Exploring Abhay Bhutada’s Views After Poonawalla Fincorp’s Collaboration With...
 
The WhatsPump Pseudonym Problem and the Hilarious Downfall of Artificial Enga...
The WhatsPump Pseudonym Problem and the Hilarious Downfall of Artificial Enga...The WhatsPump Pseudonym Problem and the Hilarious Downfall of Artificial Enga...
The WhatsPump Pseudonym Problem and the Hilarious Downfall of Artificial Enga...
 

Forex market-outlook-2015

  • 1. Our services include products that are traded on margin and carry a risk that you can lose more than your initial deposit. © 2014 FOREX.com 1 $ $ ¥ ¥ ¥ ¥ £ € € € € $ $ MARKET OUTLOOK 2015 A YEAR OF OPPORTUNITY
  • 2. Our services include products that are traded on margin and carry a risk that you can lose more than your initial deposit. © 2014 FOREX.com 2 2015 OUTLOOK 2 STOCKS: MAJOR INDICES OUTLOOK 2014 has been another stunning year for US equities. We assess whether the market can make it a hat-trick and give you our view on whether the S&P 500 can make another record year. European markets have lagged behind their US peers, but some markets are starting to look like a good value. Get our take on whether Europe can steal the limelight from the US. 3 COMMODITIES: GOLD AND OIL Oil has fallen more than 30% in the second half of 2014 with OPEC looking unlikely to cut production. We ask whether oil has fallen far enough that it could be due a recovery this year. 4 EMERGING MARKETS OUTLOOK In 2013 we had the taper-tantrum: could we get rate-rage in 2015? We assess the impact of a US rate hike on emerging economies and look at what countries are most at risk in 2015. 5 VOLATILITY OUTLOOK 2015 What could cause volatility to spike this year? Should we be on our guard, or will volatility fall back to 2014’s record lows? What are the most volatile currencies to keep an eye on and how does a strong dollar create market fear? 6 ELECTION WATCH: UK This is one of the most important elections in years. If UKIP’s star continues to ascend could it disrupt the UK political system? We assess potential outcomes of the election and discuss what this means for the UK’s position within the EU and the impact on the pound and UK-based assets. 7 FX FORECASTS 8 ECONOMIC CALENDAR 9 STOCKS: GALVAN’S ONES TO WATCH FOR 2015 This is compiled with help from the newest addition to the GAIN Capital team – Galvan Research, who have chosen three of the most promising stocks for 2015 and give you their take on why they are worth watching. 1 GLOBAL GROWTH OUTLOOK: With Europe, China and the UK all showing signs of slowing down, we assess whether the US can prop up global growth singlehandedly. We also look at what this means for global monetary policy and ask whether the Fed will bite the bullet and hike rates mid 2015. We also look at the prospect of QE from the ECB, and what the Europeans can do if deflation takes hold. 10 EXCLUSIVE: TOP TAIL RISKS FOR 2015 We give you our most outrageous predictions for 2015, from the prospect of UKIP taking power in the US, a collapse in the oil price, the return of Berlusconi to front-line Italian politics and the prospect of the USD/JPY reaching 180.
  • 3. Our services include products that are traded on margin and carry a risk that you can lose more than your initial deposit. © 2014 FOREX.com 3 1 GLOBAL GROWTH OUTLOOK US: Growth via Tangential Quantitative Easing The US economy had been in recovery mode in 2014 with big improvements in GDP and the unemployment rate, which fell to its lowest level since 2008. Inflation was the one weak spot, as it was stubbornly lower than the Fed may have desired; however, it remains stable as we move into 2015. Those who were expecting the US economy to fail miserably once monthly stimulus from the Federal Reserve ended in October were briefly validated as stocks tumbled in the immediate days following the announcement, but rebounded thereafter and appear strong heading in to the end of 2014. Despite the dangers of weakness in the economies of Europe and Asia to the US, the measures taken by those other nations could actually help the US maintain its current level of strength, especially if we see the ECB embark on QE at some stage in 2015. All in all, the future looks bright for the world’s largest economy, and if oil prices continue to decline as they have in the latter half of 2014, the US may keep this momentum going even if the Fed starts to increase rates to a more historically normal level at some stage this year. Figure 1 Source: FOREX.com
  • 4. Our services include products that are traded on margin and carry a risk that you can lose more than your initial deposit. © 2014 FOREX.com 4 Federal Reserve: Committed to Hawkish Policy? The Federal Reserve is expected to take its first steps towards normalizing monetary policy in the middle of 2015, with the market anticipating a rate rise sometime in June or July. The US is in a position of cyclical leadership with the economy doing well, particularly the jobs market, and the US managing to buck the global disinflation trend. The US created over 300,000 jobs in November, but more important to Fed policy was the 0.4% rise in hourly earnings for November, which was the largest monthly rise since October 2011. The expected rate rise from the Fed has been one of the major factors behind dollar strength in 2014. The greenback has outperformed all of the major currencies and all of the emerging market currencies bar the Indian rupee (INR) and the Hong Kong dollar (HKD). Due to the divergent monetary policy paths between the Fed and other major central banks, the dollar is in a good position to continue to outperform in 2015, at least for the first half of the year. In the first few months of 2015 we think that the focus will shift towards what the Fed will do after the first rate hike. Right now the market is looking for two further hikes for the rest of the year, which has been supported by the economic data; however, the bigger risk in our view is that the Fed is not as hawkish as some expect. The Fed may have adopted a hawkish tone at its October meeting, but it could change its tune if the economic data starts to deteriorate or if the US catches the disinflation bug from the steep drop in oil prices. The other major risk to the Fed outlook is the dollar. So far the Fed has been remarkably tolerant of a strengthening greenback while other major central banks have been happy to see their currencies depreciate, including the Bank of Japan and the ECB. If the strong dollar trend continues in the first half of next year, the Fed may decide that it no longer wants to lose the race to the bottom. If the Fed starts to talk down the prospect of multiple rate hikes next year then we could see a sharp reversal in the dollar, and some respite for emerging market currencies that have fallen sharply against the greenback including the Brazilian real, South African rand and Russian ruble. While we expect the dollar to reign supreme in Q1 2015, its performance for the second half of the year could be tricky depending on the Fed’s tolerance of dollar strength. FX markets could face another year trying to parse Fed statements to see if Fed members are happy with the level of the buck. Thus, 2015 could be a year of two halves for the Fed: the first half could be about making the long-awaited rate hike, while the second half could be a more cautious Fed who tempers its rate-hike talk to limit dollar upside. Eurozone: To QE or Not To QE, That Is the Question… Big things are expected of the European Central Bank in 2015. After the Fed ended its quantitative easing program in October, the market has been waiting for the ECB, along with the BOJ, to take its place by providing the global financial system with Fed-style liquidity. But while the BOJ have been willing to step into the Fed’s shoes by announcing a second round of QE late last year, the same may not be true for the ECB. The ECB held steady at its December meeting; however, ECB President Draghi has sounded more supportive about the prospect of further easing and potential QE in recent weeks. As we move into 2015 we continue to think that the bar to QE remains high. According to German press reports after the December ECB meeting, three members of the ECB’s six-strong executive board refused to sign off Mr. Draghgi’s statement. Considering there is still a legal challenge outstanding on the ECB’s OMT program, don’t expect the opposition to QE to soften by the time of the first ECB meeting of 2015 on January 22nd.
  • 5. Our services include products that are traded on margin and carry a risk that you can lose more than your initial deposit. © 2014 FOREX.com 5 A caveat to our theory that the ECB will not embark on QE would kick in if inflation falls below 0% in December. If this happens then we could see the ECB take some action, but we doubt that the ECB will fill the Fed’s shoes when it comes to QE, or even match Draghi’s pledge to boost the ECB balance sheet by EUR 1 trillion. Draghi talked about this six months ago and said a larger balance sheet was needed to ward off deflation fears. But since then nothing has happened and the ECB’s balance sheet has shrunk by EUR 100 billion. But will an ECB QE program actually work? Unfortunately for the ECB, the answer isn’t as clear as it may hope. The two most recent large-scale versions of QE were the US version (QE3) and the Japanese version (QQE); one has been a resounding success so far, the other not so much. As the US enjoys accelerated job growth, healthy GDP growth and inflation on the lower end of acceptability, Japan has experienced a worsening economy and still too low inflation despite the enormous size of stimulus in terms of the size of their economy. What Europe needs to find is at least some semblance of what the Fed has done with its version of QE. However, you will notice that there is a “3” next to the Fed’s QE which means that this was the third time around for the world’s most influential central bank, so getting it right isn’t easy. The easiest outcome for Mario Draghi would be a large take-up of its longer-term refinancing operations (known as TLTRO). Back in September the Bank only managed to attract bids to the value of EUR 82.6 billion for its cheap loans. The market will be looking for take-up around the EUR 150 billion mark at future auctions. If this happens then QE may not be deemed necessary, which could save Draghi a fight with his German colleagues. Apart from QE, the ECB could have more pressing problems to deal with in 2015. Greece is expected to have a general election sometime in spring, which could see a win for the anti-euro SYRIZA party. This may widen sovereign credit spreads, and could make it hard for Greece to remain in the currency bloc if its new government does not adhere to the strict terms of its 2010 bailout. The impact on the EUR is likely to be negative. Widening sovereign spreads combined with QE could trigger another leg lower to below 1.20 vs. the USD. However, even though deflation fears and Greek political risks could prove toxic for the EUR, bears need to be careful. Firstly, the EUR has already had a sharp fall vs. the USD. Secondly, the market is already short the EUR which leaves the single currency at risk of a reversal. Lastly, as we mention above, the Fed may not be comfortable with dollar strength and could adjust its policy towards the middle of 2015 to limit upside in the greenback. Overall, the outlook is negative for the EUR, albeit with a potential slowdown in the pace of depreciation in the second half of 2015. Japan: Sowing the Seeds of Hyperinflation Do a quick Google search on “Japan” and “hyperinflation” and you’ll likely come across a litany of articles and prophecies declaring that The Land of the Rising Sun has already pulled a Wile E. Coyote; namely that they’ve already run off the inflationary cliff, but we’re just waiting for them to realize it and plummet to the earth. Granted, some of those doomsayers were saying the same thing back in 2010 or 2013 or probably even before then if you dig deep enough. The problem for these prognosticators is that it hasn’t come to fruition despite all the warning signs blinking red across the board. In fact, for years Japan has been adding to situations that historically help trigger a hyperinflationary event.
  • 6. Our services include products that are traded on margin and carry a risk that you can lose more than your initial deposit. © 2014 FOREX.com 6 One of the most frequently quoted metrics for determining the future fate of Japanese inflation is their debt-to-GDP ratio, or gross government debt as a percentage of GDP. In this category, Japan is at the top of the world at 237.92%, and they really shouldn’t want to be there. The list of nations that are actually doing BETTER than Japan in this category is a who’s who of economic strife: Zimbabwe, Greece, Portugal, Italy, Iceland, Ireland, and Lebanon, just to name a few. In its defense, Japan does have plans to try to lower that debt-to-GDP burden as a consequence of Prime Minister Shinzo Abe’s economic stimulus program (lovingly dubbed “Abenomics”), but it hasn’t gone according to plan so far. In an effort to bring budgets closer to actual revenue there was a consumption tax hike back on April 1st 2014 (that wasn’t an April Fool’s joke), which was supposed to be followed by another hike in 2015 that has now been delayed for 18 months due to a struggling economy. In addition, the Bank of Japan has increased Quantitative Easing in an effort to get interest rates so low that Japanese investors stop buying Japanese Government Bonds. Past hyperinflationary episodes were largely caused by an increase in money supply to help pay off debts, the most well-known being the Weimar Republic in Germany in the 1920s. In an effort to bring Germany out of recession and pay off reparation debts from WWI, the German Papiermark was devalued by 50% in 1919 which kicked off the inflationary episode economists love to reference. Eventually, the Papiermark was replaced by the Rentenmark at a conversion of 1 trillion to 1 in 1923, which is utterly ridiculous when you think about it. However, it wasn’t just debt that helped trigger hyperinflation; there was also political uncertainty and overall loss of confidence as the Great Depression was felt especially hard in Germany. While Japan hasn’t outright devalued their currency in one fell swoop like Germany did back in 1919, they have devalued it by over 50% in the last two years as the USD/JPY has risen from sub 80 to over 120 at the time of this writing. In addition, the Bank of Japan has pledged to add to their already large QE (15% of GDP per annum) by double if the economy doesn’t start to recover, which would take that already burdensome debt-to-GDP ratio even higher. When Germany started experiencing hyperinflation, their debt-to-GDP ratio was just under 300%. Also Japanese politics are in flux as Abe has called for new elections and Japanese consumer confidence has declined in the latter half of 2014. When perceived as a whole, it appears that Japan has sown all the necessary seeds to bring about hyperinflation in the struggling state. However, once again, these seeds have been sown for many years now as doomsayers have been keen to point out. So will 2015 be the year that Japan finally falls down the rabbit hole? Whether hyperinflation is the ultimate result or not, it appears that the JPY might be losing even more value as the hyperinflationary seeds continue to germinate. Bank of England: Shifting to a Dovish Stance The last weeks of 2014 saw a sharp reduction in expectations around the timing of the first rate hike from the Bank of England. In the middle of 2014 the market had expected the BOE to hike rates at the end of Q1 2015; however, after a sharp fall in inflation and a deterioration in the UK’s growth outlook, expectations for the first rate hike have been pushed back to August 2015. This recalibration of rate expectations for the UK has been reflected in the pound, which has fallen more than 3% versus the USD since the start of the fourth quarter. The outlook remains bleak for the pound as we start the new year on the back of falling inflation expectations and monetary policy divergence with the Federal Reserve in the US. Falling inflation is a big risk for the pound this year, as the BOE may find it tough to hike interest rates if prices continue to fall. The Bank of England’s 12-month inflation expectations survey for November saw expectations fall to their lowest level since February 2010 (see the chart below). This is problematic for the Bank as maintaining price stability is its only mandate, yet inflation is falling sharply and could drop below 1% early next year.
  • 7. Our services include products that are traded on margin and carry a risk that you can lose more than your initial deposit. © 2014 FOREX.com 7 If inflation continues to miss the BOE’s 2% target rate then we would expect some more dovish talk from the MPC. While we don’t think that they will boost policy action to try and stem the disinflationary trend, we do think that they will be happy to push back market rate expectations until late 2015. From a currency perspective this is pound negative, but economic fundamentals may also weigh on the pound next year. The UK’s current account deficit is still a large 5.17% of GDP; this compares with a deficit of 2.25% of GDP in the US and a 2.41% surplus in the Eurozone. We think that the market will be less forgiving of the UK’s economic imbalances, especially as the other major economies have made large improvements. Added to this, political risk is back to the fore with the General Election in May (see our election preview for more). The pound’s performance next year could be somewhere in the middle between the US dollar and the Euro. We think it will continue to fall versus the USD due to political risk, a deteriorating growth outlook and divergent monetary policy paths for the Fed and the BOE, while it may continue to rise versus the EUR, especially if the ECB embarks on QE at some stage this year. Figure 2: Source: FOREX.com
  • 8. Our services include products that are traded on margin and carry a risk that you can lose more than your initial deposit. © 2014 FOREX.com 8 Australia and New Zealand Continue to Head in Different Directions It’s going to be a very important year for Australia and New Zealand. Both economies face many trials in the year ahead, but New Zealand may emerge as the victor in the Trans-Tasman battle for growth. In Australia during 2013-14 a strong property market showed potential to spur economic growth in the broader economy, but the rest of the economy failed to respond and activity at the ground level remains restrained. This is set against a backdrop of retreating mining investment and falling key commodity prices, which doesn’t bode well for Australia’s all-important resources sector. It’s not all doom and gloom Down Under, however. There is some hope that a falling exchange rate and accommodative monetary policy will carry the economy through 2015. Since September 2014 the Australian dollar has taken a mauling, with AUDUSD down over 10% at the time of writing (this report was written in early December). The onus is on policymakers to help support the economy and foster sustainable economic growth. Further monetary policy loosening by the RBA next year should keep the economy from stalling, but GDP growth may fall to around 2.5% in 2015. This assumes the exchange rate remains in the low 0.8000’s and commodity prices don’t fall off another cliff. In NZ, the economy is much better situated to deal with threats to growth originating from falling commodity prices and even lackluster global commodity demand. NZ is heavily reliant on certain commodity exports, particularly dairy products. However, NZ has other avenues of growth to fall back on. Rebuilding efforts in Canterbury, a generally solid construction market and strong net immigration are expected to augment domestic demand in 2015. These reliable sources will provide a solid platform for growth this year. At the same time, the economy is dealing very efficiently with high levels of growth. In other words, it can sustain a high growth rate without booming inflation, which in turn gives the RBNZ more room to keep monetary policy at a more accommodative level for longer. The differing economic conditions and tolerances between Australia and NZ are expected to widen the interest-rate gap between the two nations. In Australia, the threat of a strong housing market is always going to be in the back of the RBA’s mind, but it can use macro-prudential tools to limit price pressures in the housing market. This will free up the RBA to use traditional monetary policy to support the broader economy. As such, we expect the RBA will cut the official cash rate next year. We believe that the RBA may hike rates twice next year, which would bring the cash rate to 2.00% by the end of 2015. Across the Tasman, the RBNZ is expected to begin tightening monetary policy next year, but not until Q3 or Q4. Easing price pressures in the housing market and only mild inflationary forces in the rest of the economy, largely due to falling commodity prices, mean that the RBNZ can maintain looser monetary policy for longer than would be possible if inflationary pressures were stronger. We see the RBNZ raising the cash rate to 3.75% late in the third quarter or early in Q4 2015. $ €
  • 9. Our services include products that are traded on margin and carry a risk that you can lose more than your initial deposit. © 2014 FOREX.com 9 Figure 3: Source: FOREX.com The widening gap between monetary policy expectations in Australia and NZ is already playing out in the FX market. AUDNZD was assaulted by the bears in the final quarter of 2014 and we expect it will continue to broadly weaken in 2015. In fact, we put AUDNZD below 1.0500 by the end of year with a 50% chance it will break parity. Looking at figure 4 we can see that AUDNZD still has further to fall based on the current divergent monetary policies of NZ and Australia. Figure 4: Source: FOREX.com
  • 10. Our services include products that are traded on margin and carry a risk that you can lose more than your initial deposit. © 2014 FOREX.com 10 RBA policy action next year may also keep AUDUSD depressed, although this is largely dependent on the outlook for US interest rates which is in turn dependent on the US labor market and inflation numbers. NZDUSD is also susceptible to widespread USD strength and possible central bank intervention on the part of the RBNZ. China’s Slow Descent Continues Beijing has been forced to reconsider its position regarding the use of broad-based stimulus measures to support China’s decelerating economy as more threats emerge both externally and internally. At the end of 2014 the PBoC shocked the market by cutting interest rates for the first time since July 2012. Despite some initial comments from the PBoC suggesting that this move shouldn’t have signaled a change in policy, the move was unquestionably more aggressive than the targeted stimulus measures we witnessed earlier in the year. The door is now open for further easing from Beijing as it attempts to prevent its economy from stalling this year, but we still suspect real GDP will slow to 7.0% by year-end, from an estimated 7.4% in 2014. The mixture of lackluster global growth, falling property prices and stagnant domestic demand is weighing on China’s growth outlook. Early in 2014 Beijing was attempting to support the economy without stoking China’s red-hot property market. This was done by introducing a raft of measures aimed at cooling the booming market. Later in the year most of these tools were slowly withdrawn as property prices began to tumble across the board. In fact, property prices were falling so precipitously that it raised concerns about a possible crash and despite the relaxation of property curbs these concerns haven’t been entirely alleviated (out of the 70 cities surveyed, 69 are still experiencing falling property prices – see figure 5). Figure 5: Source: FOREX.com
  • 11. Our services include products that are traded on margin and carry a risk that you can lose more than your initial deposit. © 2014 FOREX.com 11 At the same time Beijing must addresses other weaknesses emerging from China’s economy. There are two main sources for growth in a modern economy: domestic demand and global demand. China has historically been an export- based economy, but it is attempting to transition towards a more effective growth model that takes advantage of China’s massive population. As urbanization continues to transform China into a more developed economy, it can tap into more reliable and sustainable growth conduits from within its own economy. However, the near-term outlook for domestic demand isn’t good, particularly given recent soft import data, stagnant inflation numbers and persistent disinflation in producer prices. While China can still largely rely on its robust export market for growth, it cannot seek long-term sustainable growth from this area. This puts even more focus on the strength of domestic demand in China. As is evident from figure 6, consumer price growth has flatlined and imports are declining; some of the weak import data can be attributed to falling commodity prices but some is clearly the result of softening domestic demand. What Kind of Response Can We Expect from Beijing? Beijing has been carefully managing China’s slowdown since it began, and nothing is expected to change in this regard. Throughout 2014 the PBoC was using targeted stimulus to support the financial sector by injecting liquidity into the nation’s biggest banks and small lenders, either through direct injections or by lowering funding costs. Later in the year China’s central bank cut its one-year lending rate by 40 bps to 5.6% and its one-year saving rate by 25 bps to 2.75%. As Figure 6: Source: FOREX.com
  • 12. Our services include products that are traded on margin and carry a risk that you can lose more than your initial deposit. © 2014 FOREX.com 12 we stated earlier, this signaled to the market that the PBoC is primed to use its big guns once more to spur demand. Yet more monetary easing may be needed in China, although the decision to ease further must be weighed against the advancement of structural reforms and local government debt management. Deposits at China’s major banks are suffering as people seek out other investment alternatives, so now these banks are pressuring the PBoC to cut its 20% RRR, thereby allowing them to lend more of their deposits. Given the ineffectiveness of the first interest-rate cut in two years, the threats to growth, the fact that inflation is well below target and the PBoC’s apparent alacrity to pull out its big guns, we believe the bank may cut interest rates again as well as banks’ Reserve Requirement Ratio (RRR). The Yuan May Soften again in 2015 Part of the attractiveness of CNY-denominated assets are the generally high yields on offer as well as the safety that comes from the guarantees that Beijing has placed on some assets. The fact that the yuan was thought of as a one- way bet only encouraged more hot money into China, thereby compounding the upward pressure on the exchange rate. While the idea that the renminbi could only strengthen was mostly dispelled earlier this year by the PBoC as they engineered a decline in the exchange rate, the aforementioned attractiveness of the yuan couldn’t be ignored. However, the severity of the economic issues facing China may see the yuan weaken for its second year in a row against the US dollar. The prospect of further interest rate or RRR cuts on the back of softening economic conditions in China make the renminbi less attractive and increase the PBoC’s motivation to engineer a fall in the exchange rate to support exporters. Further policy loosening could flood the market with renminbi, especially if the PBoC elects to cut the RRR. This may see USDCNY push towards 6.35 by the end of 2015. Figure 7: Source: FOREX.com
  • 13. Our services include products that are traded on margin and carry a risk that you can lose more than your initial deposit. © 2014 FOREX.com 13 2 2015 EQUITIES OUTLOOK 2014 has been another great year for US equities and a mixed one for Europe. As of early December, the S&P 500 was up 13% year to date, Nasdaq 100 up 22% and Dow Jones was 9% higher. In contrast, Germany’s DAX index was ‘only’ up 7% while Britain’s FTSE was literally flat year to date. Despite the geopolitical tensions in Ukraine and the Middle East and the slump in oil prices, investors’ appetite for equities has been strong as global central banks stick to their accommodative monetary policies. Some of the themes from 2014 are likely to remain in place in 2015 for stocks, especially the support from central banks. The ECB for example may move to expand its asset purchases program to include government debt as it fights deflationary threats from falling oil prices and weaker wage growth. This could be a boon to German stocks in particular. The US is again likely to lead the global economic recovery while the weaker commodity prices could alleviate the pressure on emerging markets. But weaker oil and metal prices could also mean the FTSE, a commodity-heavy index, could underperform once again. As monetary policy in the US is heading towards the path of normalization, we envisage only moderate further gains for US stocks, at least compared to recent years. But from a technical point of view, the major US indices are still not in the parabolic phase of the bubble, assuming one is forming. So, there could be further sharp gains to come before the bubble potentially bursts, perhaps toward the end of 2015. DAX Could Outperform in 2015 Although we think that the economic outlook for the Eurozone is fairly bleak for 2015, we think Germany will lead growth in the Eurozone and we are therefore bullish on the DAX. After consistent falls in the German Ifo Business Climate index throughout 2014, there was an upward surprise in the November reading. Though one month’s worth of data may not be a game changer, we think the Ifo will continue to improve in 2015. The lower oil prices will likely help lower the production costs for German manufacturers and builders, which could in turn boost their bottom lines. Traders should watch the “Business Expectations” sub-index of the Ifo very closely this year as it tends to lead the Business Climate. ¥ € Figure 8: Source: FOREX.com
  • 14. Our services include products that are traded on margin and carry a risk that you can lose more than your initial deposit. © 2014 FOREX.com 14 If the Ifo does improve as we expect it to, the DAX index could potentially outperform the US indices, for it may also have the added support of the European Central Bank who may embark on QE (see our euro section for more). If introduced, this could provide further support for stocks as the ultra-loose monetary policy from the ECB will hopefully encourage households and businesses to spend more. A weaker euro may also be positive for the export-oriented German economy. Technical Outlook : DAX At the time of this writing the DAX was just shy of the 10,000 mark. This level had provided significant resistance earlier in 2014 and so there is a chance the index may hesitate again around this psychological area as the buyers continue to take profit going into year-end. Nevertheless, the long-term technicals are still supportive, which bodes well for at least the early part of 2015. The DAX is clearly in an upward trend, as pointed out, for example, by the still-rising 50-week moving average. Indeed, the momentum indicators are trending higher too: the weekly MACD has just created a bullish crossover while the RSI has broken its downward trend. We think that there is further momentum left in this rally that started in mid October. Thus, a decisive break above the 10k mark, which would be a very bullish development from a technical point of view, may be on the cards. As the DAX is trading near the record high it had achieved earlier in 2014, Fibonacci extension levels can be handy to give us a view of where this index could go next if we are to expect further upside. As you can see on the chart below, we have plotted the extension levels of the most recent sell-off from the previous record high of about 10050 to a low of 8350. The 127.2% extension level of this move comes in at 10510 while the 161.8% is just shy of 11100. Also, in between these levels is 10985; this level corresponds with the 161.8% Fibonacci extension of the entire 2007-2009 crash. So, our key bullish targets for 2015 are 10510, 10985 and 11100. Meanwhile, some of the key supports we are watching for 2015 include 9800, 9465 and 9000, levels that were formerly resistance. We will be paying particularly close attention to the bullish trend line that has been derived from connecting the low point of 2011 with that of 2014. If and when the DAX breaks below this trend, we could easily see a sharp correction. An even more bearish outcome would be a decisive break below the October 2014 low of 8350. But our base case is that the DAX could continue to appreciate while expectations for further ECB action run still high. Thus, we expect a couple of our bullish targets could be reached in the first quarter of 2015. Figure 9: Source: FOREX.com. Please note this product is not available to US clients.
  • 15. Our services include products that are traded on margin and carry a risk that you can lose more than your initial deposit. © 2014 FOREX.com 15 Commodity-Heavy FTSE 100 May Struggle Again The UK’s FTSE 100 could be among the European indices which may underperform in 2015, not least because, unlike the ECB, the Bank of England is unlikely to ease policy further. The relatively higher interest rates in the UK may put further upward pressure on the pound against the euro which could weigh on exports to the Eurozone – the UK’s largest trading partner. Meanwhile, miners and energy stocks could remain under pressure if commodity prices stay weak in 2015, which we think will be the case. The energy sector makes up 14% of the FTSE 100, with BP and Shell alone accounting for more than 10% of the index. Thus, if the weaker oil prices persist in 2015, these companies could weigh heavily on the FTSE 100 as they have done towards the end of 2014. Another factor that could weigh on the FTSE 100 is uncertainty ahead of the May 2015 general election and financial shocks due to increased regulations. In the Autumn Statement, Chancellor George Osborne announced plans to raise £4bn by limiting banks’ ability to use losses suffered during the global financial crisis to cut taxes on current profits. However, Mr. Osborne also unveiled new stamp duty rates that could save 98% of UK homebuyers money. In theory, this should help to increase demand for mortgages and also homebuilding, thus providing support for both banks and homebuilders. Support for the FTSE could also come in the form of increased M&A deals. The stronger US dollar was partly responsible for the M&A boom in 2014 and if this trend continues then so too could the number of deals. A weaker GBP/USD in 2015 could make British companies attractive takeover targets for US firms. The Technical View: FTSE 100 The FTSE has had many unsuccessful attempts to break above 6900 over the past two years. The last time they tried to break above 6900 was in September of 2014 when the index hit a fresh multi-year peak of 6905; but here, the rally once again stalled and the pace of the selling accelerated soon after. From that peak, the index went on to drop by 835 points to a low of 6070 by mid-October when the markets bottomed out. The bears were thus unable to break the major support area between 6000 and 6100 for the second time. This is potentially a very bullish outcome and we think that if the FTSE were to make a few more attempts at 6900 it may break decidedly higher. On a side note, it is worth pointing out that the long period of consolidation below 6900 suggests that an eventual breakout could potentially be quite significant in terms of magnitude. This would not only deliver a hammer blow to the existing sellers but also encourage fresh buyers to enter the market – particularly those who have so far been discouraged by the index’s lackluster performance in recent years. A decisive break above the 6900 level on the FTSE could pave the way for a move towards the Fibonacci extension levels around 7130/5 (127.2%) and then 7420/5 (161.8). The latter also corresponds with the upper resistance trend of the bullish channel. The intra-day record high of 6950, achieved in December 1999, should also be paid some attention should we get there. Meanwhile on the downside, the key supports that we will be watching in 2015 include the abovementioned 6000/6100 range, as well as the long-term Fibonacci retracement levels. Ahead of these are some near-term support levels, including 6525 and 6400.
  • 16. Our services include products that are traded on margin and carry a risk that you can lose more than your initial deposit. © 2014 FOREX.com 16 Stronger Dollar = Bad News for Earnings In 2014, US companies continued to surprise with their earnings results as the economy expanded at a moderate pace. According to research from FactSet, the telecoms, financials, material and healthcare sectors did particularly well in the third quarter while consumer discretionary was the only sector which reported a year-over-year decline in earnings. Compared to a year earlier, the overall S&P 500 earnings growth rate was a healthy 8% while the revenue growth was 4% in Q3. Some 77% of the S&P companies managed to beat profit expectations, making this the best quarterly performance since the second quarter of 2010 when 79% of the companies beat earnings estimates. As you can see in the chart below, US stocks and the dollar moved together for sustained periods in 2014. If the dollar continues to push higher in 2015 then this could be bad news for US exports. Clothing retailers and automakers could be among the worst hit, particularly in Europe where the euro may weaken further amid continued ECB intervention and lackluster growth. Figure 10: Source: FOREX.com. Please note this product is not available to US clients.
  • 17. Our services include products that are traded on margin and carry a risk that you can lose more than your initial deposit. © 2014 FOREX.com 17 A slowing global economy could start to hurt US corporate profits in Q4 2014. During the first two months of the quarter, analysts have lowered their Q4 earnings estimates by 3.9%. Unsurprisingly, the estimate reductions were led by the commodity-based sectors following the declines in crude and metal prices. Analysts have also trimmed their estimates for Q1 and Q2 of 2015, although this is subject to change closer to the time. Meanwhile companies themselves have been lowering their forecasts, with 76 out of 95 (80%) already issuing negative earnings guidance for Q4. So far, however, the markets have ignored these fundamental developments with the S&P trading at a record high at the time of this writing. The divergence between the index and the Q4 earnings estimates therefore increases the probability for a correction at some point in early 2015. But despite our slightly negative view on earnings, we are still overall bullish on stocks at the start of 2015. Some of the key risks to our outlook in 2015 include among other things the deterioration in emerging market economies, stagnation in the Eurozone and central banks’ inability to defeat deflation or at least create inflation (e.g. in Japan and now the Eurozone). The ongoing geopolitical tensions in Ukraine and to a lesser degree in the Middle East are also a concern. Meanwhile the Volatility Index (VIX) continues to trade near historic lows which suggests that the bullish complacency is extremely high. Figure 11: Source: FOREX.com.
  • 18. Our services include products that are traded on margin and carry a risk that you can lose more than your initial deposit. © 2014 FOREX.com 18 Technical View: S&P 500 The S&P 500 has been trending consistently higher in recent years. The recent acceleration in the trend suggests that the index could smash through this barrier and embark on a vicious rally. If it does that, then one should proceed with extra caution for we will have potentially entered the parabolic phase of the stock market bubble. Even then, the rally could extend far beyond most people’s imagination and in a very short period of time, too. But eventually the bubble will burst – the same way, for example, that silver’s did in 2011 – and we could then see a large unwinding of longs and the start of a major downward trend. When this will happen is a million-dollar question, but a good clue will be the first sharp pullback following an extensive parabolic-like rally. But until that happens, the “trend is your friend.” As the S&P is trading in unchartered territories, Fibonacci extensions and psychological levels are tools we can use as projections for potential turning points or bullish targets. The first such area is between 2137 and 2147: the lower end of this range corresponds with the 161.8% Fibonacci extension of the entire 2007 to 2009 crash while the upper end is the 161.8% extension of the correction we saw around September/October of 2014. We envisage that the S&P will at least pause for breath around this area if and when it gets there. Beyond this area are the psychological levels of 2200 and 2300 and further out still is the 261.8% Fibonacci extension at 2350. The latter looks like an extremely ambitious target, but we could get there in the event of a parabolic-like rally. Meanwhile old resistance levels are likely to turn into support. In this regard, the area around 2000/22 should be watched carefully. If the index breaks below here then a move towards the 50-week moving average or the support trend of the bullish channel could be next. A break below the latter would be a particularly bearish development. Figure 12: Source: FOREX.com. Please note this product is not available to US clients.
  • 19. Our services include products that are traded on margin and carry a risk that you can lose more than your initial deposit. © 2014 FOREX.com 19 3 2015 COMMODITIES OUTLOOK Crude Oil 2014 was a wild ride for crude oil traders. After initially moving sideways in a relatively narrow range, prices embarked on a surprise rally at the start of the summer as traders put the excessive supply and weaker demand worries behind them and concentrated on the geopolitical risks in the Middle East and, to a lesser degree, Ukraine. In particular it was the advance of the terrorist group ISIS in Iraq that unnerved oil speculators the most. However, once traders realized that most of the fighting was taking place in the country’s north, well away from the oil export terminals in the south, they quickly unwound their speculative long positions. This caused the price of oil to fall viciously in the space of just a few weeks, leading to the breakdown of a long-term bullish trend line on the Brent contract which encouraged further followup technical selling. Meanwhile the selling was exacerbated by the return of Libyan oil production towards normal levels following several months of rebel occupation of major oil terminals in the country. At the same time Iran was allowed to sell more oil as the country succumbed to western pressures and agreed to lower its uranium enrichment levels. The US and other non-OPEC oil producers were also contributing towards the supply glut, thanks mainly to the boom in shale oil output. As the world’s supply of oil increased dramatically and the growth in demand remained weak, prices took a huge drop in the second half of the year. The sell-off was made worse in November after the OPEC refused to concede more ground to shale producers by maintaining its production quota of 30 million barrels per day (mbpd) intact. Not only did the OPEC refuse to lower its production target, the cartel’s most important member, Saudi, has been selling oil cheaper than international benchmarks to its customers in Asia and the US. In other words, Saudi has potentially started a price war as it seeks to defend its market share against the rising US shale output. If this trend continues, there could well be further falls in the price of oil in early 2015. Whether or not US shale producers will be able to weather Saudi’s proverbial counterattack in excessive oil production is difficult to say, but one thing for certain is that the weaker oil prices are undoubtedly chipping away at their margins. This is reflected in the huge drops in share prices of the three large US companies that are involved in the fracking business: Halliburton, Baker Hughes and Weatherford. Since the summer of 2014, these stocks have lost between 25 to 50 percent of their value. The apparent desire of US shale producers to scale back their operations, combined with the very weak oil prices, suggest that the supply of US oil may now turn out to be a lot less in 2015 than it would have been the case under calmer market conditions. The major oil forecasters such as the OPEC, EIA and IEA may therefore have to cut their already-optimistic non-OPEC production estimates. The prospects of a tighter oil market therefore means prices could well stabilize very soon, particularly given the market’s exaggerated response to the OPEC news in late 2014. Still, with Saudi Arabia unwilling to cut back its production levels, and this combined with the threat of oil supply continuing to rise from other OPEC countries such as Iran, Iraq and Libya, concerns over excessive supply are unlikely to go away any time soon. With the OPEC being responsible for about 40% of global oil supply, further increases in production from this group may keep a lid on prices for the foreseeable future. A weak global economic recovery also argues against a major price recovery in 2015. Taking the supply and demand forces into consideration, it is really difficult to be bullish on crude oil going into 2015. At the same time, the extent of the price plunge makes us think that further sharp losses will be limited. So, overall, we envisage only moderate further losses in 2015 and expect prices to be a lot less volatile compared to 2014. We think that if prices were to stage a meaningful recovery, it would more likely be towards the end rather than start of 2015 when the global economy will hopefully be on a more stable and sustainable path of recovery. The main risk to our moderately bearish 2015 oil outlook is the escalation of geopolitical risks in the Middle East and North Africa (MENA) regions; we strongly believe that the market is under-pricing these risks at the moment. Meanwhile uncertainty over the direction of the US monetary policy and its impact on the dollar poses an additional risk to our forecast. A stronger dollar should undermine buck-denominated commodities, all else being equal.
  • 20. Our services include products that are traded on margin and carry a risk that you can lose more than your initial deposit. © 2014 FOREX.com 20 Crude Oil Technical View Brent Even from a technical point of view it is extremely difficult, if not impossible, to predict when oil prices may bottom out. But the speed of the drop since mid-2014 suggests that a recovery may not be too far out. On top of this, the weekly RSI – at just above 10 – has drifted further into the extreme oversold territory. Meanwhile prices have now fallen about $40 since the last major reversal pattern occurred i.e. the break of the long-term bullish trend line. The last time a major reversal pattern came about was in early 2012 when a double top/false breakout pattern drove prices down viciously. Then, too, oil prices dropped about $40 from a high of above $128 to around $88, in a similar, parabolic-like, manner. Thus if history were to repeat itself, Brent oil prices could find a base around or just below $67/$68. That said, the fundamental drivers are different this time around and there has been a clear shift in paradigm, so prices could take another or additional legs lower before stabilizing in early 2015. A key support level to watch out for is $68. This is where Brent had previously formed a double bottom reversal back in 2010. In addition, oil has now achieved at least a 61.8% retracement from its peak in 2012. But that’s not to say prices will necessarily bottom out here. Indeed, if the bears manage to push prices lower then that could give rise to further followup technical selling towards the next psychological round handles at $65 followed by $60. The long-term 78.6% Fibonacci retracement level comes in around $56, and below that is the next psychological level at $50. At this stage, the major long-term resistance levels that we will be watching are $80 and $88.50 – levels that were formerly support. Figure 13: Source: FOREX.com. Please note this product is not available to US clients.
  • 21. Our services include products that are traded on margin and carry a risk that you can lose more than your initial deposit. © 2014 FOREX.com 21 WTI Like Brent, WTI (or US) crude was also testing a major support area when we were putting this report together: around $65. As well as a major psychological level, this is also where a long-term bullish trend line comes into play. In addition, the 61.8% Fibonacci retracement level of the 2008-11 bull trend is also just below this $65 mark. So, while a bounce back here is possible, another potential break lower could pave the way for fresh selling pressure towards $60 and potentially even $50 at some point in 2015. Given the abovementioned fundamental drivers, we are only expecting moderate price recoveries throughout 2015. In our view, the buyers would do very well to push WTI prices above the $90 handle, let alone $100, at any point in 2015. But a counter-trend move towards $80 is more plausible particularly given that prices are already oversold.   Figure 14: Source: FOREX.com. Please note this product is not available to US clients.
  • 22. Our services include products that are traded on margin and carry a risk that you can lose more than your initial deposit. © 2014 FOREX.com 22 Precious Metals Gold had a quiet year in 2014 as it traded inside a $260 range in a sideways trend. In fact, at the time of this writing in early December, the shiny metal was hovering around the flat line for the year – albeit near the lower end of its yearly range. But given that the US dollar and equities have both risen considerably, gold has held its own remarkably well as it can move in the opposite direction of these two assets (see the chart below). The yellow metal’s performance as an asset that pays no interest or dividend becomes even more impressive when you consider the fact that inflation has been virtually nonexistent in the major global economies. Nevertheless, the general bias and market sentiment was bearish towards gold and generally many market participants expect this theme to continue in 2015. Something historic could be happening to the gold price. If the greenback continues in its upward trajectory, but gold fails to head in the opposite direction (or at least by a similar magnitude), then that would suggest investors are finally starting to treat gold as an independent asset, not a USD-denominated FX pair. Physical Demand could Increase in Early 2015 There was actually a good reason for gold to have climbed higher in November, which was driven by news from the Figure 15: Source: FOREX.com. Please note this product is not available to US clients.
  • 23. Our services include products that are traded on margin and carry a risk that you can lose more than your initial deposit. © 2014 FOREX.com 23 physical market; in a surprise move at the end of that month, India lifted some of the gold import restrictions. The so-called 80:20 rule, requiring importers to sell 20% of their shipments to jewelers for re-export, was abolished with immediate effect. Although the 10% import tax is still there and likely to remain in place throughout 2015, the removal of the 80:20 rule may help to shore up the physical demand in the former top gold consumer nation. Meanwhile the main wedding season in India is now underway and will last until about late January. During this time, large amounts of gold jewelry can be purchased by the Indians. Then it will be over to China where jewelry purchases are likely to increase ahead of their Lunar New Year on February 19. Indeed, we think that the main source of support for gold will probably come from the physical rather than the paper market in 2015 because, as mentioned, speculators are more likely to hold stocks rather than gold amid the record-low interest and inflation rates. Technical Outlook Gold The pace of gold’s decline slowed down towards the end of 2014 as the sellers once again struggled to hold their ground below the key $1180 level. As can be seen on the chart, the yellow precious metal has shown relative strength around this area for the best part of two years now. This has caused the Relative Strength Index (RSI) to create several instances of positive divergence, confirming that the bearish trend has weakened. In addition to horizontal support at $1180, gold has also found some support from its long-term 61.8% Fibonacci level at $1155. What the bulls would like to see now is a break above the long-term bearish trend and resistance around $1240. If seen, this could lead to the unwinding of further bearish positions which could thus add to the bullish momentum. The next significant levels beyond $1240 are $1345, $1390 and $1435. These are among our bullish targets for 2015 (subject to price breaking decisively above $1240 first). However as things stand, the long-term trend is still technically bearish for gold, so the vast majority of the market may still be positioned short. Therefore the possibility for further losses is there. If gold breaks below the 61.8% Fibonacci level, there is little support seen until the next psychological barrier at $1000. Figure 16: Source: FOREX.com.
  • 24. Our services include products that are traded on margin and carry a risk that you can lose more than your initial deposit. © 2014 FOREX.com 24 Silver The price action in silver suggests that the end of the four-year bearish trend in approaching, with the monthly chart below showing an almost perfect example of how the different phases of a bubble form. Although the grey metal has bounced off the key psychological $15 mark, there is still the possibility for perhaps one more vicious sell-off that could push its price momentarily below the long-term bullish trend line before it stages a recovery as it returns to the mean. In other words, we probably haven’t seen the “despair” part of the “blow off” phase yet. If we do witness that in 2015, the price of silver could potentially fall to around $10 before the bubble deflates fully. But whether or not it will get to $10 is anyone’s guess. Instead, traders should watch closely what silver may do if it rises towards the old key support around $19; only a decisive break above here will signal that the long-term downward trend is over. Until then the trend will remain bearish for silver. Figure 17: Source: FOREX.com.
  • 25. Our services include products that are traded on margin and carry a risk that you can lose more than your initial deposit. © 2014 FOREX.com 25 4 EMERGING MARKETS OUTLOOK: THE IMPACT OF COLLAPSING COMMODITIES As of writing in early December, emerging market currencies are on in the midst of a painful plunge. According to JPMorgan’s Emerging Market Currency Index, which measures the strength of a number of developing country’s currencies against the US dollar, EM currencies are at their lowest level since at least 2000. Of course, the recent broad-based strength in the dollar has driven all currencies lower on a relative basis, but the dollar’s strength has also impacted EM FX indirectly, through its impact on commodities. As we go to press, the S&P Goldman Sachs Commodity Index (GSCI, not shown) is down over 20% on the year, and certain widely followed commodities including oil have fallen even more. This big drop in commodity prices will have a major impact on growth, inflation, and monetary policy throughout the emerging market world. What Could Falling Commodity Prices Mean for EM FX? The most obvious impact of falling commodity prices is that the inflation should continue to fall heading into 2015. Emerging markets are particularly leveraged to commodity prices through consumption of food and energy, and the Figure 18: Source: FOREX.com and Bloomberg £ $
  • 26. Our services include products that are traded on margin and carry a risk that you can lose more than your initial deposit. © 2014 FOREX.com 26 corresponding drop in inflation could cause EM central banks to push back rate hikes or ease monetary policy in 2015. This impact may be particularly strong in economies that are struggling with relatively high inflation rates already, such as Turkey, South Africa and Russia. Likewise, major EM commodity producers may see a hit to growth as the beneficial impact of lower import prices is overwhelmed by the deleterious effect of lower export prices. As a result, fundamental traders should closely monitor each country’s terms of trade, or the price ratio between a country’s exports and imports, to evaluate whether falling commodity prices are benefiting or hurting each country. Below, we discuss a number of emerging countries (and their currencies) individually, but readers would be wise to note that emerging markets can be interrelated and the market’s attitude about one country can spread to other countries at a moment’s notice, as we saw in early 2014. USDMXN: Mexico Taking a Cue from its Northern Neighbor More than any other EM economy, Mexico is closely linked to its neighbor to the north. The relative outperformance of the US economy has spilled across the 30th parallel, and as a result, Mexico’s economy and currency are projected to hold up relatively well in 2015. Referring back to our commodity theme, Mexico is actually a net exporter of oil, so the recent collapse in crude prices does serve as a possible headwind for growth. That said, major structural reforms in recent years, along with projected strong growth in the US in 2015, should allow Mexico’s Banxico to hike interest rates later in 2015. On a technical basis, USDMXN consolidated around 13.00 for most of last year before the peso finally gave in to the dollar rally in December. Moving forward, a break of the five-year high at 14.60 may open the door for a continuation all the way toward the 2009 high near 15.55, though we anticipate that the peso may hold up better than some of its EM brethren against the greenback this year. Figure 19: Source: FOREX.com.
  • 27. Our services include products that are traded on margin and carry a risk that you can lose more than your initial deposit. © 2014 FOREX.com 27 USDRUB: Could Ruble’s Collapse Continue in 2015? Of course, it’s impossible to discuss EM FX without checking in on 2014’s resident basket case, the Russian ruble. The RUB was sold throughout the year on geopolitical risk from military incursions into Ukraine, the related economic sanctions from Western countries, falling oil prices and generally poor economic performance in the Mother Country. As we roll into 2015, the outlook for Russia’s economy remains weak, with the country struggling with a classic stagflation dynamic, as GDP growth is hovering below 0.5% and inflation is rising at more than 9% per year. The ongoing collapse in the ruble will only exacerbate price pressures in 2015, though the currency’s drop may provide some support to GDP growth. Speaking of the ruble, USDRUB has exploded all the way up to trade above 50 as of writing after the Central Bank of Russia (CBR) was forced to allow it to float freely in Q4. The efficacy of technical analysis is limited in such a parabolic, emotion-driven surge, but traders’ first impulse will be to buy dips in USDRUB in 2015 until the ruble can show signs of stabilizing. Figure 20: Source: FOREX.com
  • 28. Our services include products that are traded on margin and carry a risk that you can lose more than your initial deposit. © 2014 FOREX.com 28 USDZAR: Economy Poised to Rebound, but ZAR Still Struggling A prolonged mining strike derailed South Africa’s economy in 2014, but the country’s economy could see substantial improvement this year. Moving forward, the expected normalization of activity in the mining and manufacturing sectors should contribute positively to growth, especially in the first half of the year. Meanwhile, the drop in oil prices should reduce the country’s elevated inflation rate, though this impact may be partially offset by the sustained decline in the rand over the last few years. Given this economic backdrop, the South African Reserve Bank (SARB) is likely to remain on hold for the first half of the year and we anticipate that the rand will track EM FX as a whole next year. While the fundamental picture is cautiously optimistic for South Africa, the technical perspective is decidedly bearish. The pair has just broken out from a multi-month cup-and-handle pattern, hinting that the rally may accelerate heading into 2015. To the topside, the next level of resistance will be the Great Financial Crisis high at 11.84, followed round handle resistance at 12.00. Only a break below the established uptrend would shift the near-term bias back to neutral at this point. Figure 21: Source: FOREX.com
  • 29. Our services include products that are traded on margin and carry a risk that you can lose more than your initial deposit. © 2014 FOREX.com 29 USDTRY: Objectively, Turkey’s economy is doing poorly heading into 2015. The country saw a negative 0.5% q/q Q3 2014 GDP reading, bringing the country’s annualized GDP growth down to just 2.1%. Meanwhile, the country is struggling with an unemployment rate above 10%, inflation at 9%, and a current account deficit equal to nearly 8% of GDP. That said, markets are always forward looking, and like its EM rival South Africa, Turkey’s economy is poised for improvement in 2015. The biggest risk to Turkey’s economy in the coming year will be its dependence on external sources to finance its current account deficit, but anticipated further easing in the Eurozone should help in that regard. Turning our attention to the chart, the Turkish lira (TRY) held up relatively well against the dollar in 2014 beyond the brief EM panic in January. USDTRY is currently pressing a short-term bearish trend line off the January high, and if that barrier is eclipsed, a continuation toward the previous highs at 2.30 or 2.40 will be on the radar for 2015. Of course, a pullback in the dollar would leave plenty of room for weakness in USDTRY, with support initially at 2.20, followed by all the way down at 2014’s low near 2.0750. Figure 22: Source: FOREX.com
  • 30. Our services include products that are traded on margin and carry a risk that you can lose more than your initial deposit. © 2014 FOREX.com 30 5 VOLATILITY OUTLOOK 2015: DID 2014 MARK A SECULAR LOW IN VOLATILITY? Volatility is always a sticky subject for traders. By definition, some volatility is required to make profitable trades, but too much volatility can lead to erratic markets and unexpected losses. Lately though, traders have been having far more issues with the former than the latter: according to JP Morgan’s G7 Volatility Index, last summer’s doldrums marked an all-time low in currency market volatility, with the index dropping below its pre-Great Financial Crisis trough of six before volatility picked up heading into the end of the year. Figure 22: Source: Bloomberg, FOREX.com
  • 31. Our services include products that are traded on margin and carry a risk that you can lose more than your initial deposit. © 2014 FOREX.com 31 Naturally, the question on every trader’s mind is, “Will volatility finally rise this year or will it fall back to 2014’s record lows?” To answer this question, let’s analyze the primary catalyst that has pushed volatility consistently lower since 2009’s peak: easy monetary policy. Above all, the decline in currency market volatility since 2009 has been driven by unprecedented liquidity injections from global central banks. Beyond keeping interest rates at historically low levels, the Federal Reserve has enacted three separate iterations of QE (not to mention its Operation Twist program), while the Bank of Japan and the Bank of England have both maintained large asset purchase programs of their own over the past few years. While the Fed finally wound down its QE program in October, the BOJ recently expanded asset purchases, and there is a high likelihood that the ECB will also have to jump on the QE bandwagon in the first quarter of this year. As a result, some traders suggest that other central banks will simply pick up the Fed’s slack and that the prolonged five-year decline in volatility will stretch into 2015. Color us skeptical. Though the spigots of global liquidity remain wide open, another factor driving volatility lower has been the uniformity of monetary policy. That is, nearly every major central bank has been in easing mode for years (barring last year’s short-lived tightening cycle from the RBNZ), leaving little reason for long-term traders to shift their positions. Of course, many central banks will remain accommodative throughout 2015, but futures markets are still pricing in interest rate hikes from the Federal Reserve, BOE, and RBNZ later in the year. With incoming economic data likely to have a more direct and immediate impact on monetary policy this year, volatility is unlikely to revisit last year’s snore-inducing lows, in our view. Extending the above line of thought, volatility is likely to be highest in currencies with central banks that are on the verge of making changes to monetary policy. As of writing in late November, pressure is growing on the European Central Bank to start a sovereign QE program to stimulate its moribund economy, so volatility may be centered on the euro early in the year. As the year develops, volatility should start to increase in the US dollar, New Zealand dollar, and British pound (as their respective central banks grow more serious about raising interest rates), as well as the Australian dollar, which could even see the RBA cut rates later in the year. Of course, markets don’t always play out exactly as expected, but for now, the markets’ New Year Resolution may be to offer more volatility to traders.
  • 32. Our services include products that are traded on margin and carry a risk that you can lose more than your initial deposit. © 2014 FOREX.com 32 6 UK: A DRAMATIC SHIFT IN THE UK’S POLITICAL LANDSCAPE At this early stage the outcome of the UK’s general election, which will take place on 7th May 2015, is uncertain. We are too far away from the election to be able to derive much from the latest political polls; however, there have been some interesting developments in the last year. YouGov, the market research firm, found that November was the first month when more voters would vote for some other party than pick either the Conservatives or Labour party on their own. Digging a bit deeper into the YouGopv poll, we found that Labour were just about in the lead with 33% of votes and 32% of people said they would vote for the Conservatives, which would leave 35% who would vote for some other party. But while the share of the Tory and Labour vote has been falling in recent years, it is the Liberal Democrats (currently in a coalition with the Conservatives) who have seen the share of their vote dwindle to just 7%, the lowest level in this parliament. As the Lib Dems have faded in recent years, the three other remaining parties had some of their best results in their history. For example, UKIP, the anti-EU UK Independence Party, received 16% of the votes, an all-time high. The Scottish Nationalist Party reached 5% for the first time, and the Greens reached 6%. This is a sea change for British politics, and if current trends play out then we could see a radically different Parliament after this election. These polls suggest that the UK is likely to have another coalition government, so what outcome could we expect? At this stage it is worth pointing out that many voters could change their mind come election day and “go home” to the main parties, according to YouGov. However, we continue to believe that a coalition is likely and with the Lib Dems star descending, we thought it was worth looking at some potential outcomes: 1, Conservative and UKIP This would push the UK towards the right on issues like tax and immigration, but the biggest concern for the financial markets would be Britain’s position in Europe. UKIP want the UK out of the EU, while British PM David Cameron has promised an in/out referendum on the UK’s membership of the EU in 2017. This referendum could be brought forward if UKIP are involved in a coalition. 2, Labour and the Greens This pairing would trigger a shift to the left for the UK, with the Greens pushing for an environmentally friendly agenda that could be deemed unfriendly to business. Labour has promised to end austerity, increase taxes and boost public sector spending that could aggravate the UK’s deficit over the coming years, causing bond yields to rise. Overall, the two examples above would be a shift for British politics from the center either the left or the right. If this happens then it could trigger market panic as investors remain concerned about political uncertainty. This could trigger a sharp fall in the pound, a rise in Gilt yields, and a decline for the FTSE 100, as markets tend to react badly to uncertainty.
  • 33. Our services include products that are traded on margin and carry a risk that you can lose more than your initial deposit. © 2014 FOREX.com 33 Although the Labour party is traditionally considered bad for UK business and UK assets, we think that a Tory/ UKIP coalition could also trigger market panic and economic weakness as it would leave the UK’s position in the EU on shaky ground. At this stage the international community and some powerful figures in the business sector still see a UK exit (or Brexit) from the EU as a bad economic move that could hurt the UK’s major industries including finance and exports. Thus, as we move into January there are plenty of uncertainties to digest, which could weigh on the pound and other UK-based assets in the first half of the year. ¥ € £
  • 34. Our services include products that are traded on margin and carry a risk that you can lose more than your initial deposit. © 2014 FOREX.com 34 2014 Q1 Cross Previous Ranges Predicted Range Bullish/ Bearish Comments The ECB’s Draghi pretty much laid out QE in 2015 which may be very bearish in the near term. The ECB’s QE should be effective, but maybe not as much as Japan’s QQE and Abenomics. Since the SNB set the 1.20 floor in the EUR/CHF, price action has become less compelling and will likely continue to be so. Both the ECB and BoE have concerns over too little inflation which may be a neutralizing factor between these closely linked currencies. A brewing slowdown in China along with the RBNZ taking a more subdued stance could weigh heavily on the NZD. The furious rally in Q4 has shown the power the BoJ wields with QQE, and more may be in store for the future. Since the SNB peg on EUR/CHF, the USD/CHF has essentially been the antithesis of EUR/USD. The UK’s connectedness with Europe could hamper their currency, particularly against the recently dominant USD. The Chinese slowdown has had a negative impact, and combined with declining commodity prices, a recovery may be a long shot. With the US increasing oil produc- tivity and falling oil prices, the CAD may lose some luster as the US’s largest supplier becomes less vital. EUR/USD EUR/JPY EUR/CHF EUR/GBP NZD/USD USD/JPY USD/CHF GBP/USD AUD/USD USD/CAD Bearish Bullish Slightly Bullish Neutral Bearish Bullish Bullish Bearish Bearish Bullish 1.3476 – 1.3966 490 pips 136.22 – 145.11 889 pips 1.2103 – 1.2393 290 pips 0.8157 – 0.8399 242 pips 0.8050 – 0.8696 646 pips 101.68 – 105.43 375 pips 0.8698 – 0.9155 457 pips 1.6251 – 1.6822 571 pips 0.8659 – 0.9277 618 pips 1.0587 – 1.1277 690 pips 1.3502 – 1.3992 490 pips 137.69 – 143.46 577 pips 1.2139 – 1.2248 109 pips 0.7958 – 0.8312 354 pips 0.8401 – 0.8792 391 pips 100.81 – 104.12 331 pips 0.8702 – 0.9036 334 pips 1.6553 – 1.7114 561 pips 0.9201 – 0.9460 259 pips 1.0645 – 1.1069 424 pips 1.2627 – 1.3699 1072 pips 135.72 – 141.21 549 pips 1.2043 – 1.2176 133 pips 0.7765 – 0.8065 300 pips 0.7707 – 0.8834 1127 pips 101.06 – 109.84 878 pips 0.8855 – 0.9595 740 pips 1.6051 – 1.7190 1139 pips 0.8682 – 0.9504 822 pips 1.0619 – 1.1218 599 pips 1.18 – 1.26 800 pips 145.00 – 155.00 1000 pips 1.20 – 1.2150 150 pips 0.7750 – 0.8050 400 pips 0.7350 – 0.78 450 pips 117.00 – 126.00 900 pips 0.96 – 1.01 500 pips 1.53 – 1.58 500 pips 0.7950 – 0.8550 600 pips 1.13 – 1.17 400 pips 2014 Q2 2014 Q3 7 FX RATE EXPECTATIONS:
  • 35. Our services include products that are traded on margin and carry a risk that you can lose more than your initial deposit. © 2014 FOREX.com 35 subdued stance could weigh heavily on the NZD. The furious rally in Q4 has shown the power the BoJ wields with QQE, and more may be in store for the future. Since the SNB peg on EUR/CHF, the USD/CHF has essentially been the antithesis of EUR/USD. The UK’s connectedness with Europe could hamper their currency, particularly against the recently dominant USD. The Chinese slowdown has had a negative impact, and combined with declining commodity prices, a recovery may be a long shot. With the US increasing oil produc- tivity and falling oil prices, the CAD may lose some luster as the US’s largest supplier becomes less vital. As with most pairs related to JPY, bullish momentum appears never ending, especially considering more possible action from the BoJ. Both the RBNZ and RBA prefer their currencies to fall, but falling milk prices and commodities may weigh heavier on the NZD. The ascent of the USD along with declining data in China indicates that this pair may find strength in Q1 and beyond. USD/JPY USD/CHF GBP/USD AUD/USD USD/CAD GBP/JPY AUD/NZD USD/CNH Bullish Bullish Bearish Bearish Bullish Slightly Bullish Bullish Bullish 101.68 – 105.43 375 pips 0.8698 – 0.9155 457 pips 1.6251 – 1.6822 571 pips 0.8659 – 0.9277 618 pips 1.0587 – 1.1277 690 pips 163.86 – 174.82 1096 pips 1.0489 – 1.0944 455 pips 6.0148 – 6.2177 2029 pips 100.81 – 104.12 331 pips 0.8702 – 0.9036 334 pips 1.6553 – 1.7114 561 pips 0.9201 – 0.9460 259 pips 1.0645 – 1.1069 424 pips 169.48 – 174.08 460 pips 1.0642 – 1.1033 391 pips 6.1853 – 6.2710 857 pips 101.06 – 109.84 878 pips 0.8855 – 0.9595 740 pips 1.6051 – 1.7190 1139 pips 0.8682 – 0.9504 822 pips 1.0619 – 1.1218 599 pips 169.33 – 180.70 1137 pips 1.0621 – 1.1294 673 pips 6.1299 – 6.2184 885 pips 117.00 – 126.00 900 pips 0.96 – 1.01 500 pips 1.53 – 1.58 500 pips 0.7950 – 0.8550 600 pips 1.13 – 1.17 400 pips 185.00 – 200.00 1500 pips 1.0750 – 1.11 350 pips 6.15 – 6.24 900 pips Cross Previous Ranges Predicted Range Bullish/ Bearish Comments
  • 36. Our services include products that are traded on margin and carry a risk that you can lose more than your initial deposit. © 2014 FOREX.com 36 8 FOREX.COM’S 2015 MARKET-MOVING EVENTS January 22 – European Central Bank Meeting and Press Conference Back in July of last year, the ECB surprised traders by opting to change its meeting frequency to every six weeks, like the Fed, instead of its previous schedule of every four weeks. This change, along with the decision to start publishing the minutes from its meetings, will go into effect in January 2015 and will increase the importance of each ECB meeting. As of writing, the central bank is debating a possible sovereign QE program to combat entrenched deflationary pressures, so traders should keep a close eye on the central bank’s meetings for potentially big monetary policy changes in 2015. February 11 – Bank of England Quarterly Inflation Report While the regular rank-and-file Bank of England meetings have hardly been exciting over the last few years, the central bank’s Quarterly Inflation Reports have been far more informative for traders. The BOE typically uses this publication to outline its longer-term views for the UK economy and monetary policy. With inflation at a low (and falling) level heading into 2015, traders will eagerly devour these reports for hints about economic expectations and any potential changes to monetary policy.
  • 37. Our services include products that are traded on margin and carry a risk that you can lose more than your initial deposit. © 2014 FOREX.com 37 March 5 – European Central Bank Meeting and Press Conference Back in July of last year, the ECB surprised traders by opting to change its meeting frequency to every six weeks, like the Fed, instead of its previous schedule of every four weeks. This change, along with the decision to start publishing the minutes from its meetings, will go into effect in January 2015 and will increase the importance of each ECB meeting. As of writing, the central bank is debating a possible sovereign QE program to combat entrenched deflationary pressures, so traders should keep a close eye on the central bank’s meetings for potentially big monetary policy changes in 2015. March 18 – Federal Reserve Monetary Policy Meeting, Summary of Economic Projections and Press Conference Over the past couple of years, the Fed has reserved major monetary policy meetings for its quarterly meetings that also feature the release of the central bank’s Summary of Economic Projections (including the so-called “dot chart”) and press conferences so it can fully explain the decision. This year, these supercharged Fed meetings take place in March, June, September, and December, so readers should be prepared for a possible spike in volatility around those releases as traders look for more insight from the notoriously inscrutable central bank. As we go to press, futures markets are pricing in an interest rate hike by the Federal Reserve midway through 2015, but that expectation will undoubtedly fluctuate based on incoming economic data. March 22 – Sweden General Election As we go to press, the ruling Social Democrat-led government in Sweden has called for snap elections after surprisingly losing a budget vote. By law, this poll cannot be made official until December 29th, but assuming it is called as expected, the Swedish krone may face headwinds from political uncertainty in the first quarter of the year. April 15 – European Central Bank Meeting and Press Conference Back in July of last year, the ECB surprised traders by opting to change its meeting frequency to every six weeks, like the Fed, instead of its previous schedule of every four weeks. This change, along with the decision to start publishing the minutes from its meetings, will go into effect in January 2015 and will increase the importance of each ECB meeting. As of writing, the central bank is debating a possible sovereign QE program to combat entrenched deflationary pressures, so traders should keep a close eye on the central bank’s meetings for potentially big monetary policy changes in 2015. May 7 – United Kingdom General Election For information on the general election, see section 6 - UK: A Dramatic Shift in the UK’s Political Landscape. May 13 – Bank of England Quarterly Inflation Report While the regular rank-and-file Bank of England meetings have hardly been exciting over the last few years, the central bank’s Quarterly Inflation Reports have been far more informative for traders. The BOE typically uses this publication to outline its longer-term views for the UK economy and monetary policy. With inflation at a low (and falling) level heading
  • 38. Our services include products that are traded on margin and carry a risk that you can lose more than your initial deposit. © 2014 FOREX.com 38 into 2015, traders will eagerly devour these reports for hints about economic expectations and any potential changes to monetary policy. June 3 – European Central Bank Meeting and Press Conference Back in July of last year, the ECB surprised traders by opting to change its meeting frequency to every six weeks, like the Fed, instead of its previous schedule of every four weeks. This change, along with the decision to start publishing the minutes from its meetings, will go into effect in January 2015 and will increase the importance of each ECB meeting. As of writing, the central bank is debating a possible sovereign QE program to combat entrenched deflationary pressures, so traders should keep a close eye on the central bank’s meetings for potentially big monetary policy changes in 2015. June 17 – Federal Reserve Monetary Policy Meeting, Summary of Economic Projections and Press Conference Over the past couple of years, the Fed has reserved major monetary policy meetings for its quarterly meetings that also feature the release of the central bank’s Summary of Economic Projections (including the so-called “dot chart”) and press conferences so it can fully explain the decision. This year, these supercharged Fed meetings take place in March, June, September, and December, so readers should be prepared for a possible spike in volatility around those releases as traders look for more insight from the notoriously inscrutable central bank. As we go to press, futures markets are pricing in an interest rate hike by the Federal Reserve midway through 2015, but that expectation will undoubtedly fluctuate based on incoming economic data. July 16 – European Central Bank Meeting and Press Conference Back in July of last year, the ECB surprised traders by opting to change its meeting frequency to every six weeks, like the Fed, instead of its previous schedule of every four weeks. This change, along with the decision to start publishing the minutes from its meetings, will go into effect in January 2015 and will increase the importance of each ECB meeting. As of writing, the central bank is debating a possible sovereign QE program to combat entrenched deflationary pressures, so traders should keep a close eye on the central bank’s meetings for potentially big monetary policy changes in 2015. August 12 – Bank of England Quarterly Inflation Report While the regular rank-and-file Bank of England meetings have hardly been exciting over the last few years, the central bank’s Quarterly Inflation Reports have been far more informative for traders. The BOE typically uses this publication to outline its longer-term views for the UK economy and monetary policy. With inflation at a low (and falling) level heading into 2015, traders will eagerly devour these reports for hints about economic expectations and any potential changes to monetary policy. September 3 – European Central Bank Meeting and Press Conference Back in July of last year, the ECB surprised traders by opting to change its meeting frequency to every six weeks, like the Fed, instead of its previous schedule of every four weeks. This change, along with the decision to start publishing the minutes from its meetings, will go into effect in January 2015 and will increase the importance of each ECB
  • 39. Our services include products that are traded on margin and carry a risk that you can lose more than your initial deposit. © 2014 FOREX.com 39 meeting. As of writing, the central bank is debating a possible sovereign QE program to combat entrenched deflationary pressures, so traders should keep a close eye on the central bank’s meetings for potentially big monetary policy changes in 2015. September 17 – Federal Reserve Monetary Policy Meeting, Summary of Economic Projections and Press Conference Over the past couple of years, the Fed has reserved major monetary policy meetings for its quarterly meetings that also feature the release of the central bank’s Summary of Economic Projections (including the so-called “dot chart”) and press conferences so it can fully explain the decision. This year, these supercharged Fed meetings take place in March, June, September, and December, so readers should be prepared for a possible spike in volatility around those releases as traders look for more insight from the notoriously inscrutable central bank. As we go to press, futures markets are pricing in an interest rate hike by the Federal Reserve midway through 2015, but that expectation will undoubtedly fluctuate based on incoming economic data. October 19 – Canadian Federal Election October 22 – European Central Bank Meeting and Press Conference Back in July of last year, the ECB surprised traders by opting to change its meeting frequency to every six weeks, like the Fed, instead of its previous schedule of every four weeks. This change, along with the decision to start publishing the minutes from its meetings, will go into effect in January 2015 and will increase the importance of each ECB meeting. As of writing, the central bank is debating a possible sovereign QE program to combat entrenched deflationary pressures, so traders should keep a close eye on the central bank’s meetings for potentially big monetary policy changes in 2015. November 11 – Bank of England Quarterly Inflation Report While the regular rank-and-file Bank of England meetings have hardly been exciting over the last few years, the central bank’s Quarterly Inflation Reports have been far more informative for traders. The BOE typically uses this publication to outline its longer-term views for the UK economy and monetary policy. With inflation at a low (and falling) level heading into 2015, traders will eagerly devour these reports for hints about economic expectations and any potential changes to monetary policy. December 3 – European Central Bank Meeting and Press Conference Back in July of last year, the ECB surprised traders by opting to change its meeting frequency to every six weeks, like the Fed, instead of its previous schedule of every four weeks. This change, along with the decision to start publishing the minutes from its meetings, will go into effect in January 2015 and will increase the importance of each ECB meeting. As of writing, the central bank is debating a possible sovereign QE program to combat entrenched deflationary pressures, so traders should keep a close eye on the central bank’s meetings for potentially big monetary policy changes in 2015.
  • 40. Our services include products that are traded on margin and carry a risk that you can lose more than your initial deposit. © 2014 FOREX.com 40 December 16 – Federal Reserve Monetary Policy Meeting, Summary of Economic Projections and Press Conference Over the past couple of years, the Fed has reserved major monetary policy meetings for its quarterly meetings that also feature the release of the central bank’s Summary of Economic Projections (including the so-called “dot chart”) and press conferences so it can fully explain the decision. This year, these supercharged Fed meetings take place in March, June, September, and December, so readers should be prepared for a possible spike in volatility around those releases as traders look for more insight from the notoriously inscrutable central bank. As we go to press, futures markets are pricing in an interest rate hike by the Federal Reserve midway through 2015, but that expectation will undoubtedly fluctuate based on incoming economic data. No date set – Major IPOs A number of major private companies are mulling over Initial Public Offerings (IPOs) in 2015, including the UK’s Everything Everywhere mobile phone operator and Ferrari, the Italian luxury auto maker. Expect global equity markets to exhibit elevated volatility and volume on these days.
  • 41. Our services include products that are traded on margin and carry a risk that you can lose more than your initial deposit. © 2014 FOREX.com 41 9 Stocks: Galvan’s ones to watch for 2015 Our research and advisory arm, Galvan, have kindly contributed to this year’s 2015 Outlook. Here their head of research, Andrew Gibson, gives us his three ones to watch for 2015. 1, Lancashire Holdings (LRE): The secret dividend stock in the UK market It’s hard to get a decent income from investing right now. In the UK, saving accounts offer barely 1% interest and rising property and share prices have driven down yields. However, with a bit of digging you can still find some high-yield opportunities. One that’s caught our eye is Lancashire Holdings (Lancashire). Lancashire is one of the most successful specialist insurers on the London Stock Exchange. It provides insurance in areas such as property, aviation, marine, energy and terrorism. Insurance is a cyclical industry, meaning it goes through periods of rising rates and falling rates. Lancashire approaches these cycles in a disciplined way. Effectively, when rates are high, the company writes more business and when rates are low (like now), they write less. Unlike other insurers, Lancashire’s priority is profits, not growth. This can be clearly seen in its combined ratio, which measures the cost of claims relative to the premiums collected (the lower the better). Lancashire’s combined ratio over the last five years has averaged 59.2%, miles better than the 90.4% average of its peer group. Because Lancashire’s underwriting is so much more profitable, it can take a very conservative approach to investing. The majority of its premiums are invested in cash and low-risk bonds. Another important factor in Lancashire’s business model is that it has a strongly diversified portfolio with no reliance on a single source of revenue or profit. Reinsurance is also used as a way of keeping exposure limited to any particular geography or insurance class. These differentiating factors have enabled Lancashire to offer a very generous dividend policy. Each year it pays out most of its profits through dividends, via a steady regular dividend and a variable special dividend. The regular dividend has remained at 15¢ (around 10p) for the last five years, which is okay but nothing to get excited about. However, the special dividends have been huge: 110¢ in 2008, 125¢ in 2009, 140¢ in 2010, 80¢ in 2011, 195¢ in 2012 and 65¢ in 2013 and 120¢ in 2014. To put that into context, a total dividend payout of 135¢ (around 86p) in 2014 puts the shares on an astonishing yield of 13.8%. This is not a freak year either. The average dividend yield on the shares over the last five years has been more than 10%.
  • 42. Our services include products that are traded on margin and carry a risk that you can lose more than your initial deposit. © 2014 FOREX.com 42 Sure, the special dividend varies year-on-year, but it allows Lancashire to maximise the pay-out by taking into account its current needs. Interestingly, when you run a search across the FTSE for high-dividend yields, you won’t see Lancashire come up. That’s because screening software ignores special dividends. So Lancashire’s massive dividend payouts remain a bit of a secret. Overall, Lancashire is a high-quality insurer that has a good track record of paying its shareholders big dividends. As an income stock, it’s hard to argue with. 2, InternetQ (INTQ): The company that can infiltrate 300 million smartphone apps The smartphone explosion has taken the world by storm. This year the total number of users will reach 1.75 billion. That’s one in four people on the planet. For many people smartphones offer the most convenient way to access the internet. This year mobile internet traffic has overtaken PCs for the first time in history. There’s no doubt this is an incredibly lucrative market. However, manufacturing smartphones is becoming increasingly competitive, driving down costs and reducing margins. As the market evolves, investors are now looking for opportunities in the smartphone software sector, which is expanding faster than ever. InternetQ is a clever little company that’s set to profit from this boom. It has two main businesses: mobile marketing and music streaming. If you’ve ever used a smartphone app chances are you will have seen an advertisement run by MiniMob. This is a clever piece of software from InternetQ that allows developers to get paid for the apps they create. It’s already been installed over 300 million times and this figure is increasing at a rate of one to two million every day! The mobile ad market is currently worth around £12bn per year and is growing quickly. Analysts at Gartner expect it to reach £27bn by 2017. Once MiniMob has been installed on a user’s device it gains access to all kinds of data, such as what type of apps they like, when they use them etc. This information is very useful because it means ads can be targeted, increasing the number of hits and revenue. InternetQ also runs Akazoo, a mobile music-streaming business with staggering potential. This offers a service which allows subscribers paying a regular fee to access a huge collection of music. Akazoo currently boasts over 20 million tracks with over one million subscribers worldwide. Music streaming is rapidly becoming big business, which makes Akazoo a very exciting prospect. Apple recently paid a whopping $3bn for a similar business called Beats. Considering Beats only has around 250,000 subscribers this deal certainly bodes well for the value of Akazoo. There have already been some high profile partnerships with leading smartphone manufactures, including Sony and Samsung, who have agreed to pre-install Akazoo on the devices they sell. InternetQ is profitable and expanding quickly, with double-digit growth in both revenue and profit for the last three years.
  • 43. Our services include products that are traded on margin and carry a risk that you can lose more than your initial deposit. © 2014 FOREX.com 43 It looks like 2014 is on track to be another record year too. With better-than-expected results for the first nine months, InternetQ’s strongest quarter may be yet to come. New features for both MiniMob and Akazoo are scheduled for release soon and should also benefit Q4. In short, InternetQ is well-placed to gain from two of the fastest growing areas in mobile software. 3, Strat Aero Plc (AERO): Benefitting from the drone boom Unmanned aerial vehicles, or drones, are becoming big business. Mass adoption of this new technology is gathering pace as they make the transition from military use into everyday life. You may remember that Amazon made headlines all over the world when it proposed the idea that drones could deliver small packages within half an hour of a customer order. And here in the UK, Domino’s Pizza uploaded a video to YouTube of a “DomiCopter” drone flying over the countryside to deliver two pizzas. While these stories generated plenty of publicity, neither of those things is likely to happen any time soon. But what is likely is that the use of drones will rise considerably. The Federal Aviation Administration in the US has predicted that the potential market for government and commercial drones could generate “nearly $90 billion in economic activity” over the next decade. There are so many ways in which drones could be used. Examples include patrolling borders, tracking forest fires and flooded areas, monitoring volcanoes and extreme weather patterns, carrying out search-and-rescue missions and the surveillance of criminal activity and civil unrest. There are also enormous opportunities in more mundane commercial applications such as allowing farmers to monitor their land more easily and apply pesticides and fertilizers more accurately. Drones could also help the oil and gas industry, whose vast assets such as rigs, refineries and pipelines, are often in remote locations but need to be closely monitored. One of the major things holding back the global growth of drones is safety. The situation has been compared to the early stages of the car industry. The car was obviously a major technological breakthrough, but before they could become mainstream, people needed to learn how to drive. The same applies to drones. They’re only as safe as their pilots. That’s where Strat Aero comes in. Established in 2013, Strat Aero offers training and consultancy in the use and operation of drones. While its head office is based at Gatwick Airport, the company’s flagship training complex is in Roswell, New Mexico. The company also has plans to bring a training centre to Europe. Strat Aero offers both training software as well as hands-on technical training and already has a contract with one of America’s top defence firms. The company believes that one branch of the US military alone will require 750 pilots to be trained each year. Directors expect revenue of $12,750 per pilot. So there could be big money in education. The US Congress has imposed a September 2015 deadline to put in place a framework for use of drones within their National Airspace System. Once the rules and regulations are in place, the market for drones could take off exponentially. Strat Aero looks to be a company in the right place at the right time. It’s technical and operational expertise combined with its first mover advantage gives it a significant edge in an industry that looks set to soar.