This 3 page document presents information on global warming from various sources:
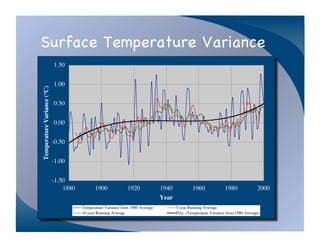
1) Surface temperature data from 1880-2010 shows warming of around 1 degree Celsius above the 1980 average.
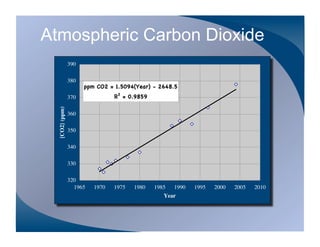
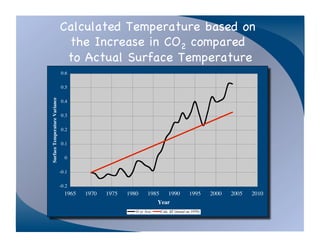
2) Atmospheric CO2 levels from 1965-2010 increased from around 320 ppm to 390 ppm, correlating with increased surface temperatures.
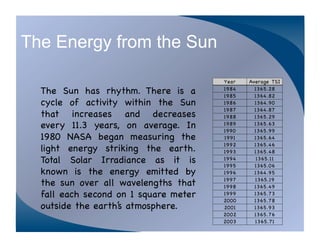
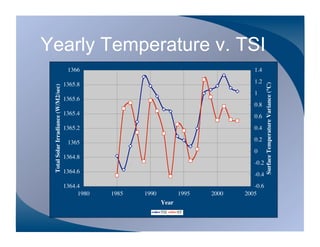
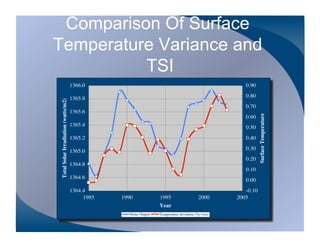
3) Total solar irradiance (TSI) measurements from 1980-2003 show little variation that would account for the observed temperature rise.

![Exposicion de practica_juridica[1]](https://cdn.slidesharecdn.com/ss_thumbnails/exposiciondepracticajuridica1-120711182915-phpapp01-thumbnail.jpg?width=640&height=640&fit=bounds)


