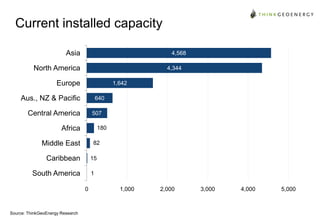
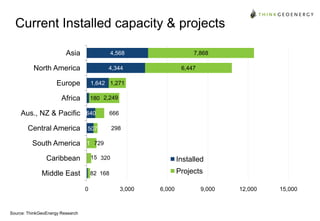
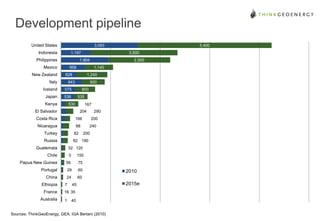
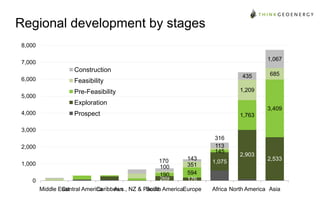
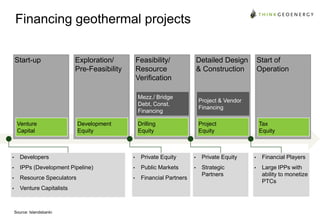
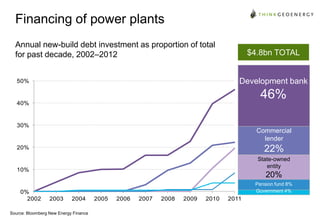
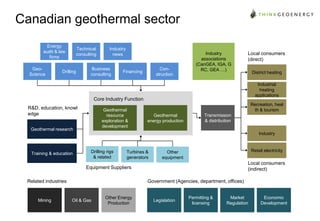
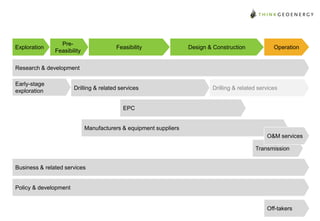
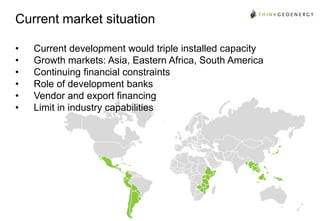
Global geothermal
development
Current status of development and outlook
Alexander Richter
ThinkGeoEnergy.com
@thinkgeoenergy

22 March 2013, CanGEA Conference, Calgary, Alberta
Overview on Status and Development

49 MW Hudson Ranch I, Salton Sea, California, U.S. – start of operation
2012
Current installed capacity
Asia

4,568

North America

4,344

Europe

1,642

Aus., NZ & Pacific

640

Central America

507

Africa

180

Middle East

82

Caribbean

15

South America

1
0

Source: ThinkGeoEnergy Research

1,000

2,000

3,000

4,000

5,000
Current Installed capacity & projects
Asia

4,568

North America

4,344

Europe

1,642 1,271

Africa

6,447

180 2,249

Aus., NZ & Pacific

640

Central America

507

South America

7,868

666

298

1 729

Caribbean

15 320

Installed

Middle East

82 168

Projects

0

Source: ThinkGeoEnergy Research

3,000

6,000

9,000

12,000

15,000
Installed, capacity & potential
Asia

70,884

North America

32,209

South America

30,780

Caribbean

15,065

Africa

11,571

Central America

12,405

Installed

Aus., NZ & Pacific

7,694

Europe

3,406

Additional Potential

2,551

Middle East
0

Source: ThinkGeoEnergy Research

Projects

15,000

30,000

45,000

60,000

75,000

90,000
Global Geothermal Energy Power Generation - Potential

32,200

Installed power generation capacity, projects/ inferred resources 3,400
& resource estimates
1,642

1,271

4,344
6,447
Installed

Installed

Resources
70,884

Europe

Resources

North America
2,550

82
27,400

168

Installed

Resources

Middle East
522
Installed

Resources

4,568

618

7,868
Installed

Asia

Cent. America &
Caribbean

11,600

30,800
180
1

Installed
High temperature regions

Resources

730
Resources

South America

2,249

Installed

7,700

Resources

Africa

640

666

Installed

Resources

Aus., NZ & Pacific

Current installed capacity
Projects & inferred resources
Resource estimates

Sources: Islandsbanki, ThinkGeoEnergy, Geothermal Energy Association, IGA, Chevron
Note: Installed Capacity of 2010 (2012), resource estimates combined (1999-2012) – IGA estimates a conservative total potential of 70,000 MW
and with technology improvements (extended use of low heat and EGS resources) at around 140,000 MW in power generation capacity.
Development pipeline
United States

3,093

Indonesia

1,197

Philippines

New Zealand

3,500

1,904

Mexico

2,500

958

1,140

628

Italy

1,240

843

Iceland

920

575

Japan

536

Kenya

5,400

800
535

530

167

El Salvador

204

Costa Rica

166

Nicaragua

88

290
200
240

Turkey

82

Russia

82 190

Guatemala

200

52 120

Chile

0

150

Papua New Guinea

56

75

Portugal

29

60

China

24

60

Ethiopia
France
Australia

7

45

16 35
1

40

Sources: ThinkGeoEnergy, GEA, IGA Bertani (2010)

2010
2015e
Development stages
Mauerstetten, Germany – dry well/ potential EGS
project
Development stages
Year 1
Start-up

•
•
•

Year 2

•
•

Year 4

Year 5

Year 6

Year 7 …

Exploration
PreFeasibility

Legal Work
Concession
Permitting

•

Year 3

Feasibility
Design & Construction

Geophysical surveys
Geochemical and geological
data collection & analysis
Temperature gradient drilling

•
•

Operation

Focused Exploration on most
favorable resource area
Sufficient Exploration data
collected & analyzed

•

•
•

•
•

Drilling of first successful, full-sized
production well.
Confirmation Wells, Reserve Estimates
& Preliminary Design

Drilling & testing of
remaining production and
injection wells
Civil works required
Final design & testing
Global development by stages
8,000
7,000

7,222
6,508

6,000
5,000
4,000
3,000

2,862
2,423

2,000
1,000

891

110

0
Prospect

Source: ThinkGeoEnergy Research

Exploration

Pre-Feasibility

Feasibility

Construction

Other*
Regional development by stages
8,000
1,067

7,000

Construction
6,000
5,000

435

Feasibility

685

1,209

Pre-Feasibility
Exploration

4,000

3,409

Prospect

1,763

3,000
316
113
145

2,000
1,000
0

170
100
190
269

143
351
594
176

Middle East
Central America
Caribbean NZ & Pacific AmericaEurope
Aus.,
South

1,075

2,903

2,533

Africa North America Asia
Current financial
situation

Solok, West Java, Indonesia
Financing geothermal projects
Start-up

Exploration/
Pre-Feasibility

Feasibility/
Resource
Verification

Detailed Design
& Construction

Mezz./ Bridge
Debt, Const.
Financing
Venture
Capital

Project & Vendor
Financing

Drilling
Equity

Development
Equity

Start of
Operation

Project
Equity

Tax
Equity

•

Developers

•

Private Equity

•

Private Equity

•

Financial Players

•

IPPs (Development Pipeline)

•

Public Markets

•

•

•

Resource Speculators

•

Financial Partners

Strategic
Partners

Large IPPs with
ability to monetize
PTCs

•

Venture Capitalists

Source: Islandsbanki
Financing of power plants
Annual new-build debt investment as proportion of total
for past decade, 2002–2012

$4.8bn TOTAL

%

Development bank

50%

%

%

%

%

46%

40%

30%

Commercial
lender

22%

20%

State-owned
entity

10%

0%
2002

20%
Pension fund 8%
Government 4%

2003

2004

2005

2006

2007

2008

2009

2010

2011

%
2002 2003 2004 2005 2006 2007 2008 2009 2010 2011 2012
Source: Bloomberg New Energy Finance
Opportunities for Canadians
12.5 MW San Emidio
plant, Nevada, U.S.
Canadian Geothermal
Supply Chain
Canadian Geothermal Power &
Direct Use of Heat Technology
Roadmap and Deployment
Framework
Canadian geothermal sector
Energy
audit & law
firms
GeoScience

Technical
consulting

Drilling

Industry
news

Business
consulting

Construction

Financing

Industry
associations
(CanGEA, IGA, G
RC, GEA …)

Local consumers
(direct)
District heating
Industrial
heating
applications

Core Industry Function
R&D, education, knowl
edge

Geothermal
resource
exploration &
development

Geothermal research

Recreation, heal
th & tourism
Geothermal
energy production

Transmission
& distribution
Industry

Training & education

Drilling rigs
& related

Turbines &
generators

Retail electricity

Other
equipment

Local consumers
(indirect)

Equipment Suppliers
Related industries

Mining

Government (Agencies, department, offices)

Oil & Gas

Other Energy
Production

Legislation

Permitting &
licensing

Market
Regulation

Economic
Development
Exploration

PreFeasibility

Feasibility

Design & Construction

Operation

Research & development
Early-stage
exploration

Drilling & related services

Drilling & related services

EPC

Manufacturers & equipment suppliers
O&M services

Transmission
Business & related services

Policy & development

Off-takers
Canadian Case Study: Polaris/
Nicaragua
72 MW San Jacinto-Tizate plant, Nicaragua
2003

Incorporation and listing on TSX (GEO)

2007

Installation of initial 10 MW at San Jacinto-Tizate/
Nicaragua

2009

Start of Phase I construction
Merger of Polaris, Western GeoPower and Ram Power
(RPG)

20092011

Debt financing raised US$309.5m ($149.5 + $160m)

2011

Commercial operation of 36 MW Phase I expansion

2013

Commercial operation of 36 MW Phase II expansion
72 MW San Jacinto-Tizate Geothermal Plant
= 8% of Nicaragua’s installed capacity
Current market situation
•
•
•
•
•
•

Current development would triple installed capacity
Growth markets: Asia, Eastern Africa, South America
Continuing financial constraints
Role of development banks
Vendor and export financing
Limit in industry capabilities
Canadian opportunities

Investment
/ Finance
Development

Service
s

Education

Technology/
Supply
• Global news
• Job Portal
• Geothermal Power
Plant Map
• Social media
• iPhone app
• Free pictures
• Services

www.
ThinkGeoEnergy.
com
Contact

Alexander Richter

ThinkGeoEnergy.com
alex@thinkgeoenergy.com
Follow me:
Twitter: @thinkgeoenergy
LinkedIn Group: ThinkGeoEnergy
Flickr.com/thinkgeoenergy
YouTube.com/thinkgeoenergy
Slideshare.com/thinkgeoenergy

Global Geothermal Development, CanGEA Conference, March 2013

  • 1.
    Global geothermal development Current statusof development and outlook Alexander Richter ThinkGeoEnergy.com @thinkgeoenergy 22 March 2013, CanGEA Conference, Calgary, Alberta
  • 2.
    Overview on Statusand Development 49 MW Hudson Ranch I, Salton Sea, California, U.S. – start of operation 2012
  • 3.
    Current installed capacity Asia 4,568 NorthAmerica 4,344 Europe 1,642 Aus., NZ & Pacific 640 Central America 507 Africa 180 Middle East 82 Caribbean 15 South America 1 0 Source: ThinkGeoEnergy Research 1,000 2,000 3,000 4,000 5,000
  • 4.
    Current Installed capacity& projects Asia 4,568 North America 4,344 Europe 1,642 1,271 Africa 6,447 180 2,249 Aus., NZ & Pacific 640 Central America 507 South America 7,868 666 298 1 729 Caribbean 15 320 Installed Middle East 82 168 Projects 0 Source: ThinkGeoEnergy Research 3,000 6,000 9,000 12,000 15,000
  • 5.
    Installed, capacity &potential Asia 70,884 North America 32,209 South America 30,780 Caribbean 15,065 Africa 11,571 Central America 12,405 Installed Aus., NZ & Pacific 7,694 Europe 3,406 Additional Potential 2,551 Middle East 0 Source: ThinkGeoEnergy Research Projects 15,000 30,000 45,000 60,000 75,000 90,000
  • 6.
    Global Geothermal EnergyPower Generation - Potential 32,200 Installed power generation capacity, projects/ inferred resources 3,400 & resource estimates 1,642 1,271 4,344 6,447 Installed Installed Resources 70,884 Europe Resources North America 2,550 82 27,400 168 Installed Resources Middle East 522 Installed Resources 4,568 618 7,868 Installed Asia Cent. America & Caribbean 11,600 30,800 180 1 Installed High temperature regions Resources 730 Resources South America 2,249 Installed 7,700 Resources Africa 640 666 Installed Resources Aus., NZ & Pacific Current installed capacity Projects & inferred resources Resource estimates Sources: Islandsbanki, ThinkGeoEnergy, Geothermal Energy Association, IGA, Chevron Note: Installed Capacity of 2010 (2012), resource estimates combined (1999-2012) – IGA estimates a conservative total potential of 70,000 MW and with technology improvements (extended use of low heat and EGS resources) at around 140,000 MW in power generation capacity.
  • 7.
    Development pipeline United States 3,093 Indonesia 1,197 Philippines NewZealand 3,500 1,904 Mexico 2,500 958 1,140 628 Italy 1,240 843 Iceland 920 575 Japan 536 Kenya 5,400 800 535 530 167 El Salvador 204 Costa Rica 166 Nicaragua 88 290 200 240 Turkey 82 Russia 82 190 Guatemala 200 52 120 Chile 0 150 Papua New Guinea 56 75 Portugal 29 60 China 24 60 Ethiopia France Australia 7 45 16 35 1 40 Sources: ThinkGeoEnergy, GEA, IGA Bertani (2010) 2010 2015e
  • 8.
    Development stages Mauerstetten, Germany– dry well/ potential EGS project
  • 9.
    Development stages Year 1 Start-up • • • Year2 • • Year 4 Year 5 Year 6 Year 7 … Exploration PreFeasibility Legal Work Concession Permitting • Year 3 Feasibility Design & Construction Geophysical surveys Geochemical and geological data collection & analysis Temperature gradient drilling • • Operation Focused Exploration on most favorable resource area Sufficient Exploration data collected & analyzed • • • • • Drilling of first successful, full-sized production well. Confirmation Wells, Reserve Estimates & Preliminary Design Drilling & testing of remaining production and injection wells Civil works required Final design & testing
  • 10.
    Global development bystages 8,000 7,000 7,222 6,508 6,000 5,000 4,000 3,000 2,862 2,423 2,000 1,000 891 110 0 Prospect Source: ThinkGeoEnergy Research Exploration Pre-Feasibility Feasibility Construction Other*
  • 11.
    Regional development bystages 8,000 1,067 7,000 Construction 6,000 5,000 435 Feasibility 685 1,209 Pre-Feasibility Exploration 4,000 3,409 Prospect 1,763 3,000 316 113 145 2,000 1,000 0 170 100 190 269 143 351 594 176 Middle East Central America Caribbean NZ & Pacific AmericaEurope Aus., South 1,075 2,903 2,533 Africa North America Asia
  • 12.
  • 13.
    Financing geothermal projects Start-up Exploration/ Pre-Feasibility Feasibility/ Resource Verification DetailedDesign & Construction Mezz./ Bridge Debt, Const. Financing Venture Capital Project & Vendor Financing Drilling Equity Development Equity Start of Operation Project Equity Tax Equity • Developers • Private Equity • Private Equity • Financial Players • IPPs (Development Pipeline) • Public Markets • • • Resource Speculators • Financial Partners Strategic Partners Large IPPs with ability to monetize PTCs • Venture Capitalists Source: Islandsbanki
  • 14.
    Financing of powerplants Annual new-build debt investment as proportion of total for past decade, 2002–2012 $4.8bn TOTAL % Development bank 50% % % % % 46% 40% 30% Commercial lender 22% 20% State-owned entity 10% 0% 2002 20% Pension fund 8% Government 4% 2003 2004 2005 2006 2007 2008 2009 2010 2011 % 2002 2003 2004 2005 2006 2007 2008 2009 2010 2011 2012 Source: Bloomberg New Energy Finance
  • 15.
    Opportunities for Canadians 12.5MW San Emidio plant, Nevada, U.S.
  • 16.
    Canadian Geothermal Supply Chain CanadianGeothermal Power & Direct Use of Heat Technology Roadmap and Deployment Framework
  • 17.
    Canadian geothermal sector Energy audit& law firms GeoScience Technical consulting Drilling Industry news Business consulting Construction Financing Industry associations (CanGEA, IGA, G RC, GEA …) Local consumers (direct) District heating Industrial heating applications Core Industry Function R&D, education, knowl edge Geothermal resource exploration & development Geothermal research Recreation, heal th & tourism Geothermal energy production Transmission & distribution Industry Training & education Drilling rigs & related Turbines & generators Retail electricity Other equipment Local consumers (indirect) Equipment Suppliers Related industries Mining Government (Agencies, department, offices) Oil & Gas Other Energy Production Legislation Permitting & licensing Market Regulation Economic Development
  • 18.
    Exploration PreFeasibility Feasibility Design & Construction Operation Research& development Early-stage exploration Drilling & related services Drilling & related services EPC Manufacturers & equipment suppliers O&M services Transmission Business & related services Policy & development Off-takers
  • 19.
    Canadian Case Study:Polaris/ Nicaragua 72 MW San Jacinto-Tizate plant, Nicaragua
  • 20.
    2003 Incorporation and listingon TSX (GEO) 2007 Installation of initial 10 MW at San Jacinto-Tizate/ Nicaragua 2009 Start of Phase I construction Merger of Polaris, Western GeoPower and Ram Power (RPG) 20092011 Debt financing raised US$309.5m ($149.5 + $160m) 2011 Commercial operation of 36 MW Phase I expansion 2013 Commercial operation of 36 MW Phase II expansion
  • 21.
    72 MW SanJacinto-Tizate Geothermal Plant = 8% of Nicaragua’s installed capacity
  • 22.
    Current market situation • • • • • • Currentdevelopment would triple installed capacity Growth markets: Asia, Eastern Africa, South America Continuing financial constraints Role of development banks Vendor and export financing Limit in industry capabilities
  • 23.
  • 24.
    • Global news •Job Portal • Geothermal Power Plant Map • Social media • iPhone app • Free pictures • Services www. ThinkGeoEnergy. com
  • 25.
    Contact Alexander Richter ThinkGeoEnergy.com alex@thinkgeoenergy.com Follow me: Twitter:@thinkgeoenergy LinkedIn Group: ThinkGeoEnergy Flickr.com/thinkgeoenergy YouTube.com/thinkgeoenergy Slideshare.com/thinkgeoenergy