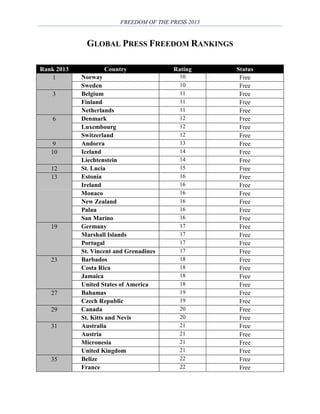
The document presents global press freedom rankings for 2013 published by Freedom House. It ranks 197 countries and territories based on their level of press freedom, categorizing them as Free, Partly Free, or Not Free. The Nordic countries had the most press freedom, while Turkmenistan, North Korea and Eritrea had the least. By region, Western Europe had the highest percentage of Free countries while the Middle East/North Africa had the highest percentage of Not Free.
This document is the 2014 Legatum Prosperity Index which ranks 142 countries based on their level of prosperity. It includes an overview section highlighting some key global trends over the past 6 years related to democracy, health, and education. The main body provides the rankings of countries across 8 sub-indices of the overall prosperity measure as well as an overall ranking. Top-ranked countries tend to be wealthy Western democracies while bottom-ranked countries face challenges related to poverty, governance, health, and conflict.
The Corruption Perceptions Index 2013 ranks 177 countries and territories based on perceived levels of public sector corruption. Nearly 70% of countries score below 50, indicating a serious corruption problem. The index finds that while some countries perform well, achieving a perfect score of 100, no country is completely free of corruption. Countries in Sub-Saharan Africa and Eastern Europe/Central Asia generally scored the lowest, with over 90% and 84% of countries respectively perceived as having high corruption levels.
This document presents a ranking of countries based on the visa-free access provided by their passports. Japan ranks first with a score of 189. Germany and Denmark rank second and third with scores of 188 and 187 respectively. The bottom countries include Afghanistan and Iraq which share the rank of 104th with a score of 30. The graph shows the full global ranking of passports according to the 2019 Henley Passport Index.
This document presents a ranking of 176 countries and territories based on their scores on the 2012 Corruption Perceptions Index, which measures the perceived levels of public sector corruption. Denmark, Finland, and New Zealand scored highest with 90 points, indicating very clean governance, while Afghanistan, North Korea, and Somalia scored lowest with 8 points, indicating highly corrupt governance. Most countries scored between 40-49 points.
The index, which ranks 180 countries and territories by their perceived levels of public sector corruption according to experts and businesspeople, uses a scale of 0 to 100, where 0 is highly corrupt and 100 is very clean. More than two-thirds of countries score below 50 on this year’s CPI, with an average score of just 43.
It reveals that the continued failure of most countries to significantly control corruption is contributing to a crisis in democracy around the world. While there are exceptions, the data shows that despite some progress, most countries are failing to make serious inroads against corruption.
This document summarizes data from the 2018 Henley Passport Index, which ranks countries based on the number of destinations their passport holders can access without a prior visa. It provides details on the top and bottom ranked countries as well as the biggest climbers from 2017 to 2018. It also lists several countries with citizenship-by-investment programs and their respective passport rankings.
The document presents rankings from the Global Innovation Index 2019. Switzerland ranked first overall. The top countries were generally high-income countries from Europe and North America. Singapore ranked first for innovation input and Switzerland ranked second overall and first for Europe. The rankings show innovation performance based on scores from 0 to 100 across over 100 countries.
Palestra que faz parte do programa Mindset Global, onde de cobrimos as principais razões as empresas brasileiras não internacionalizam e incentivamos a criação de micromultinacionais.
The document is the 2014 Corruption Perceptions Index report published by Transparency International. It measures perceived levels of public sector corruption in 175 countries/territories and finds that over two-thirds score below 50/100, indicating widespread corruption issues globally. Specific country and regional data is provided, with Denmark ranked the least corrupt country and North Korea and Somalia tied as the most corrupt.
This document outlines the presentation given by Zafar Mirza on SDGs and health in the Eastern Mediterranean Region. It discusses regional engagement on SDGs at global and national levels. It shows that while progress was made on MDGs, more work is needed to achieve the SDGs. It highlights country initiatives on SDGs and establishing coordination mechanisms. The way forward includes establishing an SDGs network, a regional action agenda, capacity building activities, and monitoring SDG progress.
The document describes the Legatum Prosperity Index, which ranks 149 countries based on their performance across 9 pillars of prosperity: economic quality, business environment, governance, personal freedom, social capital, safety and security, education, health, and natural environment. It provides the 2017 rankings and scores for each country on the 9 pillars. Norway ranked first overall in 2017 based on its strong performance across all pillars.
Toluna is one of the world’s leading online panel and survey-technology providers. With 18 offices in Europe, North America and Asia Pacific, we work with many of the world’s leading market-research agencies, media agencies, and corporations. Through the years, Toluna has built and nurtured one of the largest and most diverse qualified online panels in the world. Our proprietary panel-recruitment methods, profiling technologies and sample management techniques yield access to more than 9 million respondents from 49 countries.
We also offer as many as 750 data points on each panelist, thereby enabling companies to interview many reach hard-to-reach audiences with ease and efficiency.
Toluna is a leading provider of digital consumer insights, and empowers companies to brainstorm ideas, uncover new business opportunities and answer their questions in real-time. Toluna is transforming the way marketing decisions are made by bringing consumers and brands together via the world’s largest social voting community of nine million members across 49 countries. This real-time access to consumers is coupled with its state-of-the-art, market research survey and analytics platform. Toluna has 18 offices in Europe, North America and Asia Pacific. For more information, please visit http://www.toluna-group.com/
This document presents rankings of countries and economies based on their scores in the Global Innovation Index 2017. Switzerland has the highest overall score of 67.69 and ranks first. The rankings are broken down by income group, region, and the efficiency ratio score. The table also shows the median efficiency ratio score.
This document provides demographic information about Toluna's online consumer panels in various countries around the world. It summarizes that Toluna has a global panel of over 10 million members across 59 countries. The panel is divided among regions, with over 3 million members in EMEA, 1.5 million in South America, 3 million in EMEA, and 3 million in APAC. It then provides more detailed breakdowns of panel size, languages, device usage and demographic information for panels in specific countries in the Americas, EMEA and APAC regions.
This document presents survey data from the Pew Research Center's 2002 Global Attitudes Survey. It includes responses from people in various regions (e.g. North America, Latin America, Europe) to questions about their current and future life satisfaction, as well as their views on whether their personal situation has improved or declined over the past 5 years. The data is shown in percentages and is broken out by country or region.
The document provides demographic information about Toluna panel members in various countries in Asia Pacific (APAC). It includes data on age, gender, geographic region, household income, panel size, language, and smartphone penetration for Australia (113,000 members), China (1,455,000 members), Hong Kong (100,000 members), India (150,000 members), Indonesia (117,000 members), Japan (210,000 members), and South Korea (245,000 members). The document indicates that Toluna has a total of over 10 million panel members globally, with approximately 3 million members each in Europe, the Middle East, and Africa, as well as Asia Pacific and the Americas.
The document summarizes a project to expand mobile banking and remittances in rural Georgia. Key achievements include establishing a regulatory framework, defining mobile finance services, creating an ecosystem with private sector investment, and facilitating affordable international money transfers. This is expected to increase financial inclusion, access to savings and loans including for agriculture, which can boost farm production. Success factors include funding from IFAD, a business-friendly regulatory environment, strong private sector partnerships, and available technology solutions. New products are emerging from financial institutions tailored for migrants and their families.
Recorded on Thursday, March 22, 2012. This webinar reviews basic immigration terms and pointers for women who are not Canadian citizens and whose status may be affected by their partner and the breakdown of their relationship. Discussion will cover understanding immigration status, getting control of the immigration file, and where to look for help. Presenters are Tamar Witelson, Legal Director at The Metropolitan Action Committee on Violence Against Women and Children (METRAC) and Raoul Boulakia, a lawyer and certified specialist in Immigration, Refugee and Citizenship law. The presentation slides included below address all the topics covered in the webinar plus a section on How to Find Help.
Please note that this webinar is part one of a two part series. For more information see Immigration, Women, and Children: Part II – Sample Situations.
To watch an archived version of this webinar visit:
http://yourlegalrights.on.ca/webinar/Immigration-Women-and-Children-Part-I-Basic-Concepts
Dokumen ini memberikan panduan untuk menginstal aplikasi mobile, mengatur profil pengguna, dan mengatur program i-THINK untuk pelajar. Termasuk langkah-langkah untuk menubuhkan jawatankuasa, membuat pelan tindakan sekolah, dan menghantar laporan pelaksanaan program.
Adrian Grace, Aegon UK CEO and Clare Bousfield, Aegon UK CFO provide analysts with an update on Aegon UK's performance, strategy and the challenges and opportunities facing the company.
The Corruption Perceptions Index 2013 report by Transparency International summarizes corruption levels in 177 countries based on expert opinions. No country received a perfect score of 100, indicating completely clean government. Over two-thirds of countries scored below 50, suggesting high levels of public sector corruption. While a few countries performed well, widespread corruption remains a major global problem according to the index.
The document presents the Corruption Perceptions Index (CPI) scores for 176 countries and territories for the year 2012. The CPI scores countries on a scale of 0 to 100, with 0 indicating highest perceived levels of public sector corruption and 100 indicating lowest perceived levels. New Zealand, Singapore, and Denmark scored highest with 90, while Somalia scored lowest with 8. The CPI aggregates data from 13 independent sources that measure corruption.
The document is the 2013 Corruption Perceptions Index report from Transparency International. It summarizes that the report ranks 177 countries based on perceived levels of public sector corruption, with scores ranging from 0 (highly corrupt) to 100 (very clean). Over two-thirds of the countries scored below 50, indicating a serious corruption problem around the world, with no country receiving a perfect score. The report provides data and rankings to measure and raise awareness about the global corruption problem.
The document provides an overview and analysis of the 2015 Legatum Prosperity Index. Some key findings include:
- Singapore climbed to first place in the Economy sub-index, driven by improvements in its economy and entrepreneurship.
- Indonesia stands out as the top performer overall, climbing 21 places over seven years due to gains in its economy and entrepreneurship.
- Safety and security declined significantly in Africa and the Middle East due to violence and conflicts, while falling levels of safety also negatively impacted the US ranking.
- Nordic countries like Norway, Denmark, and Sweden typically rank highest for overall prosperity, while many developing nations rank in the lower half of the index.
The Henley Passport Index ranks all world passports according to the number of destinations their holders can access without a prior visa. The 2024 ranking lists Japan as having the most powerful passport, with access to 194 destinations visa-free. France, Germany, Singapore, and South Korea share the second place ranking with access to 193 destinations. Afghanistan has the least powerful passport, providing visa-free access to only 28 destinations. The index provides the most extensive data on global passport power and mobility over 18 years and is regularly updated.
The Henley Passport Index ranks all world passports according to the number of destinations their holders can access without a prior visa. The 2024 ranking lists Japan as having the most powerful passport, allowing entry to 194 destinations visa-free, followed by Singapore and South Korea with access to 193 countries. The index provides the most extensive data on global passport power and mobility, having tracked passport rankings over 18 years.
The document is a summary of the 2014 Corruption Perceptions Index published by Transparency International. It finds that over two-thirds of countries score below 50 on a scale from 0 (highly corrupt) to 100 (very clean), and no country receives a perfect score. Countries at the top and bottom of the index are identified, with Denmark scoring highest at 92 and Somalia and North Korea tied at the bottom with scores of 8. Regional averages are also provided.
This document discusses literacy rates in the United States and around the world. [1] The US ranks 21st in literacy, with about 42-50 million adults reading at a 5th grade level or below. [2] Literacy levels vary significantly between states and between urban and rural areas. [3] Internationally, the top five most literate countries are Georgia, Cuba, Estonia, Latvia, and Barbados, with literacy rates at or above 99%.
Mortality Rate of The World and Malaysia 2013Mathan Mohan
The document lists the mortality rates (deaths per 1,000 population) of various countries around the world from 2000 to 2012. For Malaysia specifically, the mortality rate decreased from 5.25 in 2000 to 4.95 in 2012.
Michael Green on the Social Progress Index at Business in the Community Irelandsocprog
On May 11, 2017 CEO of the Social Progress Imperative Michael Green joined CEOs and Managing Directors of BITC’s member companies to explore why economic growth, measured as GDP, is failing as an accurate predictor of a nation’s progress, and assess the business implications, together with what new measures will support Irish business to thrive in the long term. Learn more at http://socialprogressimperative.org
The document presents rankings of 148 countries and economies from the Global Competitiveness Report 2013-2014. Switzerland ranked first with a score of 5.67. Singapore and Finland ranked second and third respectively. The United States ranked fifth with a score of 5.48. The rankings are based on an assessment of factors contributing to long-term prosperity.
Pendapatan Perkapita negara-negara di duniaAndina Tasya
The document lists 186 countries with their per capita income in US dollars for the year 2013. It includes the country name, country number, and per capita income. Per capita incomes range from $589 in Zimbabwe to $105,091 in Qatar.
This document contains a table listing countries, their capitals, and the latitude and longitude coordinates of each capital. There are over 200 entries in the table providing information on the political geography of nations around the world. The table includes the country name, its capital city, and the precise latitude and longitude coordinates for each capital.
The document summarizes the results of the 2021 ISO survey, reporting that as of December 31, 2021 there were 58,687 valid ISO 27001 information security certificates covering 99,755 sites globally. It provides breakdowns of the number of certificates and sites by country and sector. The countries with the most ISO 27001 certificates are China, Japan, the United Kingdom, India, and Italy. The sector with the most certificates is information technology.
The document summarizes the results of the 2021 ISO survey on ISO 27001 information security management system certificates. It found that as of December 31, 2021 there were 58,687 valid ISO 27001 certificates covering 99,755 sites globally, with the top three countries being China, Japan, and the United Kingdom. The industries with the most certificates were information technology, transport/storage/communication, and other services.
The document presents rankings of 144 countries from the Global Competitiveness Index 2014-2015. Switzerland ranks first with a score of 5.7. Singapore and the United States rank second and third respectively. The rankings are broken down across pillars of basic requirements, efficiency enhancers, and innovation/sophistication factors.
Hong Kong ranks number 7 in the world, despite not having a proper innovation ecosystem. Hong Kong's low "Innovation Efficiency Ratio" ranking of 109th (out of 142 countries/territories) is total mismatch to its top "Input Sub-index" of 2nd in the world.
The document summarizes the results of the 2022 ISO Survey, which estimates the number of valid ISO management system certificates as of December 31, 2022. It finds that ISO 27001 certificates increased by 22% in 2022 to a total of 71,549 certificates covering 120,128 sites. The top countries for ISO 27001 certificates are China, Japan, the United Kingdom, India, and Italy. The largest sectors covered are information technology, transport/storage/communication, and other services.
SunHouse Team - DMC в замечательную высокогорную Киргизию! Welcome to Kyrgyzstan! We are SunHouse Team - Destination Management Company in Kyrgyzstan and Kazakhstan
Презентация о деятельности Международной Организации по Миграции в Кыргызской Республике. Особое внимание в презентации уделено проблеме торговли людьми.
The document discusses human rights practices in Kyrgyzstan and Central Asia. It covers Kyrgyzstan's 1993 constitution that prioritized individual interests, power usurpations from 1994 to 2003, civil society development, changes of government in 2005 and 2010 that did not improve human rights, issues of ochlocracy and nationalism, the need for judicial reform due to unfair courts, and the roles of freedom and social networks in discussing reforms. The author concludes by thanking the audience and providing contact information.
The document summarizes IOM activities to enhance counter-trafficking cooperation in Central Asia through regional dialogues and national programs. Specifically:
1) IOM and Kazakhstan's General Prosecutor's Office hosted a regional counter-trafficking dialogue in Astana to strengthen cooperation among Central Asian law enforcement and NGOs working to combat trafficking and protect victims.
2) IOM Kazakhstan provided trainings to labor inspectors and migration police in three regions to increase awareness of trafficking and identification of foreign victims of labor trafficking.
3) A counter-trafficking hotline was launched in a village in Kyrgyzstan's Naryn Oblast to provide direct assistance to victims and identify 8 victims
Ivanti’s Patch Tuesday breakdown goes beyond patching your applications and brings you the intelligence and guidance needed to prioritize where to focus your attention first. Catch early analysis on our Ivanti blog, then join industry expert Chris Goettl for the Patch Tuesday Webinar Event. There we’ll do a deep dive into each of the bulletins and give guidance on the risks associated with the newly-identified vulnerabilities.
Have you ever been confused by the myriad of choices offered by AWS for hosting a website or an API?
Lambda, Elastic Beanstalk, Lightsail, Amplify, S3 (and more!) can each host websites + APIs. But which one should we choose?
Which one is cheapest? Which one is fastest? Which one will scale to meet our needs?
Join me in this session as we dive into each AWS hosting service to determine which one is best for your scenario and explain why!
HCL Notes und Domino Lizenzkostenreduzierung in der Welt von DLAUpanagenda
Webinar Recording: https://www.panagenda.com/webinars/hcl-notes-und-domino-lizenzkostenreduzierung-in-der-welt-von-dlau/
DLAU und die Lizenzen nach dem CCB- und CCX-Modell sind für viele in der HCL-Community seit letztem Jahr ein heißes Thema. Als Notes- oder Domino-Kunde haben Sie vielleicht mit unerwartet hohen Benutzerzahlen und Lizenzgebühren zu kämpfen. Sie fragen sich vielleicht, wie diese neue Art der Lizenzierung funktioniert und welchen Nutzen sie Ihnen bringt. Vor allem wollen Sie sicherlich Ihr Budget einhalten und Kosten sparen, wo immer möglich. Das verstehen wir und wir möchten Ihnen dabei helfen!
Wir erklären Ihnen, wie Sie häufige Konfigurationsprobleme lösen können, die dazu führen können, dass mehr Benutzer gezählt werden als nötig, und wie Sie überflüssige oder ungenutzte Konten identifizieren und entfernen können, um Geld zu sparen. Es gibt auch einige Ansätze, die zu unnötigen Ausgaben führen können, z. B. wenn ein Personendokument anstelle eines Mail-Ins für geteilte Mailboxen verwendet wird. Wir zeigen Ihnen solche Fälle und deren Lösungen. Und natürlich erklären wir Ihnen das neue Lizenzmodell.
Nehmen Sie an diesem Webinar teil, bei dem HCL-Ambassador Marc Thomas und Gastredner Franz Walder Ihnen diese neue Welt näherbringen. Es vermittelt Ihnen die Tools und das Know-how, um den Überblick zu bewahren. Sie werden in der Lage sein, Ihre Kosten durch eine optimierte Domino-Konfiguration zu reduzieren und auch in Zukunft gering zu halten.
Diese Themen werden behandelt
- Reduzierung der Lizenzkosten durch Auffinden und Beheben von Fehlkonfigurationen und überflüssigen Konten
- Wie funktionieren CCB- und CCX-Lizenzen wirklich?
- Verstehen des DLAU-Tools und wie man es am besten nutzt
- Tipps für häufige Problembereiche, wie z. B. Team-Postfächer, Funktions-/Testbenutzer usw.
- Praxisbeispiele und Best Practices zum sofortigen Umsetzen
Taking AI to the Next Level in Manufacturing.pdfssuserfac0301
Read Taking AI to the Next Level in Manufacturing to gain insights on AI adoption in the manufacturing industry, such as:
1. How quickly AI is being implemented in manufacturing.
2. Which barriers stand in the way of AI adoption.
3. How data quality and governance form the backbone of AI.
4. Organizational processes and structures that may inhibit effective AI adoption.
6. Ideas and approaches to help build your organization's AI strategy.
HCL Notes and Domino License Cost Reduction in the World of DLAUpanagenda
Webinar Recording: https://www.panagenda.com/webinars/hcl-notes-and-domino-license-cost-reduction-in-the-world-of-dlau/
The introduction of DLAU and the CCB & CCX licensing model caused quite a stir in the HCL community. As a Notes and Domino customer, you may have faced challenges with unexpected user counts and license costs. You probably have questions on how this new licensing approach works and how to benefit from it. Most importantly, you likely have budget constraints and want to save money where possible. Don’t worry, we can help with all of this!
We’ll show you how to fix common misconfigurations that cause higher-than-expected user counts, and how to identify accounts which you can deactivate to save money. There are also frequent patterns that can cause unnecessary cost, like using a person document instead of a mail-in for shared mailboxes. We’ll provide examples and solutions for those as well. And naturally we’ll explain the new licensing model.
Join HCL Ambassador Marc Thomas in this webinar with a special guest appearance from Franz Walder. It will give you the tools and know-how to stay on top of what is going on with Domino licensing. You will be able lower your cost through an optimized configuration and keep it low going forward.
These topics will be covered
- Reducing license cost by finding and fixing misconfigurations and superfluous accounts
- How do CCB and CCX licenses really work?
- Understanding the DLAU tool and how to best utilize it
- Tips for common problem areas, like team mailboxes, functional/test users, etc
- Practical examples and best practices to implement right away
Digital Banking in the Cloud: How Citizens Bank Unlocked Their MainframePrecisely
Inconsistent user experience and siloed data, high costs, and changing customer expectations – Citizens Bank was experiencing these challenges while it was attempting to deliver a superior digital banking experience for its clients. Its core banking applications run on the mainframe and Citizens was using legacy utilities to get the critical mainframe data to feed customer-facing channels, like call centers, web, and mobile. Ultimately, this led to higher operating costs (MIPS), delayed response times, and longer time to market.
Ever-changing customer expectations demand more modern digital experiences, and the bank needed to find a solution that could provide real-time data to its customer channels with low latency and operating costs. Join this session to learn how Citizens is leveraging Precisely to replicate mainframe data to its customer channels and deliver on their “modern digital bank” experiences.
Skybuffer SAM4U tool for SAP license adoptionTatiana Kojar
Manage and optimize your license adoption and consumption with SAM4U, an SAP free customer software asset management tool.
SAM4U, an SAP complimentary software asset management tool for customers, delivers a detailed and well-structured overview of license inventory and usage with a user-friendly interface. We offer a hosted, cost-effective, and performance-optimized SAM4U setup in the Skybuffer Cloud environment. You retain ownership of the system and data, while we manage the ABAP 7.58 infrastructure, ensuring fixed Total Cost of Ownership (TCO) and exceptional services through the SAP Fiori interface.
5th LF Energy Power Grid Model Meet-up SlidesDanBrown980551
5th Power Grid Model Meet-up
It is with great pleasure that we extend to you an invitation to the 5th Power Grid Model Meet-up, scheduled for 6th June 2024. This event will adopt a hybrid format, allowing participants to join us either through an online Mircosoft Teams session or in person at TU/e located at Den Dolech 2, Eindhoven, Netherlands. The meet-up will be hosted by Eindhoven University of Technology (TU/e), a research university specializing in engineering science & technology.
Power Grid Model
The global energy transition is placing new and unprecedented demands on Distribution System Operators (DSOs). Alongside upgrades to grid capacity, processes such as digitization, capacity optimization, and congestion management are becoming vital for delivering reliable services.
Power Grid Model is an open source project from Linux Foundation Energy and provides a calculation engine that is increasingly essential for DSOs. It offers a standards-based foundation enabling real-time power systems analysis, simulations of electrical power grids, and sophisticated what-if analysis. In addition, it enables in-depth studies and analysis of the electrical power grid’s behavior and performance. This comprehensive model incorporates essential factors such as power generation capacity, electrical losses, voltage levels, power flows, and system stability.
Power Grid Model is currently being applied in a wide variety of use cases, including grid planning, expansion, reliability, and congestion studies. It can also help in analyzing the impact of renewable energy integration, assessing the effects of disturbances or faults, and developing strategies for grid control and optimization.
What to expect
For the upcoming meetup we are organizing, we have an exciting lineup of activities planned:
-Insightful presentations covering two practical applications of the Power Grid Model.
-An update on the latest advancements in Power Grid -Model technology during the first and second quarters of 2024.
-An interactive brainstorming session to discuss and propose new feature requests.
-An opportunity to connect with fellow Power Grid Model enthusiasts and users.
"Choosing proper type of scaling", Olena SyrotaFwdays
Imagine an IoT processing system that is already quite mature and production-ready and for which client coverage is growing and scaling and performance aspects are life and death questions. The system has Redis, MongoDB, and stream processing based on ksqldb. In this talk, firstly, we will analyze scaling approaches and then select the proper ones for our system.
What is an RPA CoE? Session 1 – CoE VisionDianaGray10
In the first session, we will review the organization's vision and how this has an impact on the COE Structure.
Topics covered:
• The role of a steering committee
• How do the organization’s priorities determine CoE Structure?
Speaker:
Chris Bolin, Senior Intelligent Automation Architect Anika Systems
GraphRAG for Life Science to increase LLM accuracyTomaz Bratanic
GraphRAG for life science domain, where you retriever information from biomedical knowledge graphs using LLMs to increase the accuracy and performance of generated answers
For the full video of this presentation, please visit: https://www.edge-ai-vision.com/2024/06/how-axelera-ai-uses-digital-compute-in-memory-to-deliver-fast-and-energy-efficient-computer-vision-a-presentation-from-axelera-ai/
Bram Verhoef, Head of Machine Learning at Axelera AI, presents the “How Axelera AI Uses Digital Compute-in-memory to Deliver Fast and Energy-efficient Computer Vision” tutorial at the May 2024 Embedded Vision Summit.
As artificial intelligence inference transitions from cloud environments to edge locations, computer vision applications achieve heightened responsiveness, reliability and privacy. This migration, however, introduces the challenge of operating within the stringent confines of resource constraints typical at the edge, including small form factors, low energy budgets and diminished memory and computational capacities. Axelera AI addresses these challenges through an innovative approach of performing digital computations within memory itself. This technique facilitates the realization of high-performance, energy-efficient and cost-effective computer vision capabilities at the thin and thick edge, extending the frontier of what is achievable with current technologies.
In this presentation, Verhoef unveils his company’s pioneering chip technology and demonstrates its capacity to deliver exceptional frames-per-second performance across a range of standard computer vision networks typical of applications in security, surveillance and the industrial sector. This shows that advanced computer vision can be accessible and efficient, even at the very edge of our technological ecosystem.
Introduction of Cybersecurity with OSS at Code Europe 2024Hiroshi SHIBATA
I develop the Ruby programming language, RubyGems, and Bundler, which are package managers for Ruby. Today, I will introduce how to enhance the security of your application using open-source software (OSS) examples from Ruby and RubyGems.
The first topic is CVE (Common Vulnerabilities and Exposures). I have published CVEs many times. But what exactly is a CVE? I'll provide a basic understanding of CVEs and explain how to detect and handle vulnerabilities in OSS.
Next, let's discuss package managers. Package managers play a critical role in the OSS ecosystem. I'll explain how to manage library dependencies in your application.
I'll share insights into how the Ruby and RubyGems core team works to keep our ecosystem safe. By the end of this talk, you'll have a better understanding of how to safeguard your code.
Monitoring and Managing Anomaly Detection on OpenShift.pdfTosin Akinosho
Monitoring and Managing Anomaly Detection on OpenShift
Overview
Dive into the world of anomaly detection on edge devices with our comprehensive hands-on tutorial. This SlideShare presentation will guide you through the entire process, from data collection and model training to edge deployment and real-time monitoring. Perfect for those looking to implement robust anomaly detection systems on resource-constrained IoT/edge devices.
Key Topics Covered
1. Introduction to Anomaly Detection
- Understand the fundamentals of anomaly detection and its importance in identifying unusual behavior or failures in systems.
2. Understanding Edge (IoT)
- Learn about edge computing and IoT, and how they enable real-time data processing and decision-making at the source.
3. What is ArgoCD?
- Discover ArgoCD, a declarative, GitOps continuous delivery tool for Kubernetes, and its role in deploying applications on edge devices.
4. Deployment Using ArgoCD for Edge Devices
- Step-by-step guide on deploying anomaly detection models on edge devices using ArgoCD.
5. Introduction to Apache Kafka and S3
- Explore Apache Kafka for real-time data streaming and Amazon S3 for scalable storage solutions.
6. Viewing Kafka Messages in the Data Lake
- Learn how to view and analyze Kafka messages stored in a data lake for better insights.
7. What is Prometheus?
- Get to know Prometheus, an open-source monitoring and alerting toolkit, and its application in monitoring edge devices.
8. Monitoring Application Metrics with Prometheus
- Detailed instructions on setting up Prometheus to monitor the performance and health of your anomaly detection system.
9. What is Camel K?
- Introduction to Camel K, a lightweight integration framework built on Apache Camel, designed for Kubernetes.
10. Configuring Camel K Integrations for Data Pipelines
- Learn how to configure Camel K for seamless data pipeline integrations in your anomaly detection workflow.
11. What is a Jupyter Notebook?
- Overview of Jupyter Notebooks, an open-source web application for creating and sharing documents with live code, equations, visualizations, and narrative text.
12. Jupyter Notebooks with Code Examples
- Hands-on examples and code snippets in Jupyter Notebooks to help you implement and test anomaly detection models.
Monitoring and Managing Anomaly Detection on OpenShift.pdf
Global Press Freedom 2013
1. FREEDOM OF THE PRESS 2013
GLOBAL PRESS FREEDOM RANKINGS
Rank 2013 Country Rating Status
1 Norway 10 Free
Sweden 10 Free
3 Belgium 11 Free
Finland 11 Free
Netherlands 11 Free
6 Denmark 12 Free
Luxembourg 12 Free
Switzerland 12 Free
9 Andorra 13 Free
10 Iceland 14 Free
Liechtenstein 14 Free
12 St. Lucia 15 Free
13 Estonia 16 Free
Ireland 16 Free
Monaco 16 Free
New Zealand 16 Free
Palau 16 Free
San Marino 16 Free
19 Germany 17 Free
Marshall Islands 17 Free
Portugal 17 Free
St. Vincent and Grenadines 17 Free
23 Barbados 18 Free
Costa Rica 18 Free
Jamaica 18 Free
United States of America 18 Free
27 Bahamas 19 Free
Czech Republic 19 Free
29 Canada 20 Free
St. Kitts and Nevis 20 Free
31 Australia 21 Free
Austria 21 Free
Micronesia 21 Free
United Kingdom 21 Free
35 Belize 22 Free
France 22 Free
2. FREEDOM OF THE PRESS 2013
Rank 2013 Country Rating Status
Malta 22 Free
Slovakia 22 Free
39 Grenada 23 Free
40 Dominica 24 Free
Japan 24 Free
Lithuania 24 Free
Slovenia 24 Free
Suriname 24 Free
45 Cyprus 25 Free
Vanuatu 25 Free
47 Poland 26 Free
Taiwan 26 Free
Trinidad and Tobago 26 Free
Tuvalu 26 Free
Uruguay 26 Free
52 Cape Verde 27 Free
Kiribati 27 Free
Spain 27 Free
55 Ghana 28 Free
Latvia 28 Free
Nauru 28 Free
Papua New Guinea 28 Free
São Tomé and Príncipe 28 Free
Solomon Islands 28 Free
61 Samoa 29 Free
Tonga 29 Free
63 Mauritius 30 Free
64 Chile 31 Partly Free
Israel 31 Partly Free
Namibia 31 Partly Free
South Korea 31 Partly Free
68 Guyana 33 Partly Free
Italy 33 Partly Free
70 Benin 34 Partly Free
71 East Timor 35 Partly Free
Hong Kong 35 Partly Free
South Africa 35 Partly Free
74 Hungary 36 Partly Free
Montenegro 36 Partly Free
3. FREEDOM OF THE PRESS 2013
Rank 2013 Country Rating Status
Serbia 36 Partly Free
77 Bulgaria 37 Partly Free
Mongolia 37 Partly Free
79 Antigua and Barbuda 38 Partly Free
India 38 Partly Free
81 Croatia 40 Partly Free
Dominican Republic 40 Partly Free
83 Botswana 41 Partly Free
El Salvador 41 Partly Free
Greece 41 Partly Free
86 Burkina Faso 42 Partly Free
Mozambique 42 Partly Free
Romania 42 Partly Free
89 Peru 43 Partly Free
Philippines 43 Partly Free
91 Brazil 46 Partly Free
Mali 46 Partly Free
93 Mauritania 47 Partly Free
94 Bolivia 48 Partly Free
Panama 48 Partly Free
96 Albania 49 Partly Free
Bosnia and Herzegovina 49 Partly Free
Comoros 49 Partly Free
Georgia 49 Partly Free
Haiti 49 Partly Free
Indonesia 49 Partly Free
Kosovo 49 Partly Free
Lesotho 49 Partly Free
Sierra Leone 49 Partly Free
105 Niger 50 Partly Free
106 Nicaragua 51 Partly Free
Nigeria 51 Partly Free
Tanzania 51 Partly Free
109 Argentina 52 Partly Free
Senegal 52 Partly Free
112
Tunisia 52 Partly Free
112 Bangladesh 53 Partly Free
Colombia 53 Partly Free
Kenya 53 Partly Free
4. FREEDOM OF THE PRESS 2013
Rank 2013 Country Rating Status
Lebanon 53 Partly Free
Malawi 53 Partly Free
Moldova 53 Partly Free
118 Maldives 55 Partly Free
Uganda 55 Partly Free
120 Congo (Brazzaville) 56 Partly Free
Fiji 56 Partly Free
Liberia 56 Partly Free
Macedonia 56 Partly Free
Seychelles 56 Partly Free
Turkey 56 Partly Free
126 Bhutan 58 Partly Free
Nepal 58 Partly Free
128 Guatemala 59 Partly Free
Kuwait 59 Partly Free
Libya 59 Partly Free
131 South Sudan 60 Partly Free
Ukraine 60 Partly Free
Zambia 60 Partly Free
134 Algeria 61 Not Free
Armenia 61 Not Free
Côte d’Ivoire 61 Not Free
Ecuador 61 Not Free
Mexico 61 Not Free
Paraguay 61 Not Free
140 Central African Republic 62 Not Free
Egypt 62 Not Free
Guinea 62 Not Free
Honduras 62 Not Free
Thailand 62 Not Free
145 Jordan 63 Not Free
146 Malaysia 64 Not Free
Pakistan 64 Not Free
148 Guinea-Bissau 65 Not Free
149 Cambodia 66 Not Free
Cameroon 66 Not Free
Madagascar 66 Not Free
Morocco 66 Not Free
153 Afghanistan 67 Not Free
5. FREEDOM OF THE PRESS 2013
Rank 2013 Country Rating Status
Iraq 67 Not Free
Qatar 67 Not Free
Singapore 67 Not Free
157 Angola 68 Not Free
158 Kyrgyzstan 69 Not Free
159 Togo 70 Not Free
160 Gabon 71 Not Free
Oman 71 Not Free
162 Burma 72 Not Free
Burundi 72 Not Free
164 Djibouti 74 Not Free
Sri Lanka 74 Not Free
United Arab Emirates 74 Not Free
167 Brunei 75 Not Free
168 Chad 76 Not Free
Venezuela 76 Not Free
170 Swaziland 77 Not Free
Zimbabwe 77 Not Free
172 Tajikistan 79 Not Free
Yemen 79 Not Free
174 Rwanda 80 Not Free
Sudan 80 Not Free
176 Russia 81 Not Free
177 Azerbaijan 82 Not Free
Ethiopia 82 Not Free
179 China 83 Not Free
Congo (Kinshasa) 83 Not Free
The Gambia 83 Not Free
182 Kazakhstan 84 Not Free
Laos 84 Not Free
Saudi Arabia 84 Not Free
Somalia 84 Not Free
Vietnam 84 Not Free
West Bank and Gaza Strip 84 Not Free
188 Bahrain 86 Not Free
189 Syria 88 Not Free
190 Equatorial Guinea 91 Not Free
191 Cuba 92 Not Free
Iran 92 Not Free
6. FREEDOM OF THE PRESS 2013
Rank 2013 Country Rating Status
193 Belarus 93 Not Free
194 Eritrea 94 Not Free
195 Uzbekistan 95 Not Free
196 North Korea 96 Not Free
Turkmenistan 96 Not Free
Status Number of Countries Percentage of Total
Free 63 32
Partly Free 70 36
Not Free 64 32
TOTAL 197 100
7. FREEDOM OF THE PRESS 2013
AMERICAS
Rank 2013 Country Rating Status
1 St. Lucia 15 Free
2 St. Vincent and Grenadines 17 Free
3 Barbados 18 Free
Costa Rica 18 Free
Jamaica 18 Free
United States of America 18 Free
7 Bahamas 19 Free
8 Canada 20 Free
St. Kitts and Nevis 20 Free
10 Belize 22 Free
11 Grenada 23 Free
12 Dominica 24 Free
Suriname 24 Free
14 Trinidad and Tobago 26 Free
Uruguay 26 Free
16 Chile 31 Partly Free
17 Guyana 33 Partly Free
18 Antigua and Barbuda 38 Partly Free
19 Dominican Republic 40 Partly Free
20 El Salvador 41 Partly Free
21 Peru 43 Partly Free
22 Brazil 46 Partly Free
23 Bolivia 48 Partly Free
Panama 48 Partly Free
25 Haiti 49 Partly Free
26 Nicaragua 51 Partly Free
27 Argentina 52 Partly Free
28 Colombia 53 Partly Free
29 Guatemala 59 Partly Free
30 Ecuador 61 Not Free
Mexico 61 Not Free
Paraguay 61 Not Free
33 Honduras 62 Not Free
34 Venezuela 76 Not Free
35 Cuba 92 Not Free
8. FREEDOM OF THE PRESS 2013
Status Number of Countries Percentage of Total
Free 15 43
Partly Free 14 40
Not Free 6 17
TOTAL 35 100
9. FREEDOM OF THE PRESS 2013
ASIA-PACIFIC
Rank 2013 Country Rating Status
1 New Zealand 16 Free
Palau 16 Free
3 Marshall Islands 17 Free
4 Australia 21 Free
Micronesia 21 Free
6 Japan 24 Free
7 Vanuatu 25 Free
8 Taiwan 26 Free
Tuvalu 26 Free
10 Kiribati 27 Free
11 Nauru 28 Free
Papua New Guinea 28 Free
Solomon Islands 28 Free
14 Samoa 29 Free
Tonga 29 Free
16 South Korea 31 Partly Free
17 East Timor 35 Partly Free
Hong Kong 35 Partly Free
19 Mongolia 37 Partly Free
20 India 38 Partly Free
21 Philippines 43 Partly Free
22 Indonesia 49 Partly Free
23 Bangladesh 53 Partly Free
24 Maldives 55 Partly Free
25 Fiji 56 Partly Free
26 Bhutan 58 Partly Free
Nepal 58 Partly Free
28 Thailand 62 Not Free
29 Malaysia 64 Not Free
Pakistan 64 Not Free
31 Cambodia 66 Not Free
32 Afghanistan 67 Not Free
Singapore 67 Not Free
34 Burma 72 Not Free
35 Sri Lanka 74 Not Free
36 Brunei 75 Not Free
10. FREEDOM OF THE PRESS 2013
Rank 2013 Country Rating Status
37 China 83 Not Free
38 Laos 84 Not Free
Vietnam 84 Not Free
40 North Korea 96 Not Free
Status Number of Countries Percentage of Total
Free 15 37.5
Partly Free 12 30
Not Free 13 32.5
TOTAL 40 100
11. FREEDOM OF THE PRESS 2013
CENTRAL AND EASTERN EUROPE / EURASIA
Rank 2013 Country Rating Status
1 Estonia 16 Free
2 Czech Republic 19 Free
3 Slovakia 22 Free
4 Lithuania 24 Free
Slovenia 24 Free
6 Poland 26 Free
7 Latvia 28 Free
8 Hungary 36 Partly Free
Montenegro 36 Partly Free
Serbia 36 Partly Free
11 Bulgaria 37 Partly Free
12 Croatia 40 Partly Free
13 Romania 42 Partly Free
14 Albania 49 Partly Free
Bosnia and Herzegovina 49 Partly Free
Georgia 49 Partly Free
Kosovo 49 Partly Free
18 Moldova 53 Partly Free
19 Macedonia 56 Partly Free
20 Ukraine 60 Partly Free
21 Armenia 61 Not Free
22 Kyrgyzstan 69 Not Free
23 Tajikistan 79 Not Free
24 Russia 81 Not Free
25 Azerbaijan 82 Not Free
26 Kazakhstan 84 Not Free
27 Belarus 93 Not Free
28 Uzbekistan 95 Not Free
29 Turkmenistan 96 Not Free
Status Number of Countries Percentage of Total
Free 7 24
Partly Free 13 45
Not Free 9 31
TOTAL 29 100
12. FREEDOM OF THE PRESS 2013
MIDDLE EAST AND NORTH AFRICA
Rank 2013 Country Rating Status
1 Israel 31 Partly Free
2 Tunisia 52 Partly Free
3 Lebanon 53 Partly Free
4 Kuwait 59 Partly Free
Libya 59 Partly Free
6 Algeria 61 Not Free
7 Egypt 62 Not Free
8 Jordan 63 Not Free
9 Morocco 66 Not Free
10 Iraq 67 Not Free
Qatar 67 Not Free
12 Oman 71 Not Free
13 United Arab Emirates 74 Not Free
14 Yemen 79 Not Free
15 Saudi Arabia 84 Not Free
West Bank and Gaza Strip 84 Not Free
17 Bahrain 86 Not Free
18 Syria 88 Not Free
19 Iran 92 Not Free
Status Number of Countries Percentage of Total
Free 0 0
Partly Free 5 26
Not Free 14 74
TOTAL 19 100
13. FREEDOM OF THE PRESS 2013
SUB-SAHARAN AFRICA
Rank 2013 Country Rating Status
1 Cape Verde 27 Free
2 Ghana 28 Free
São Tomé and Príncipe 28 Free
4 Mauritius 30 Free
5 Namibia 31 Partly Free
6 Benin 34 Partly Free
7 South Africa 35 Partly Free
8 Botswana 41 Partly Free
9 Burkina Faso 42 Partly Free
Mozambique 42 Partly Free
11 Mali 46 Partly Free
12 Mauritania 47 Partly Free
13 Comoros 49 Partly Free
Lesotho 49 Partly Free
Sierra Leone 49 Partly Free
16 Niger 50 Partly Free
17 Nigeria 51 Partly Free
Tanzania 51 Partly Free
19 Senegal 52 Partly Free
20 Kenya 53 Partly Free
Malawi 53 Partly Free
22 Uganda 55 Partly Free
23 Congo (Brazzaville) 56 Partly Free
Liberia 56 Partly Free
Seychelles 56 Partly Free
26 South Sudan 60 Partly Free
Zambia 60 Partly Free
28 Côte d’Ivoire 61 Not Free
29 Central African Republic 62 Not Free
Guinea 62 Not Free
31 Guinea-Bissau 65 Not Free
32 Cameroon 66 Not Free
Madagascar 66 Not Free
34 Angola 68 Not Free
35 Togo 70 Not Free
36 Gabon 71 Not Free
14. FREEDOM OF THE PRESS 2013
Rank 2013 Country Rating Status
37 Burundi 72 Not Free
38 Djibouti 74 Not Free
39 Chad 76 Not Free
40 Swaziland 77 Not Free
Zimbabwe 77 Not Free
42 Rwanda 80 Not Free
Sudan 80 Not Free
44 Ethiopia 82 Not Free
45 Congo (Kinshasa) 83 Not Free
The Gambia 83 Not Free
47 Somalia 84 Not Free
48 Equatorial Guinea 91 Not Free
49 Eritrea 94 Not Free
Status Number of Countries Percentage of Total
Free 4 8
Partly Free 23 47
Not Free 22 45
TOTAL 49 100
15. FREEDOM OF THE PRESS 2013
WESTERN EUROPE
Rank 2013 Country Rating Status
1 Norway 10 Free
Sweden 10 Free
3 Belgium 11 Free
Finland 11 Free
Netherlands 11 Free
6 Denmark 12 Free
Luxembourg 12 Free
Switzerland 12 Free
9 Andorra 13 Free
10 Iceland 14 Free
Liechtenstein 14 Free
12 Ireland 16 Free
Monaco 16 Free
San Marino 16 Free
15 Germany 17 Free
Portugal 17 Free
17 Austria 21 Free
United Kingdom 21 Free
19 France 22 Free
Malta 22 Free
21 Cyprus 25 Free
22 Spain 27 Free
23 Italy 33 Partly Free
24 Greece 41 Partly Free
25 Turkey 56 Partly Free
Status Number of Countries Percentage of Total
Free 22 88
Partly Free 3 12
Not Free 0 0
TOTAL 25 100