Download as PDF, PPTX
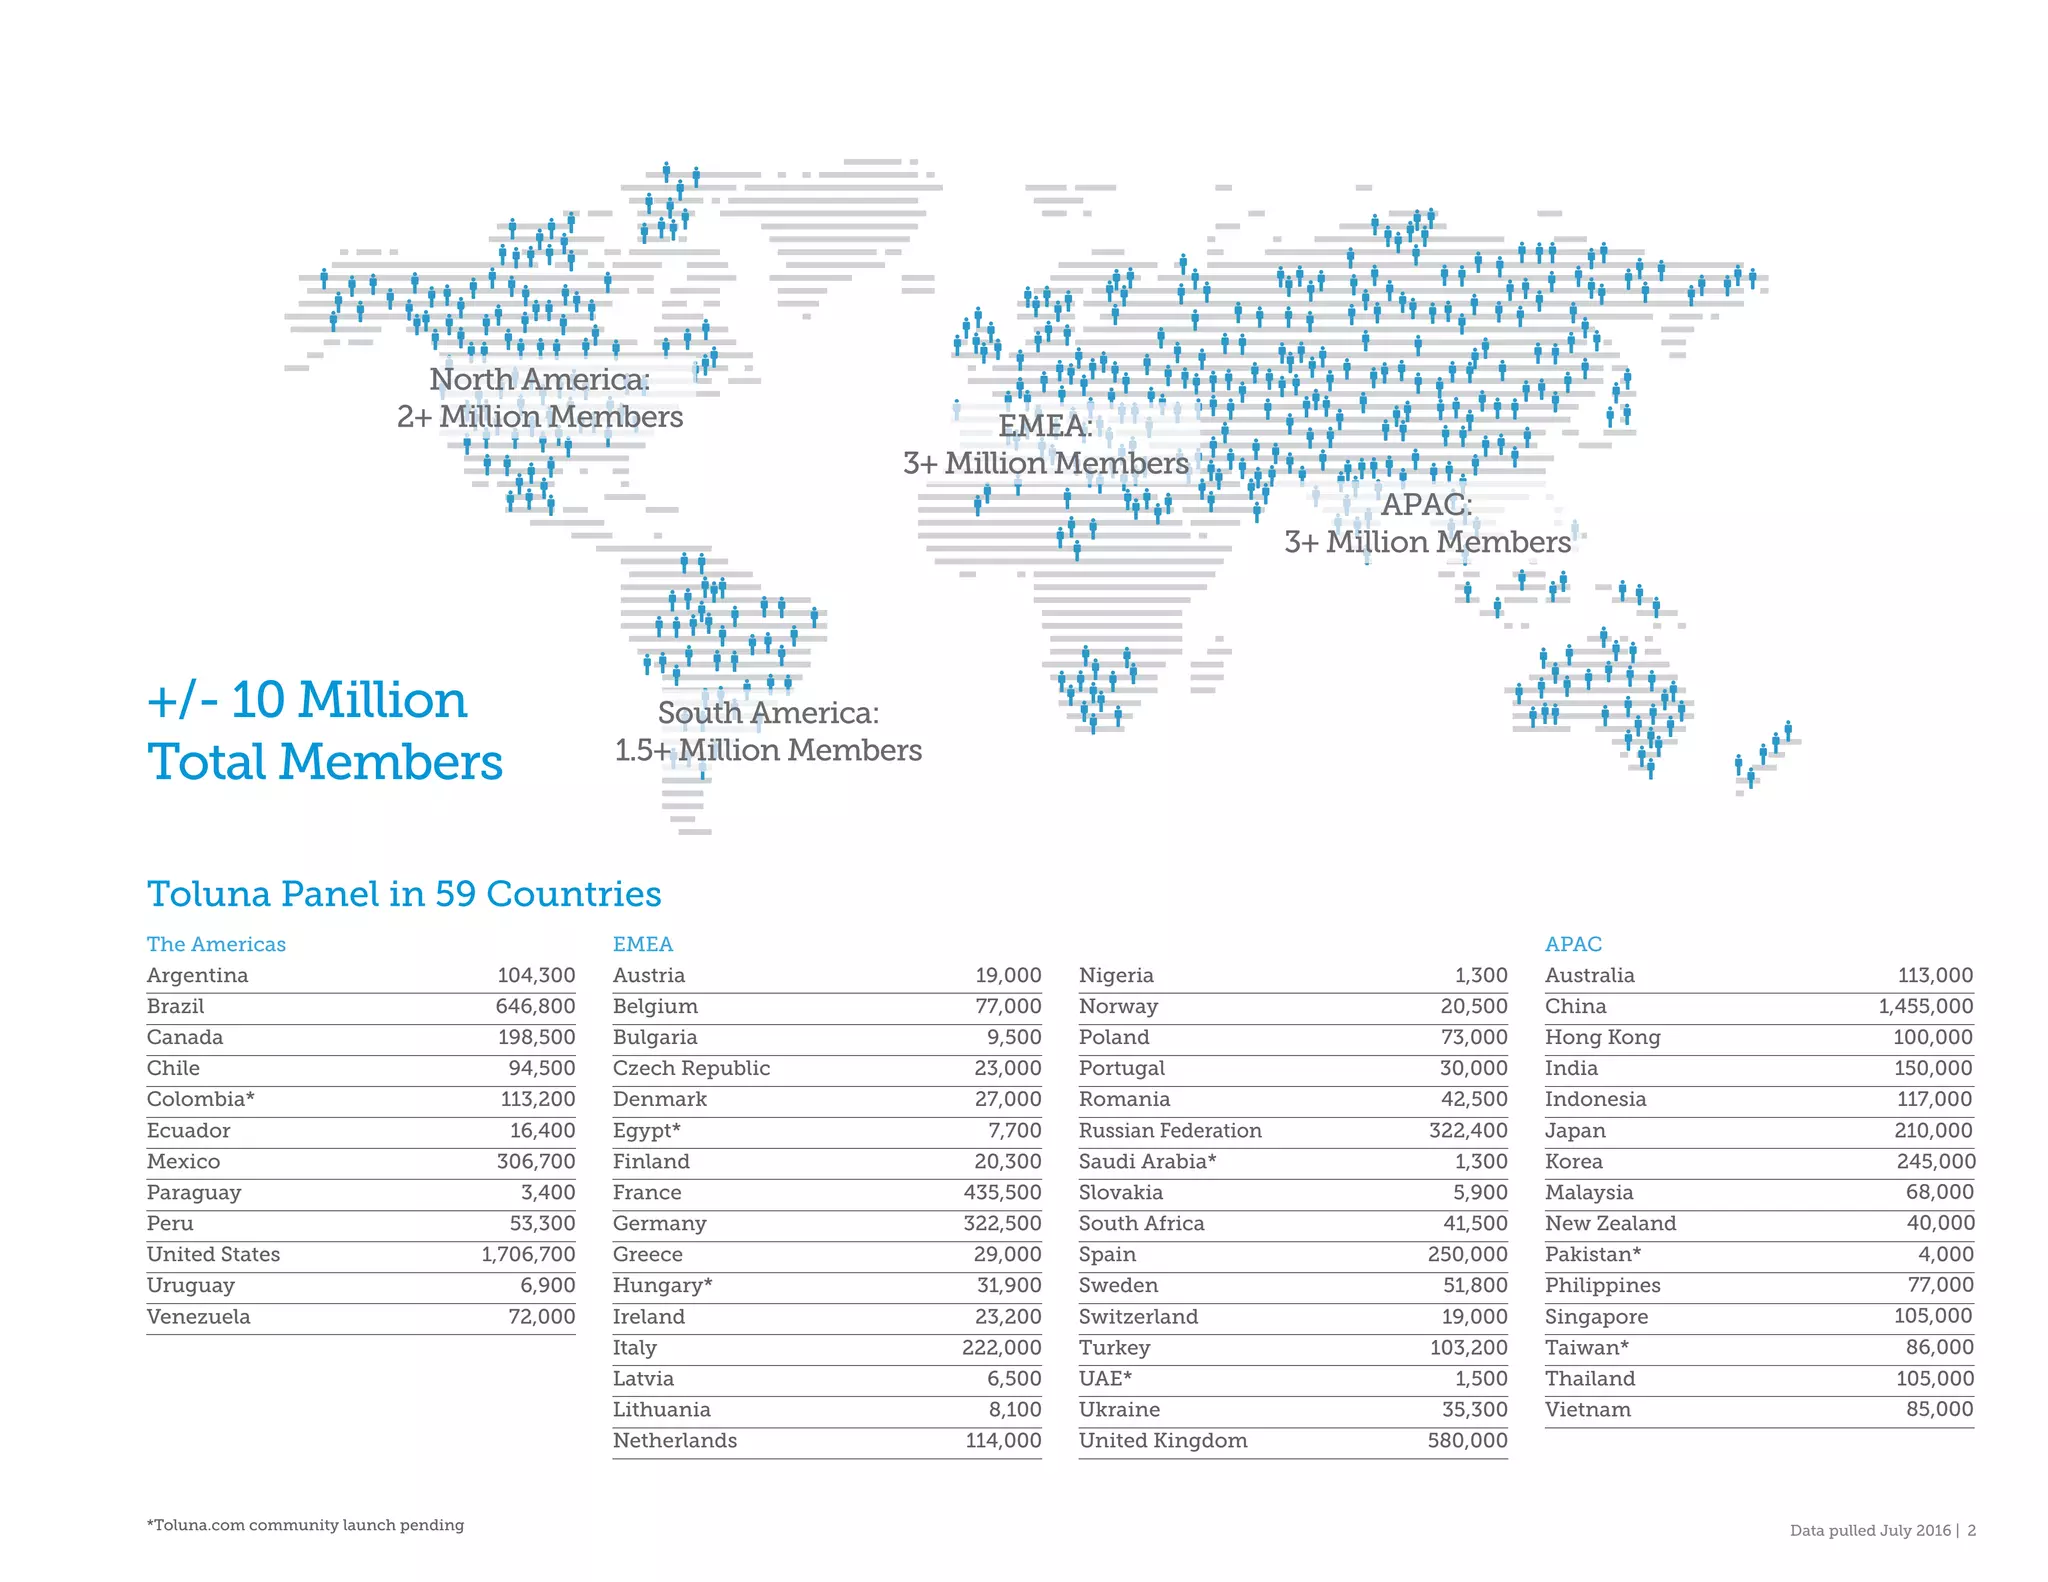
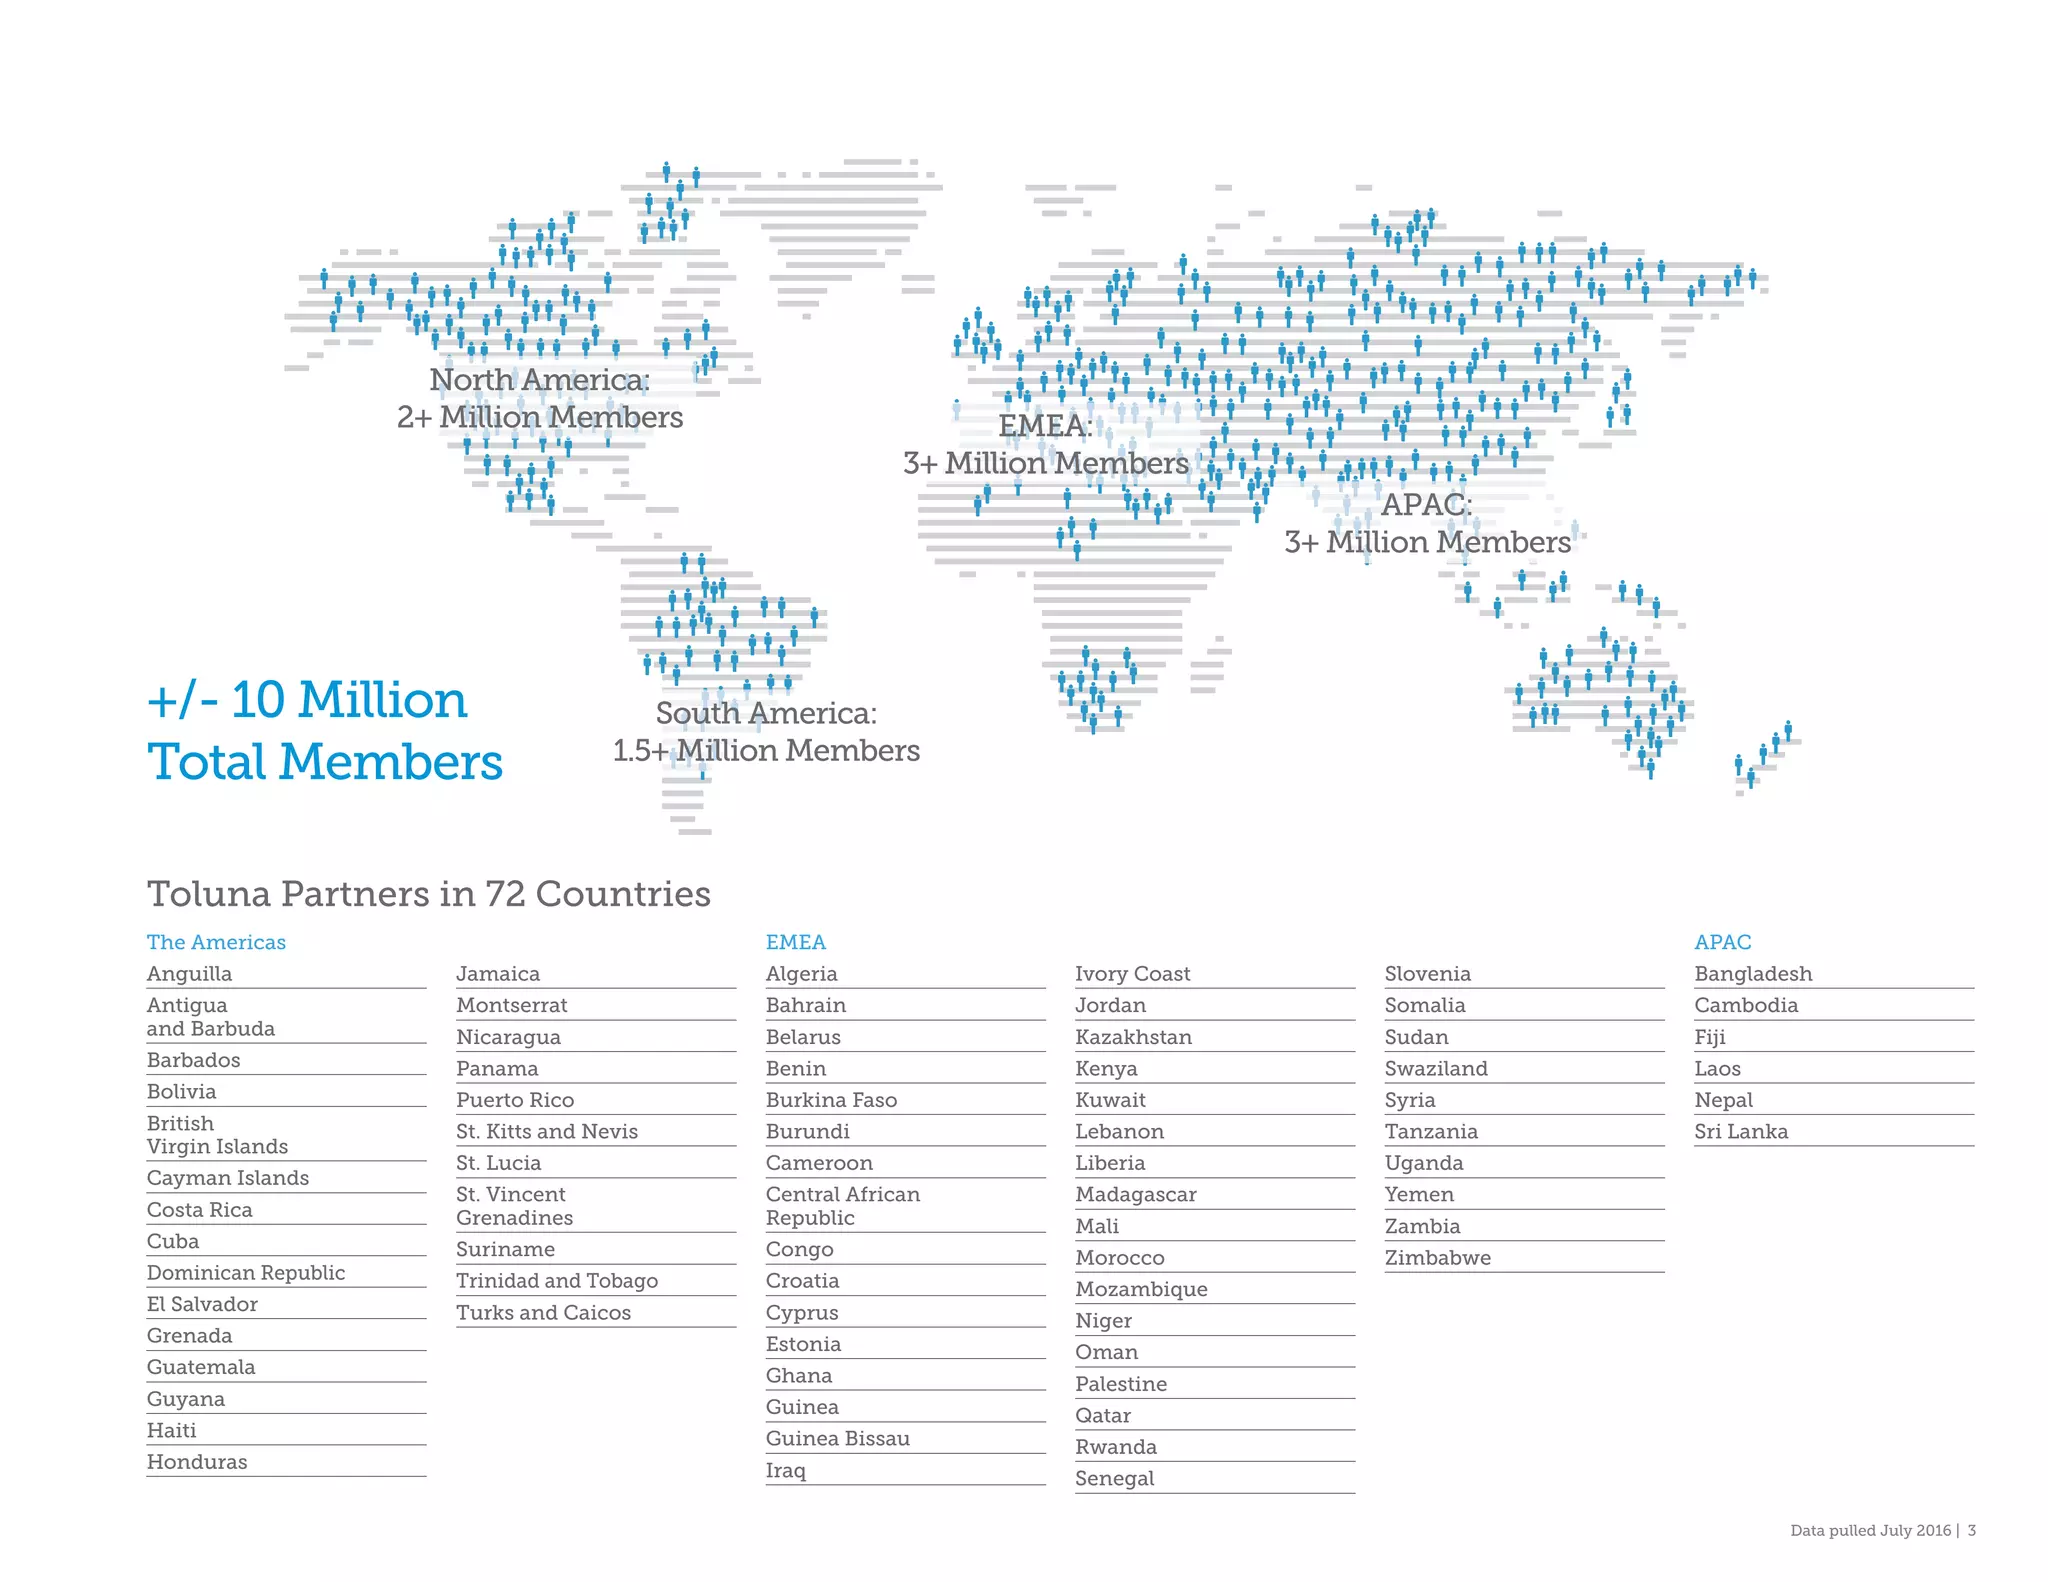


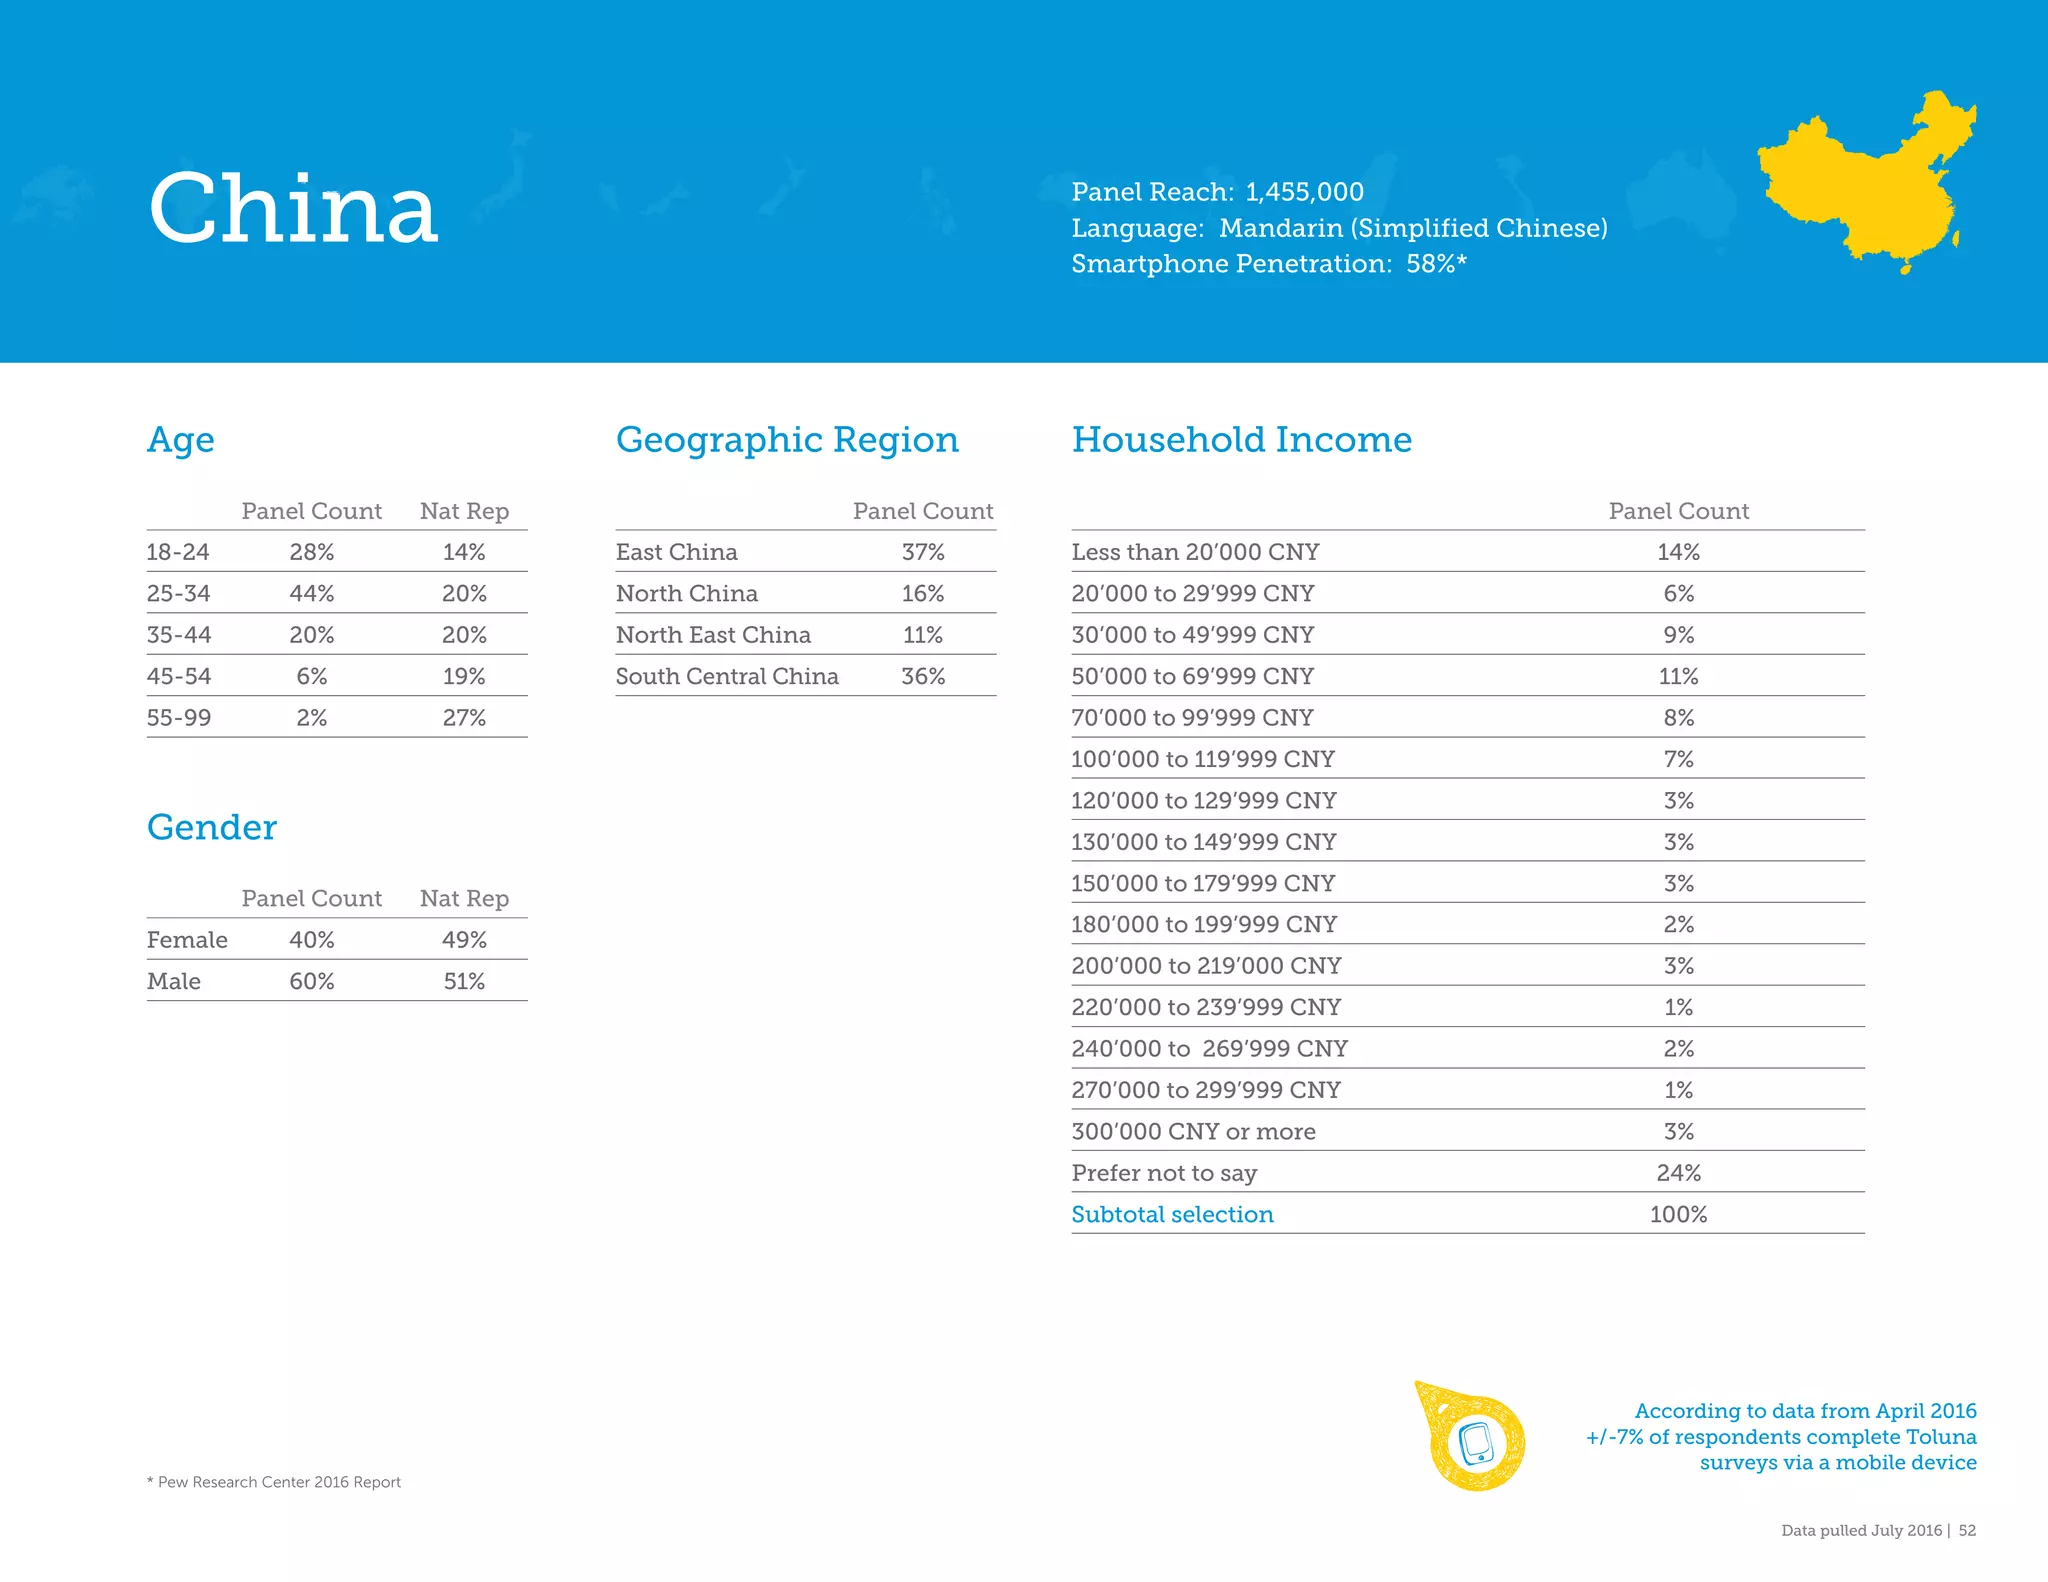
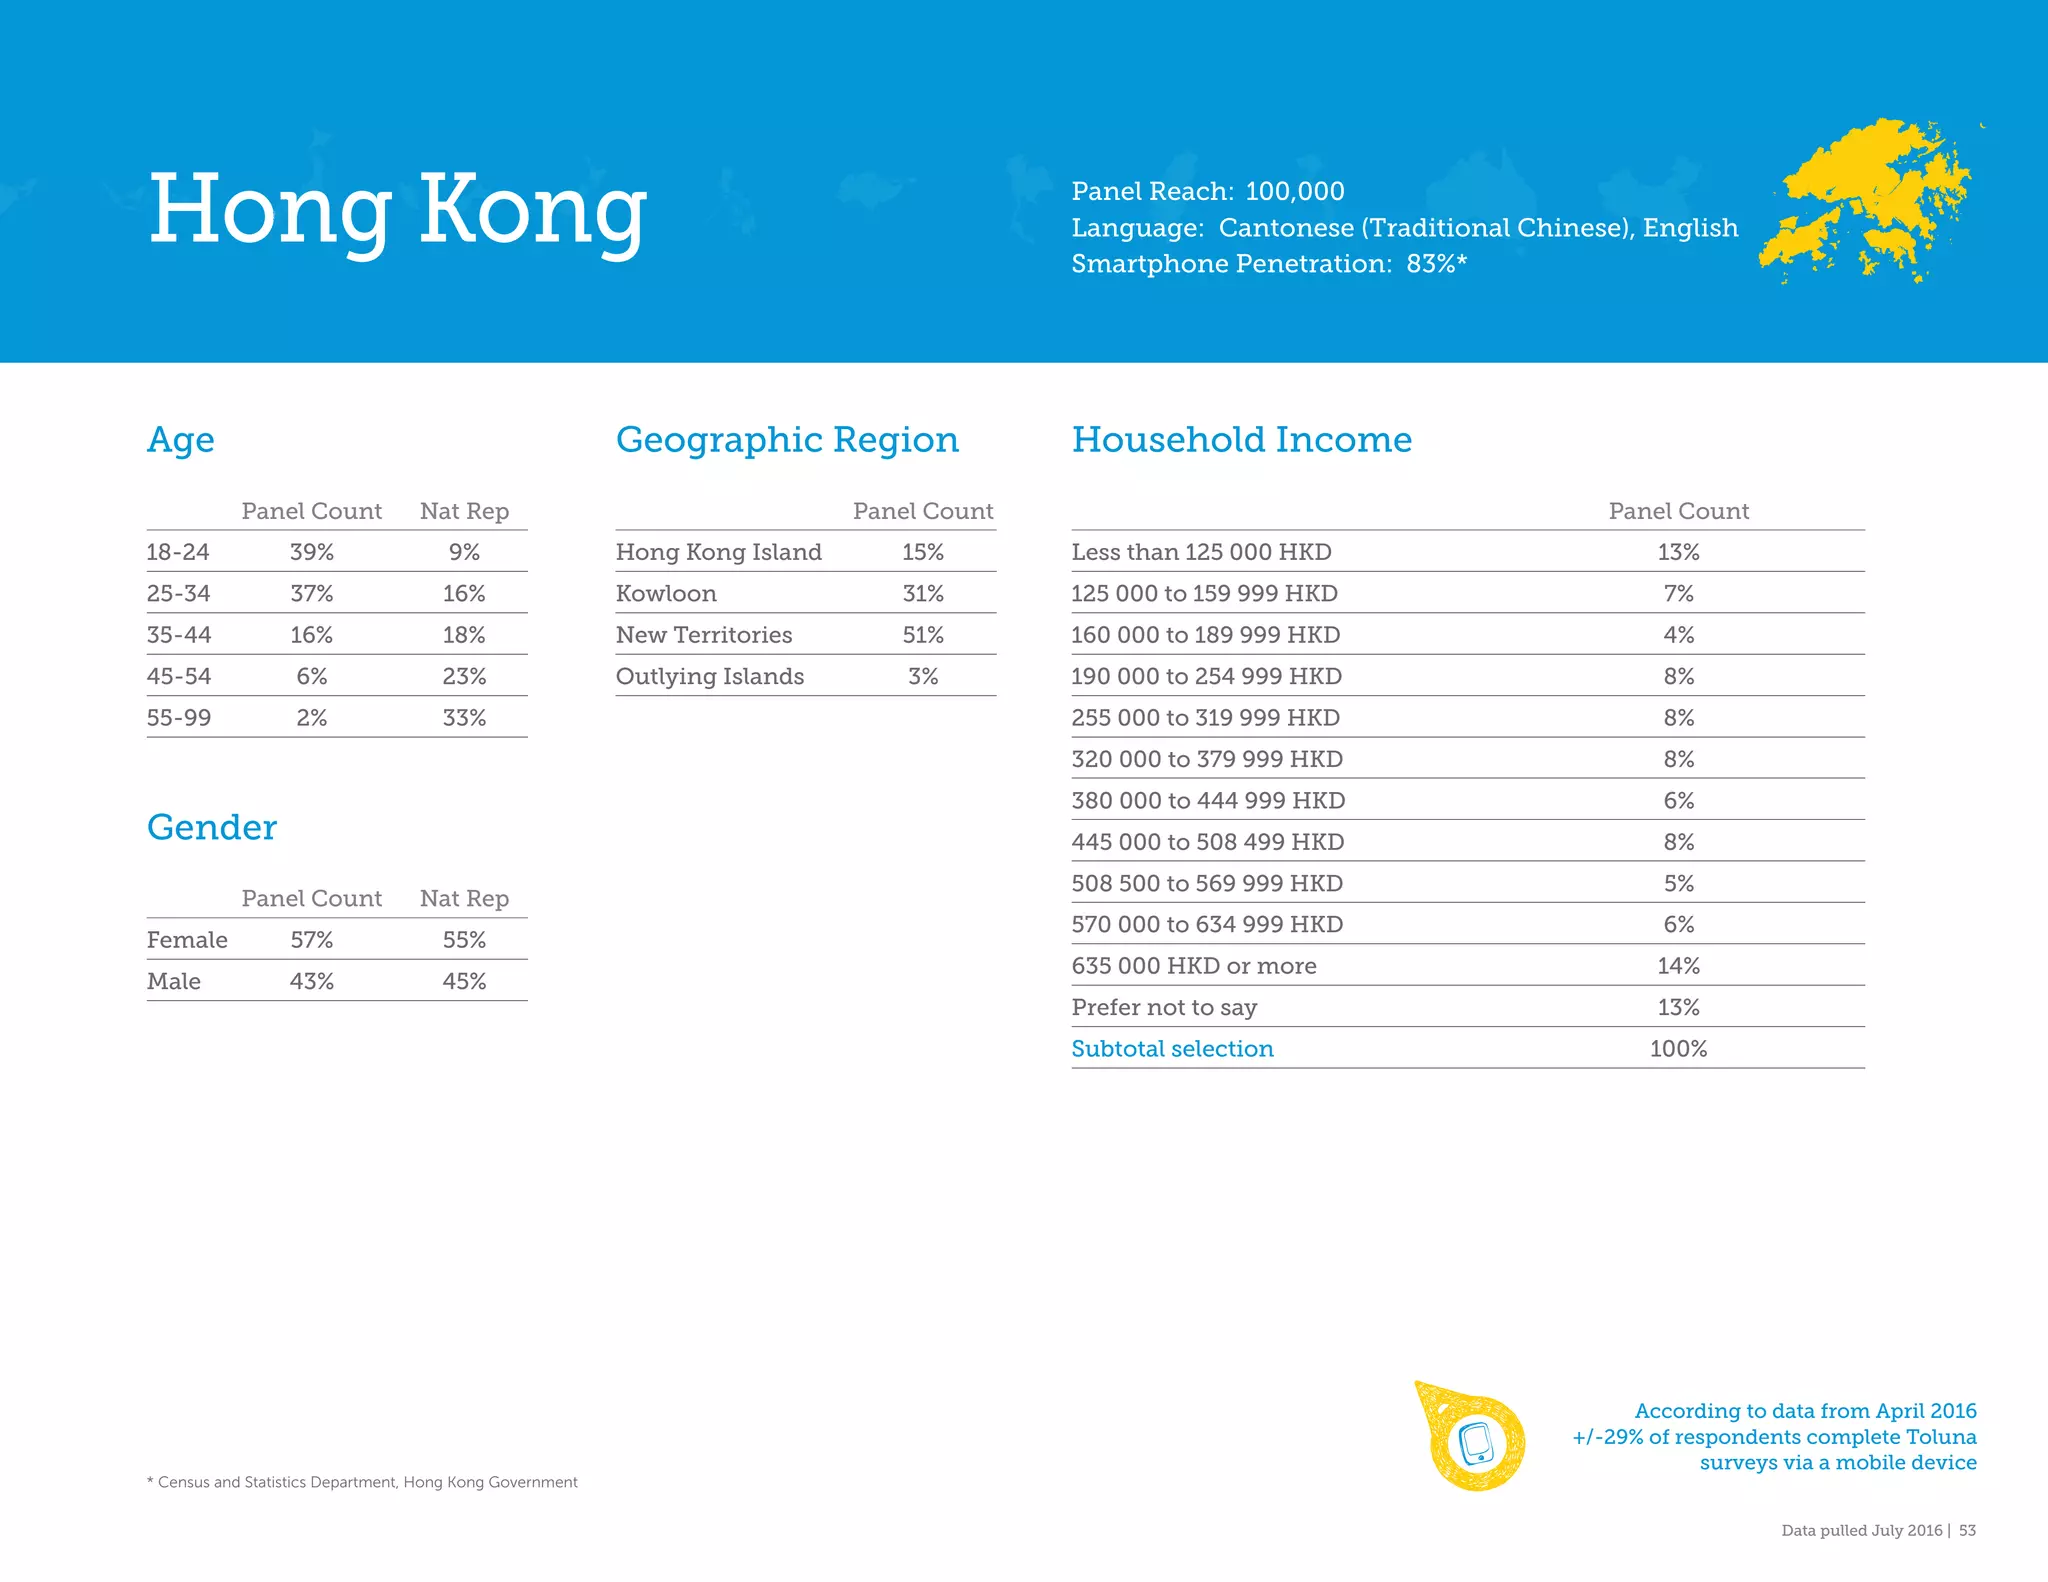
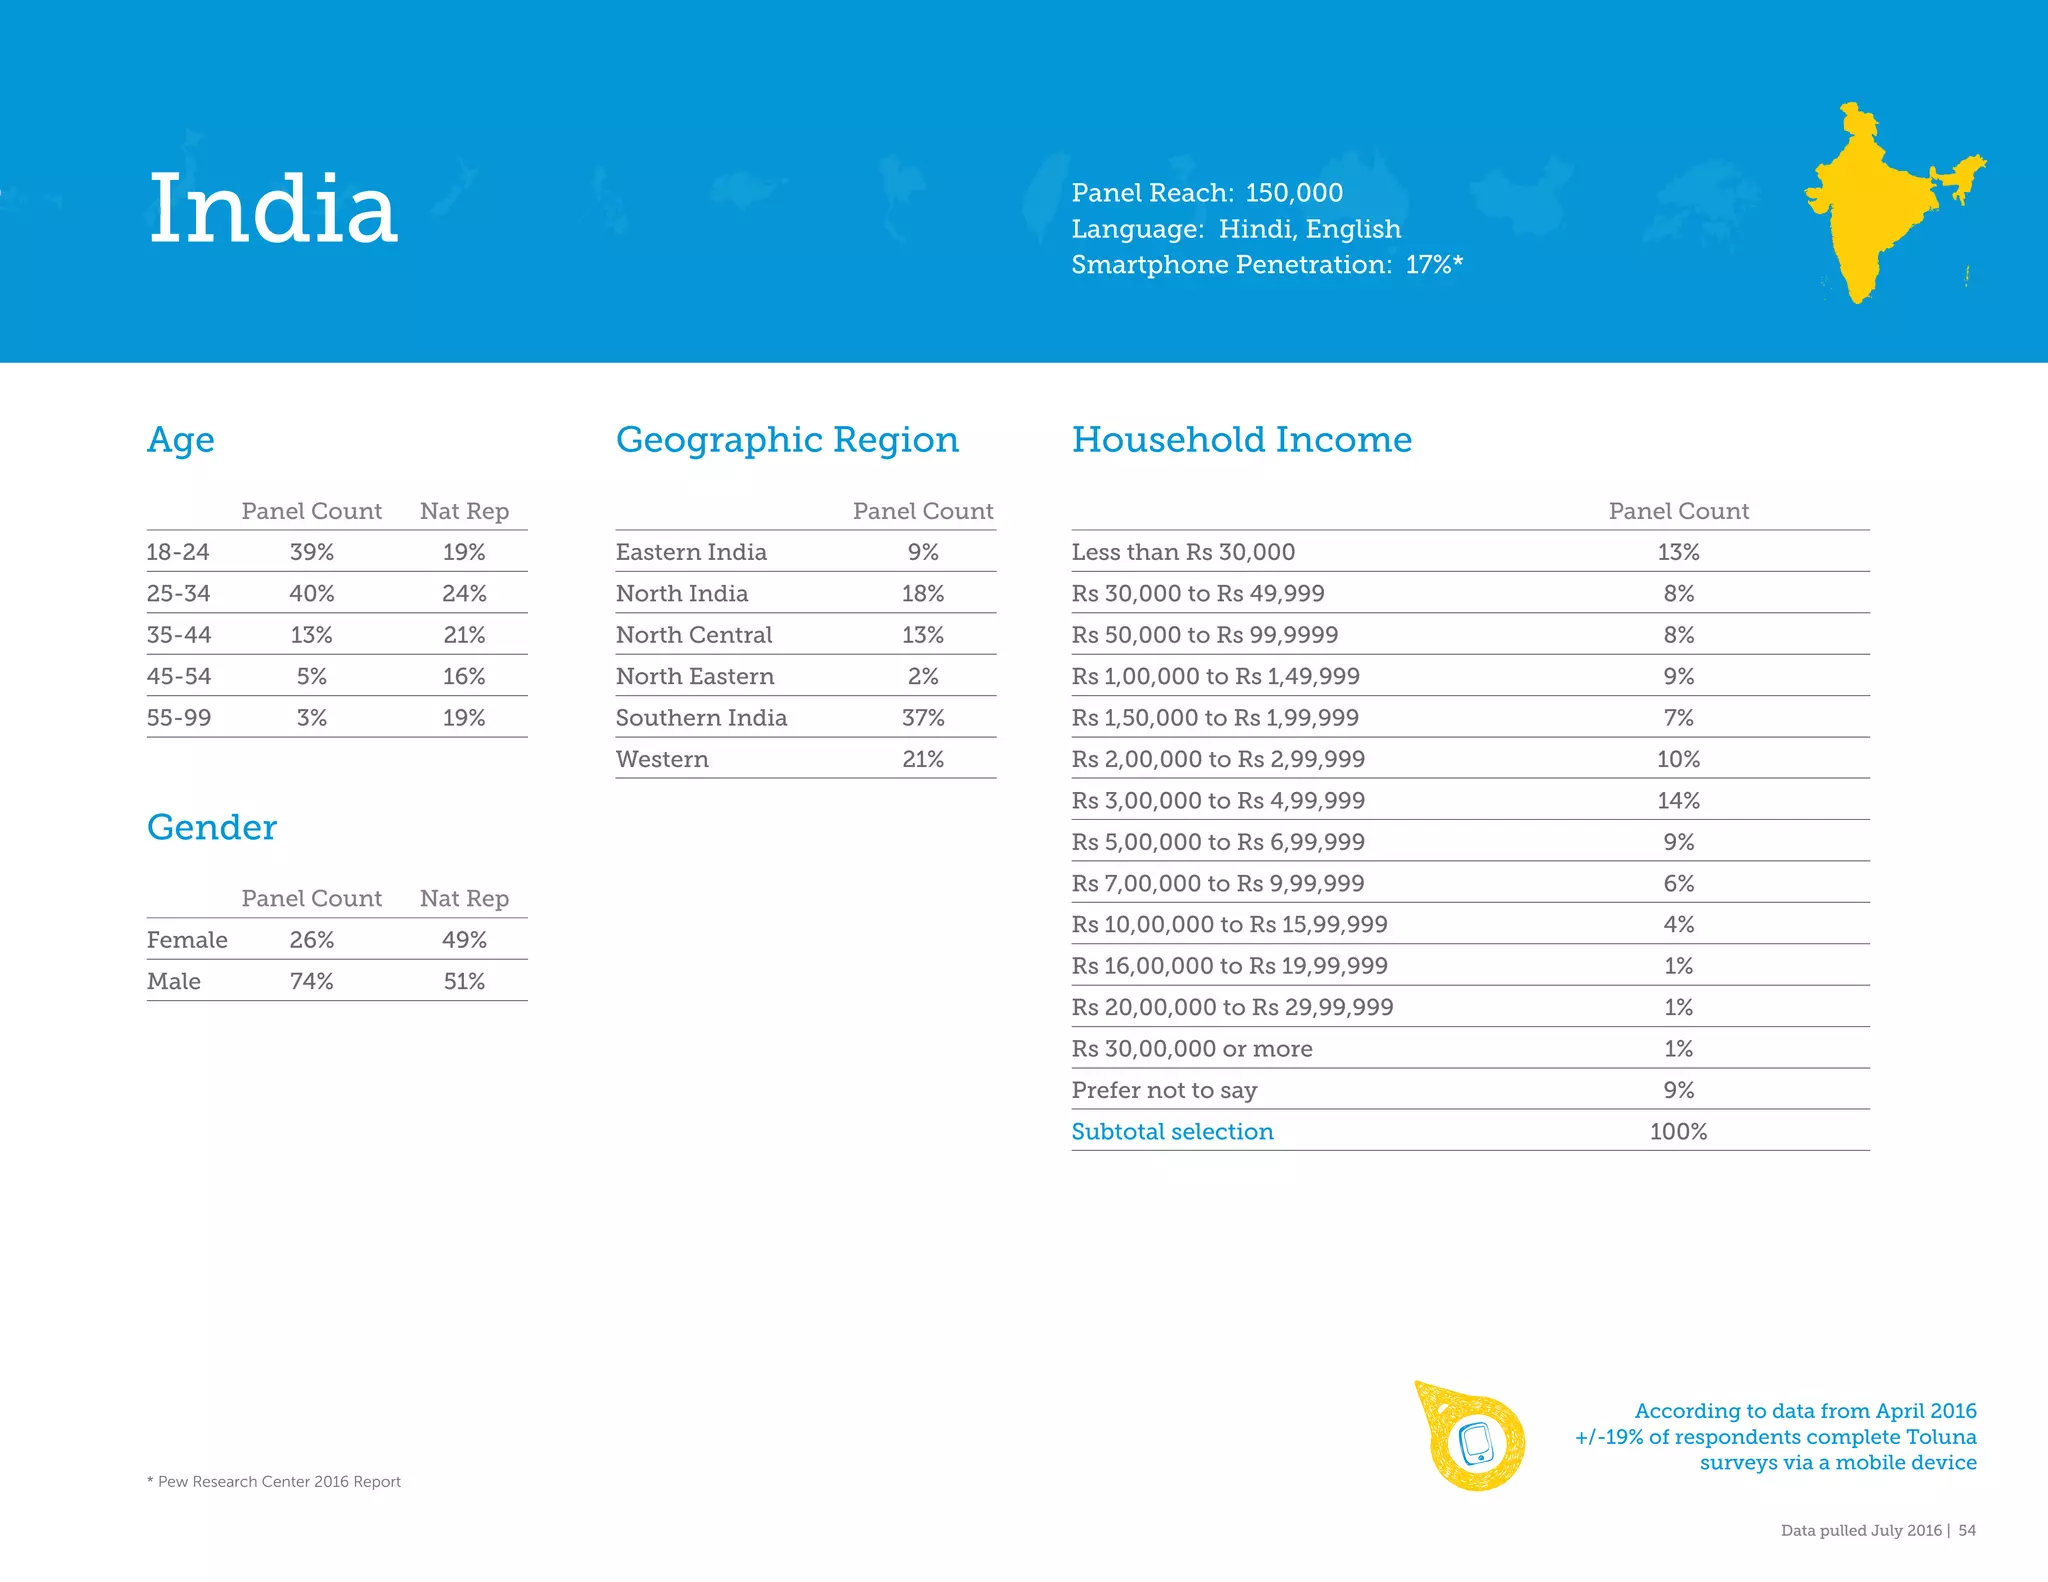
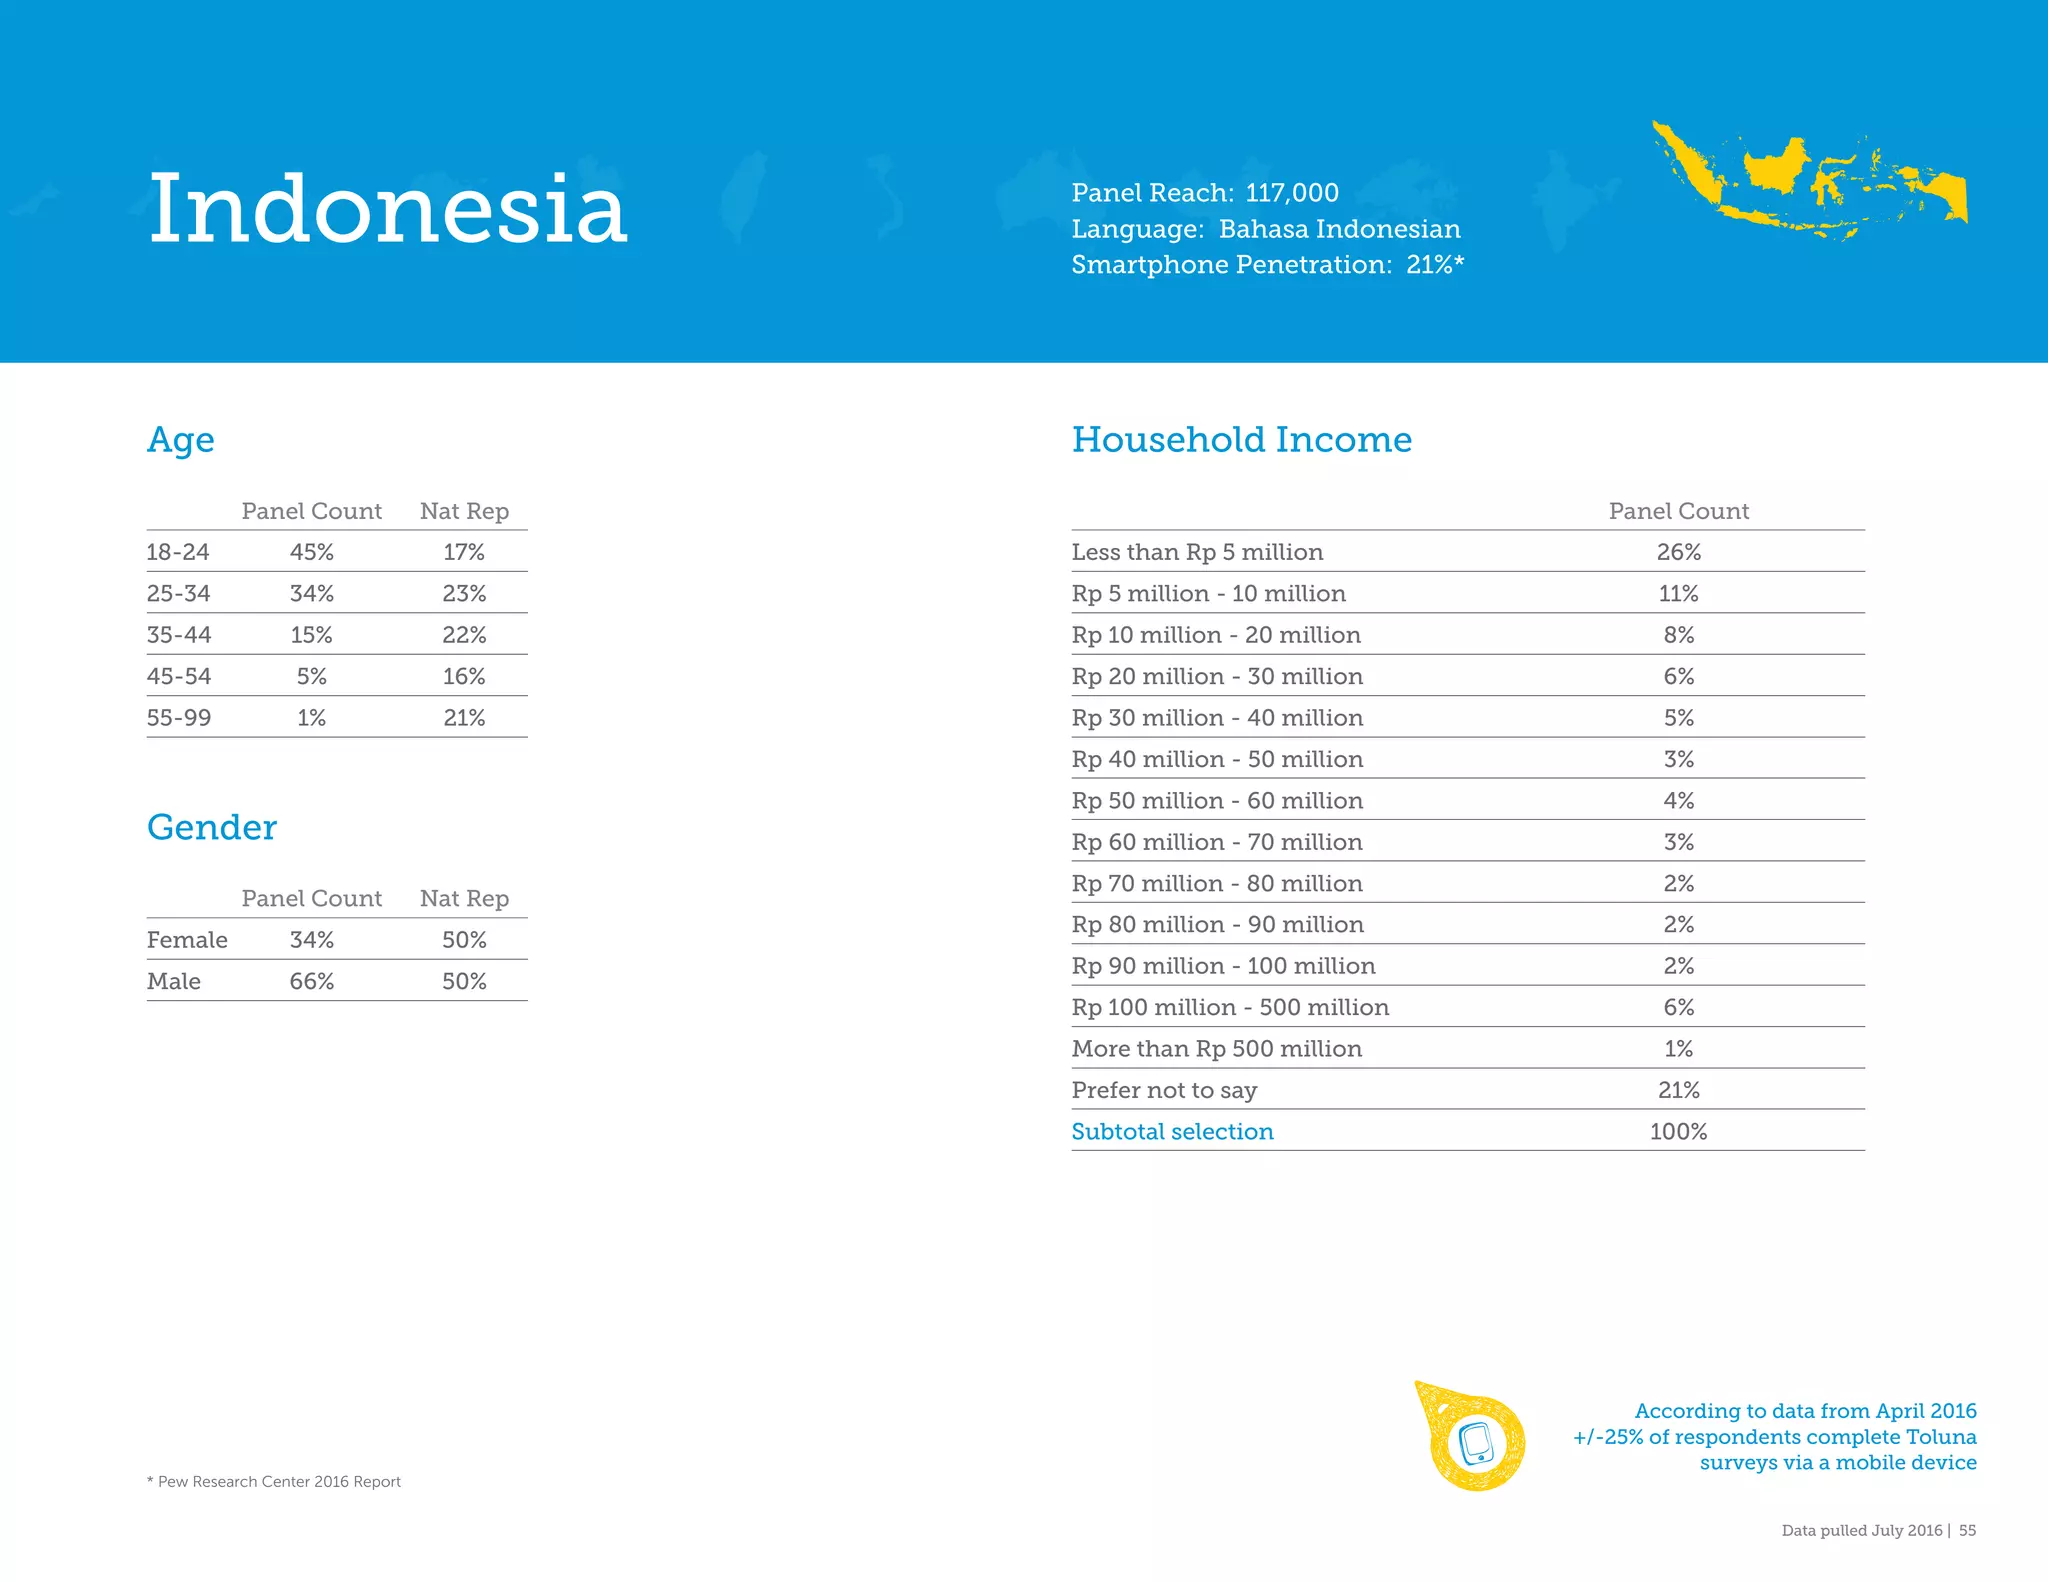
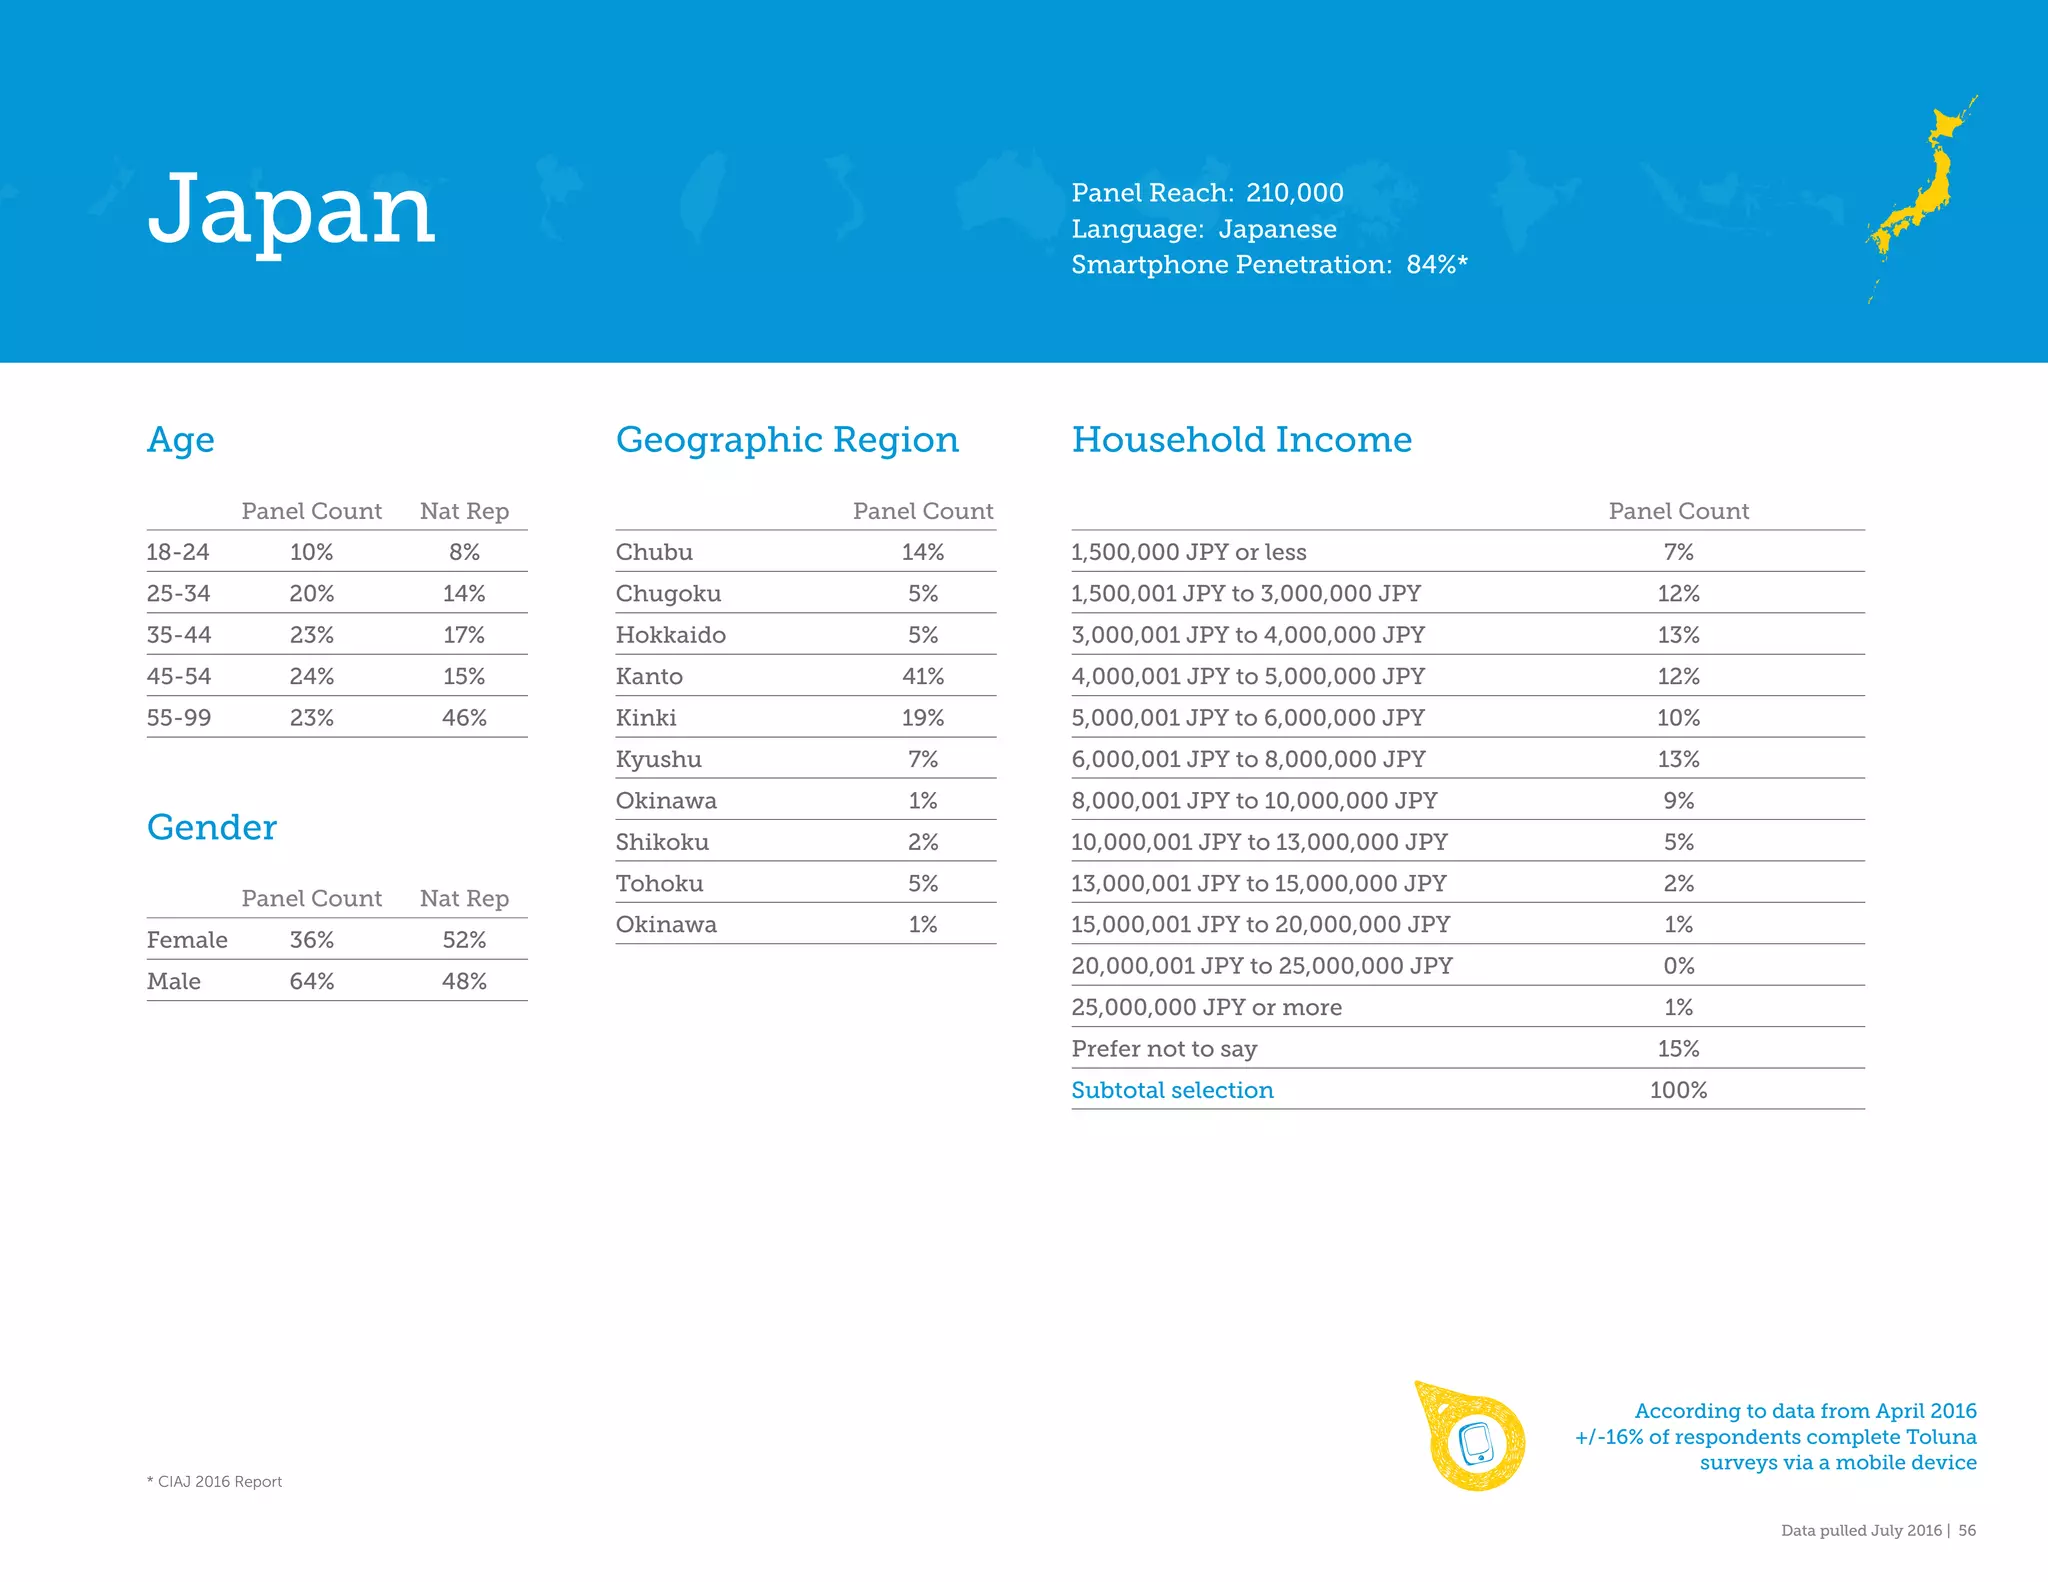
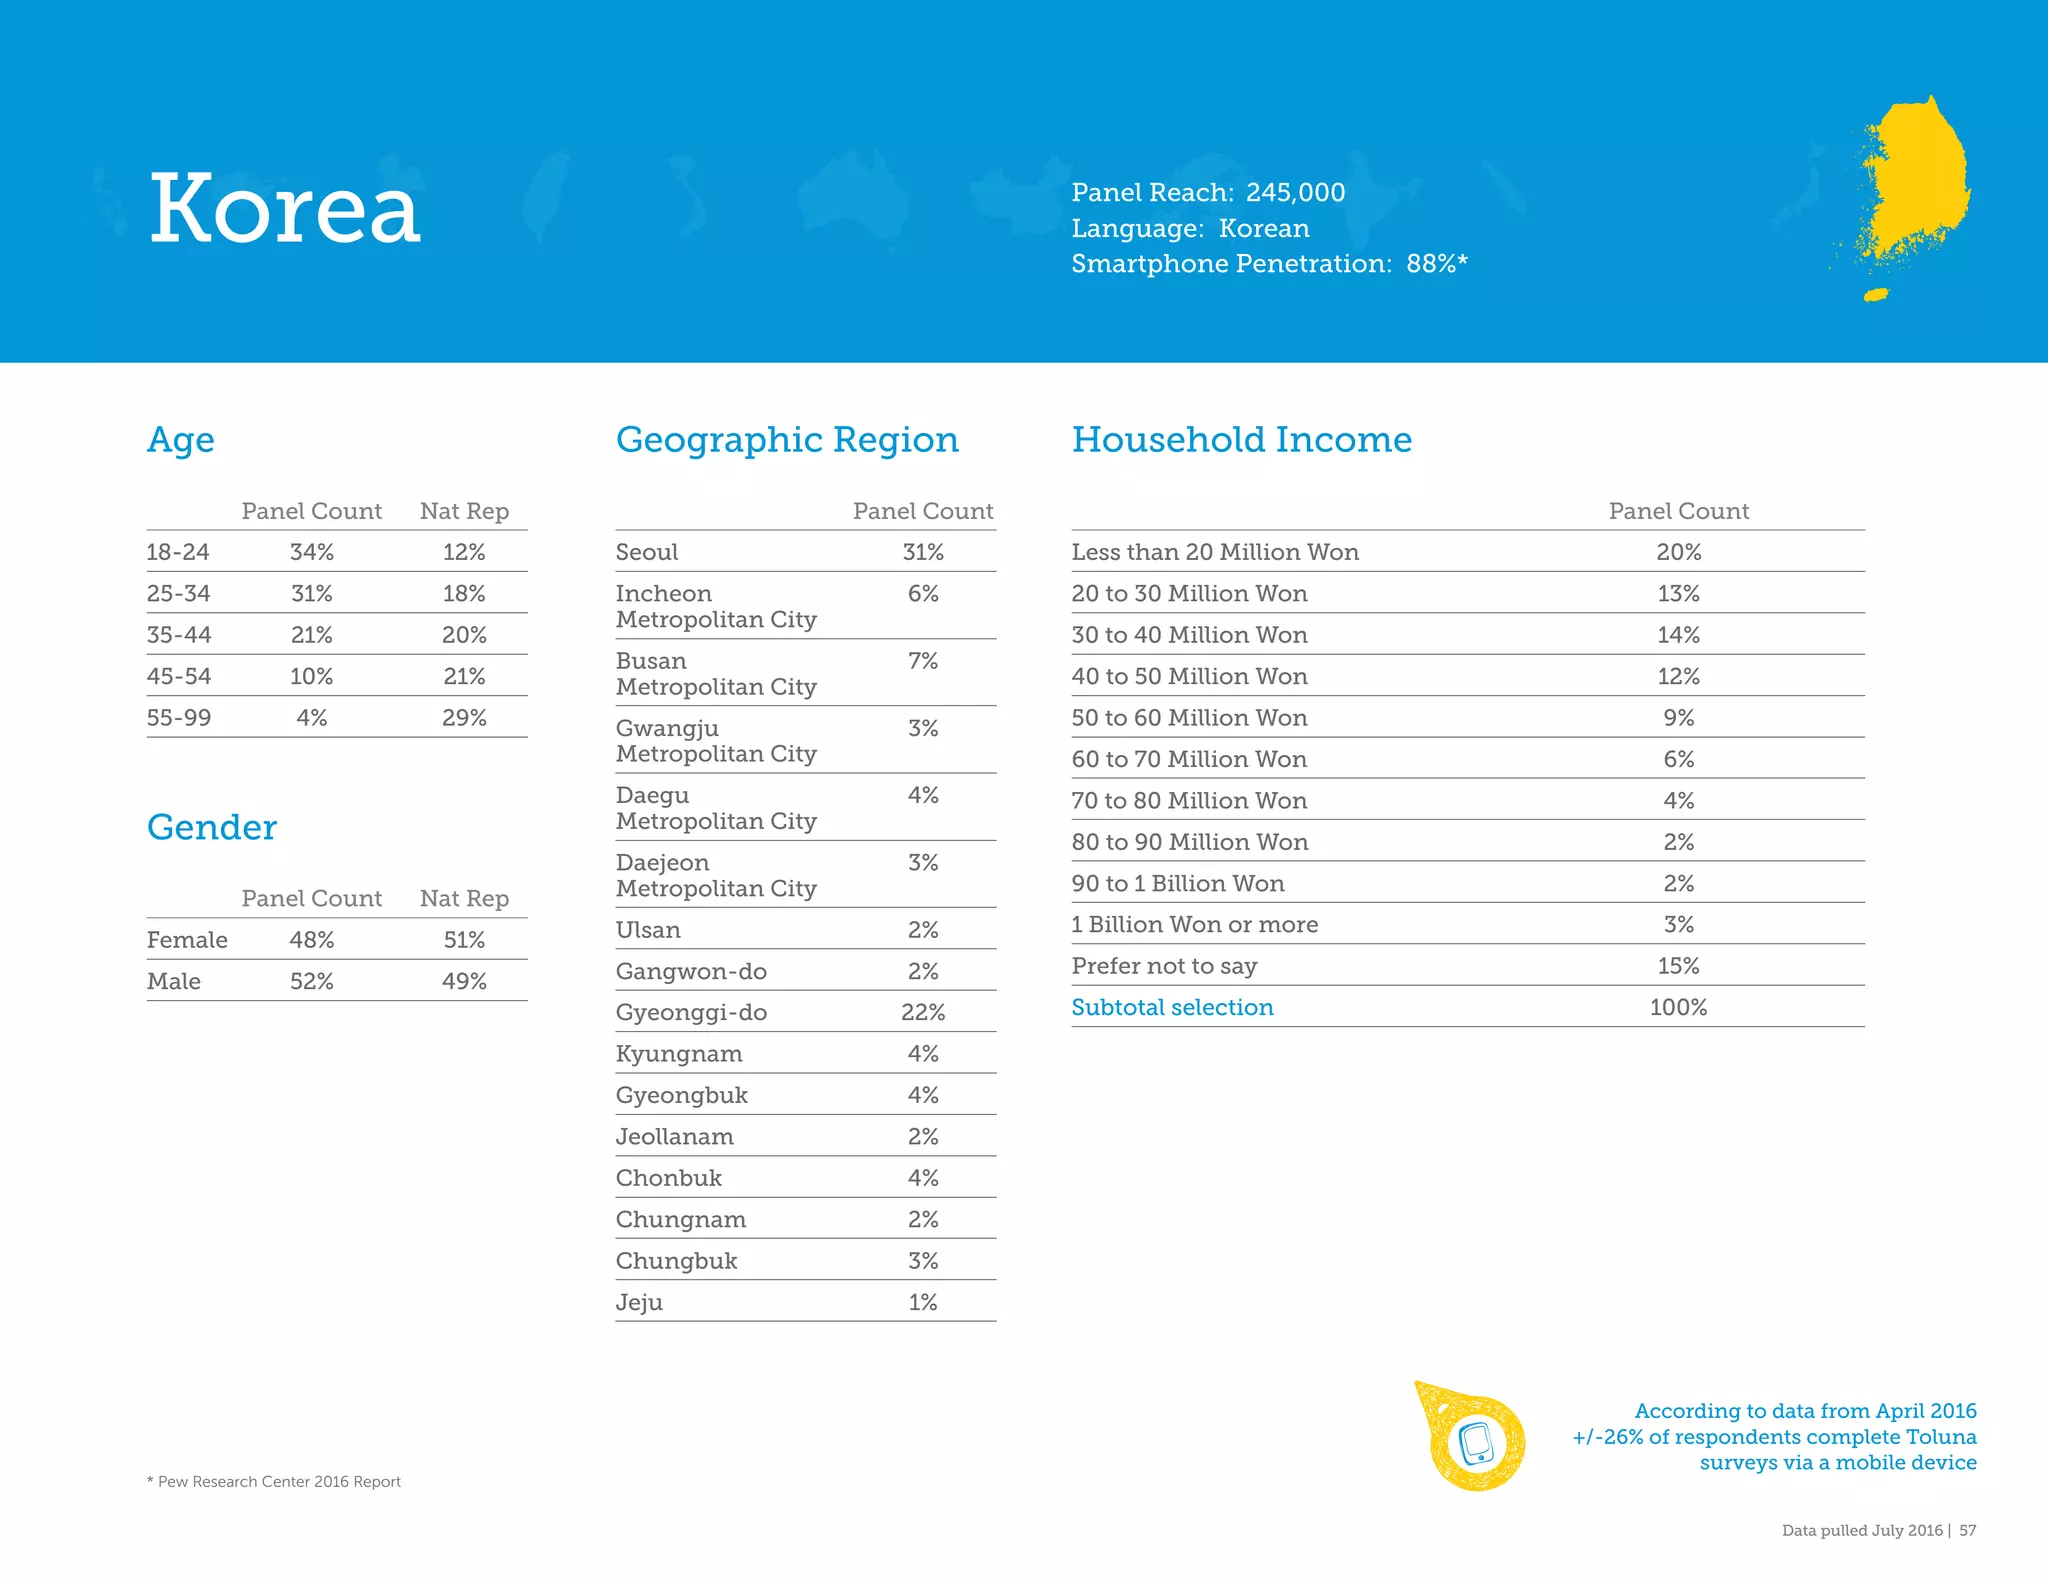
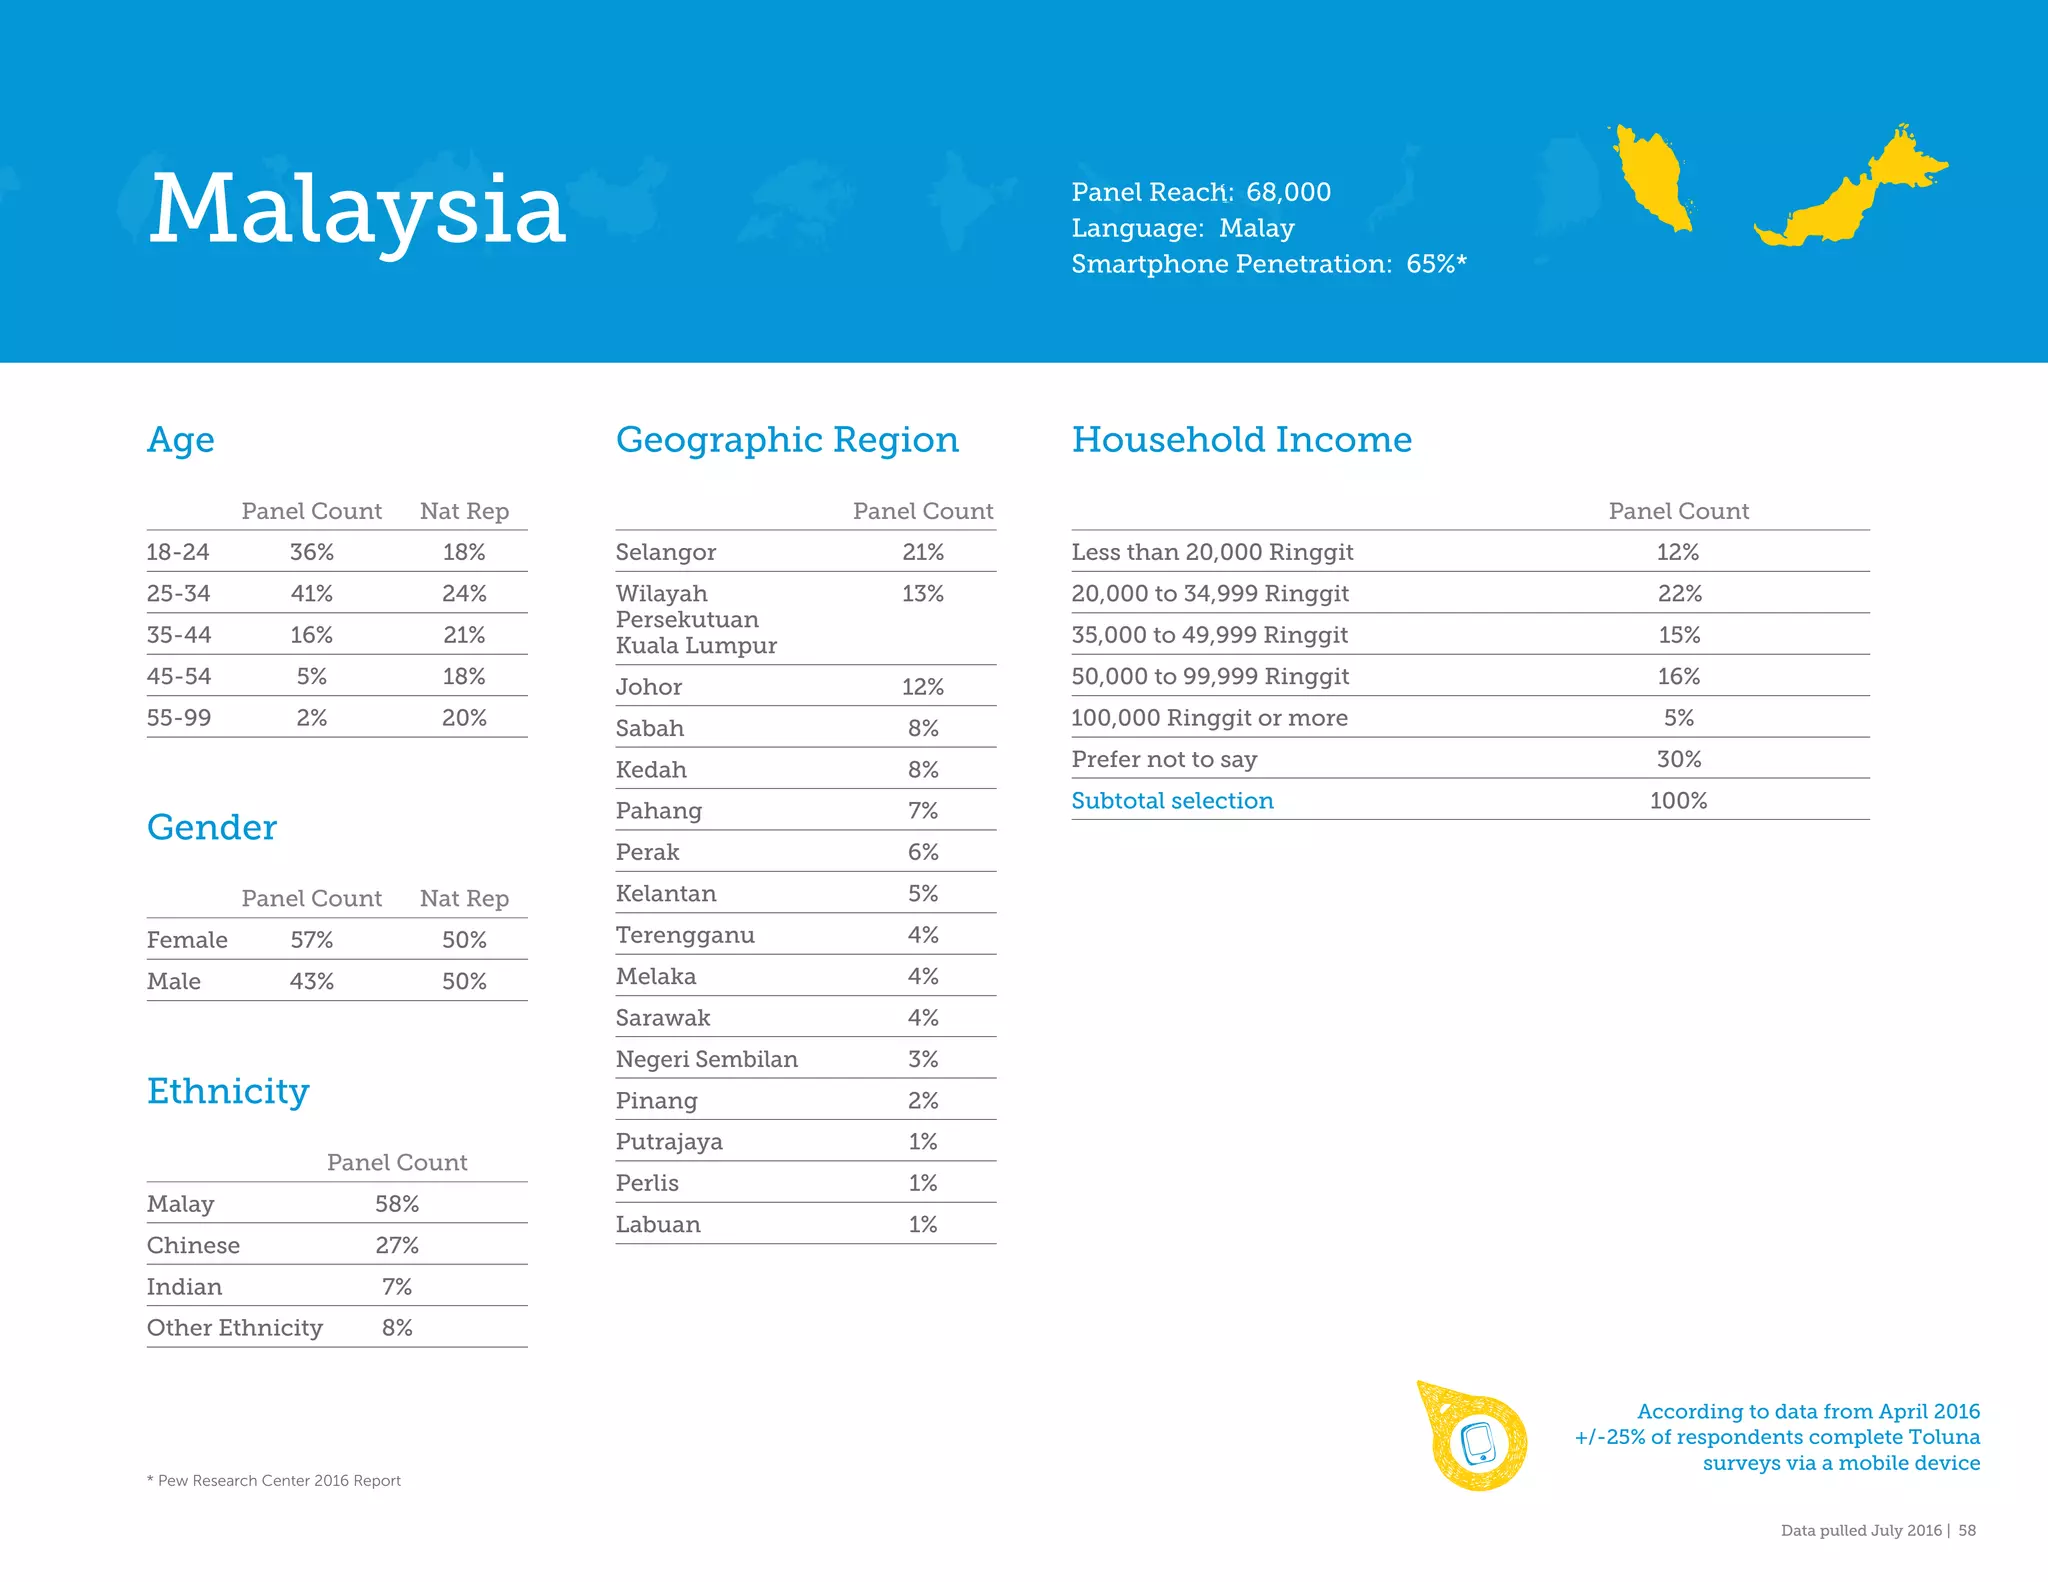
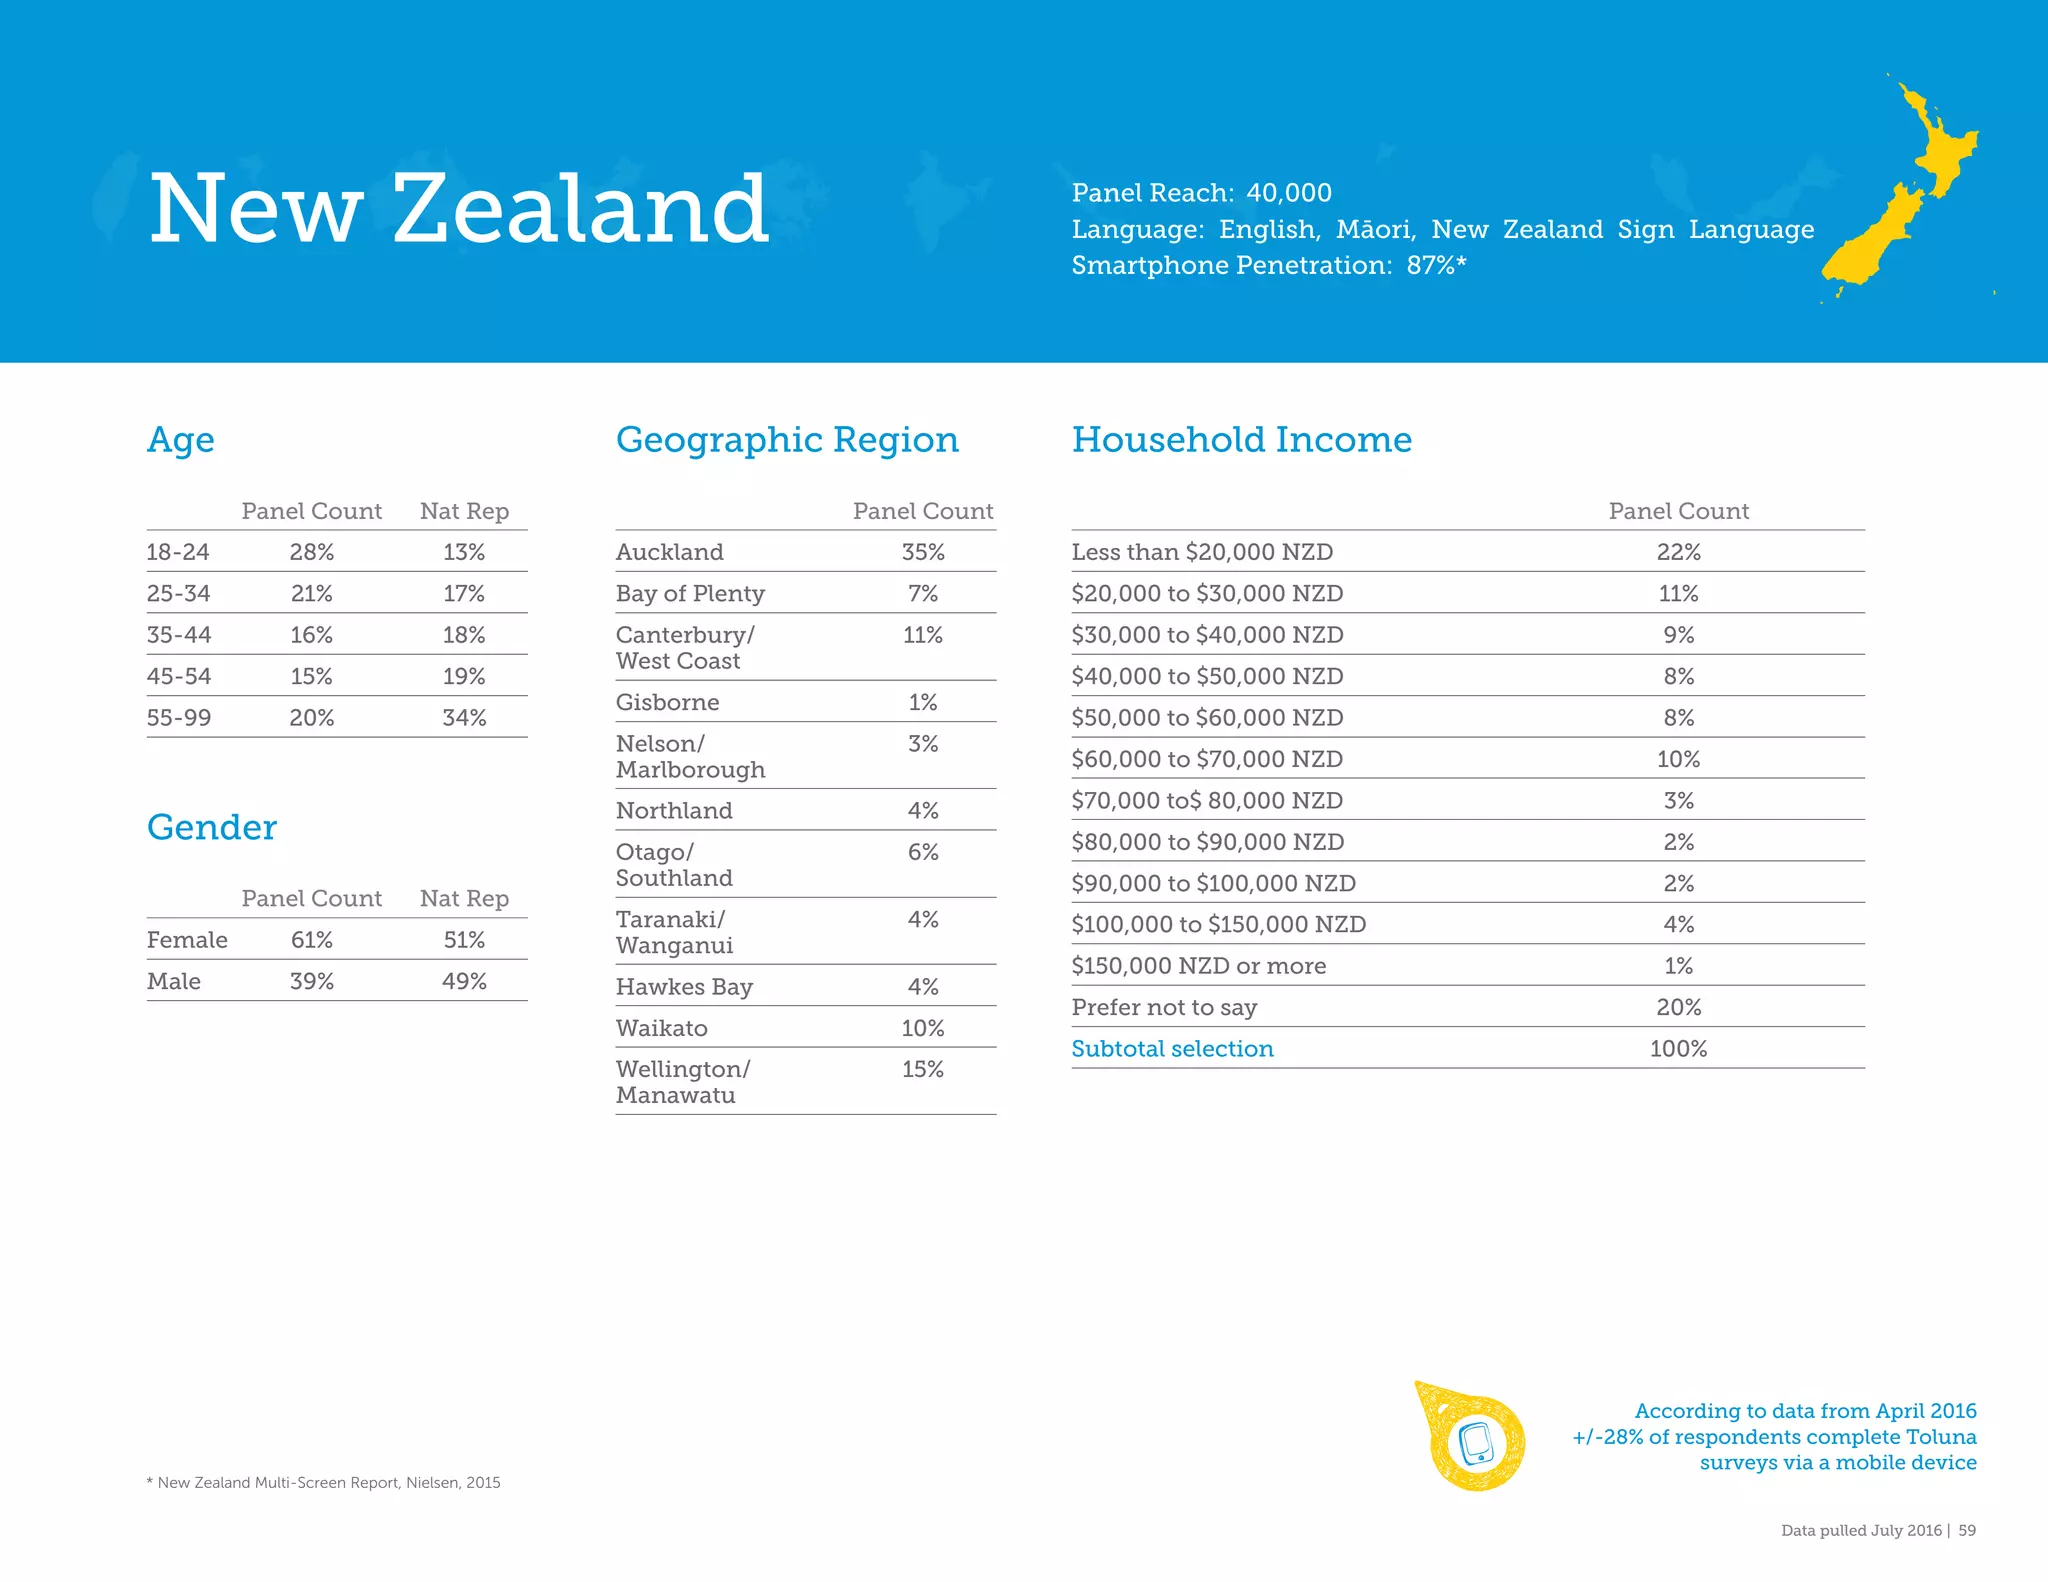
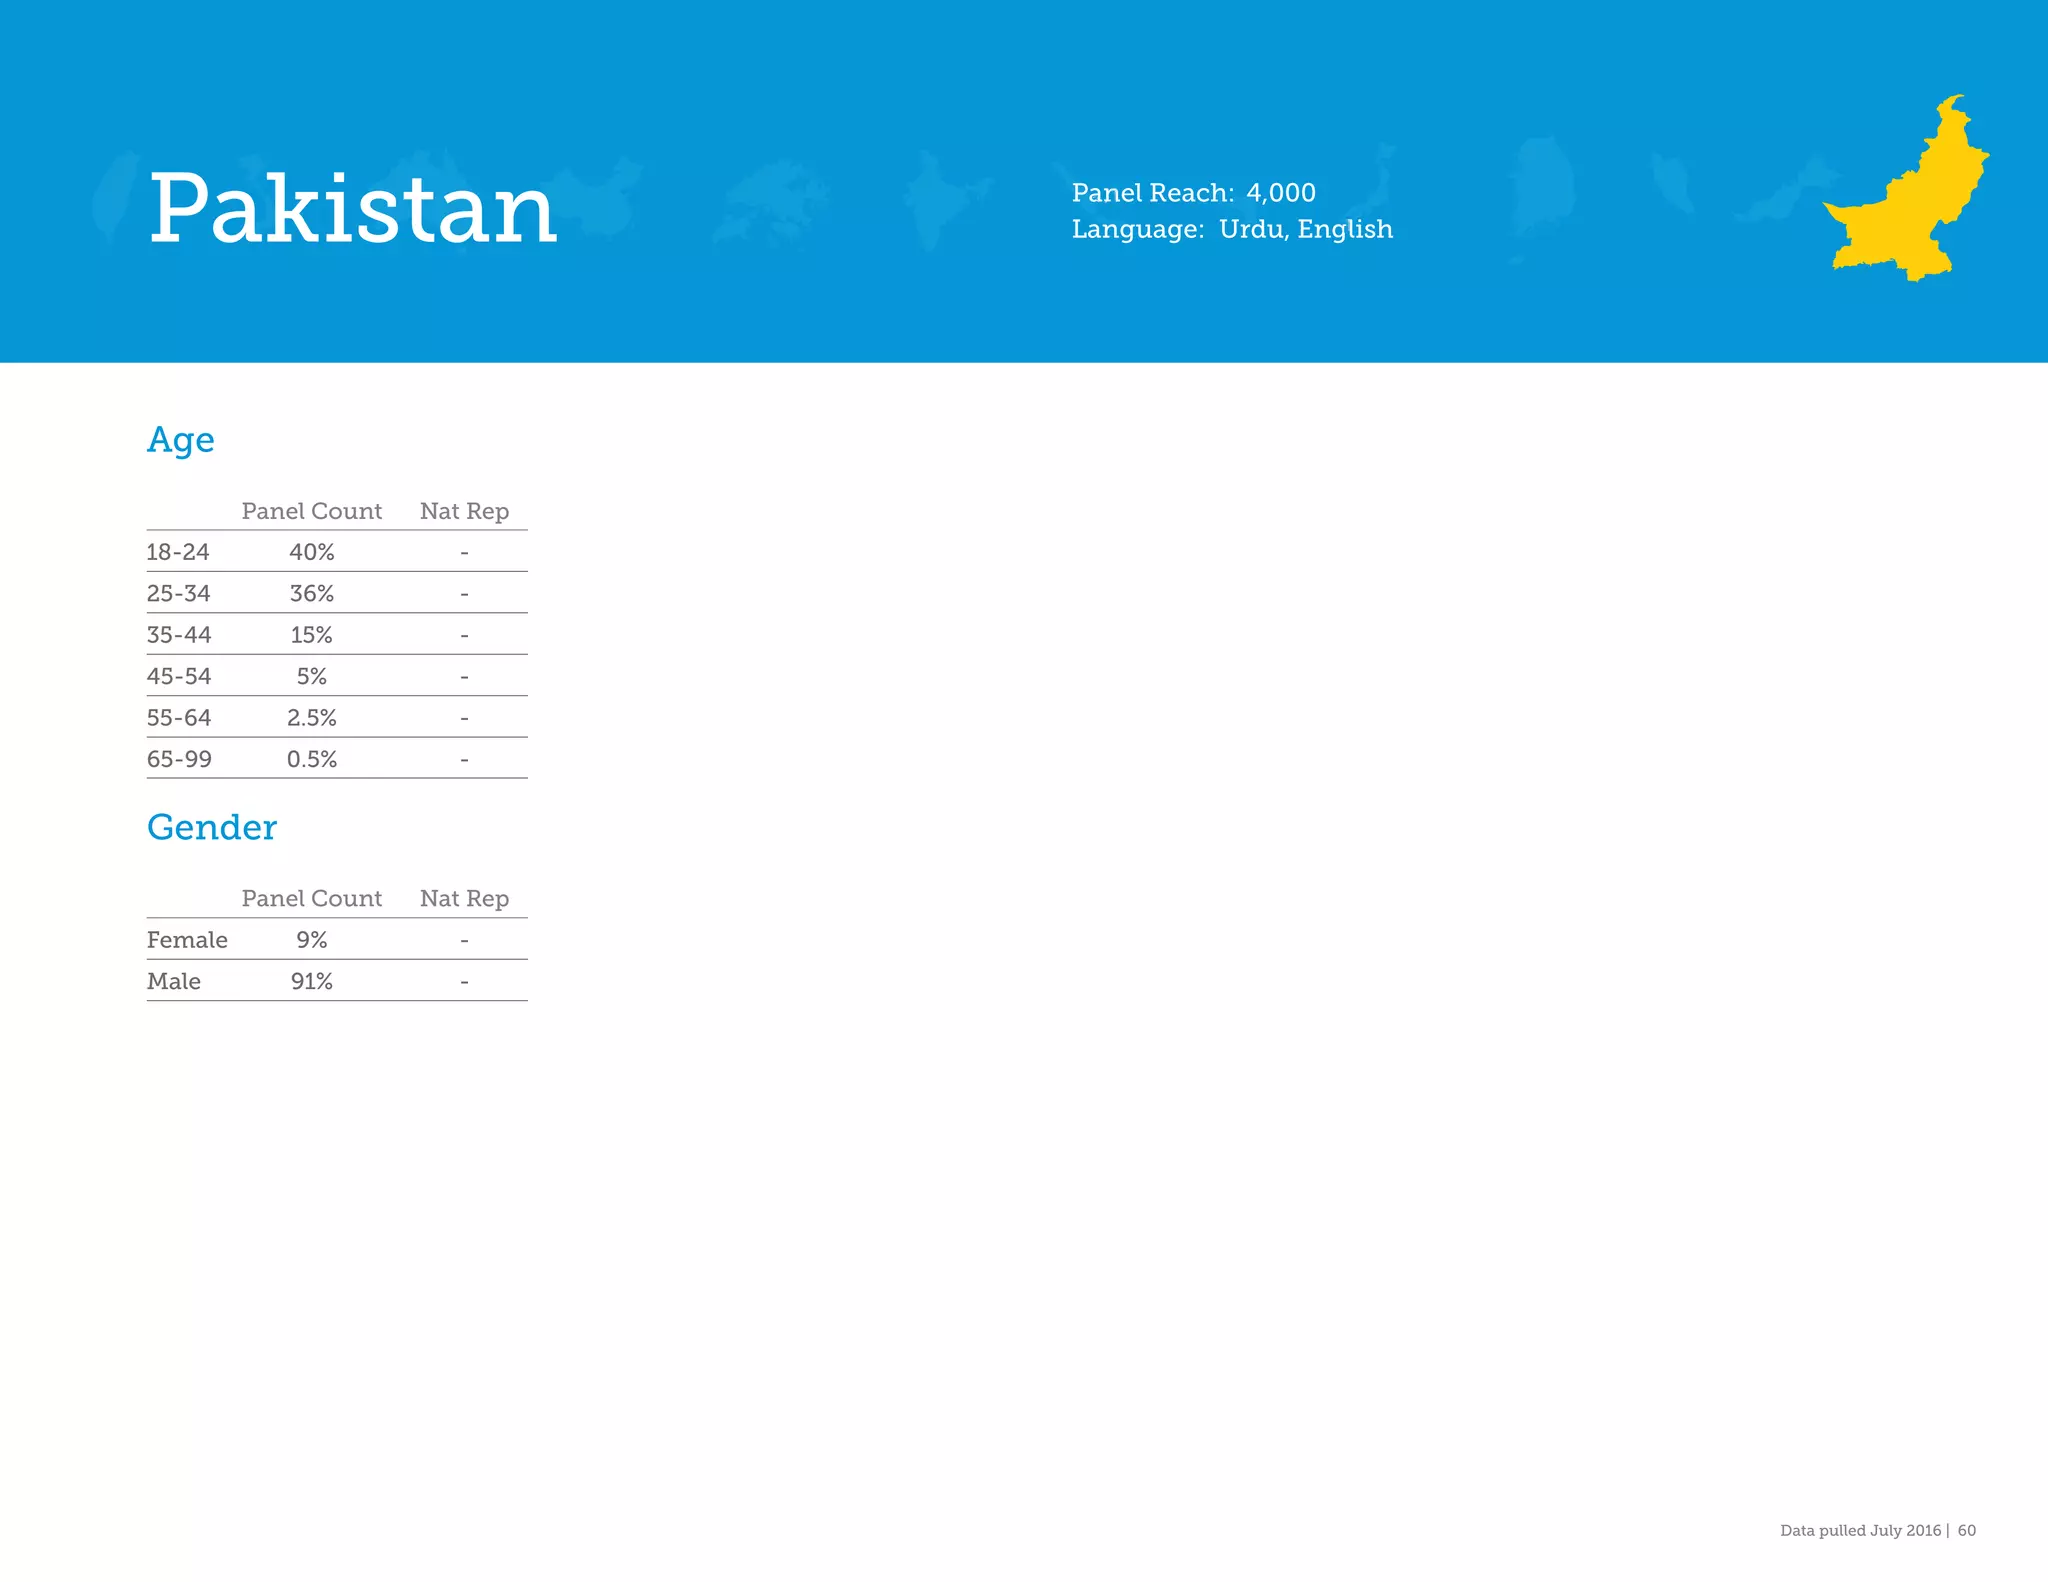
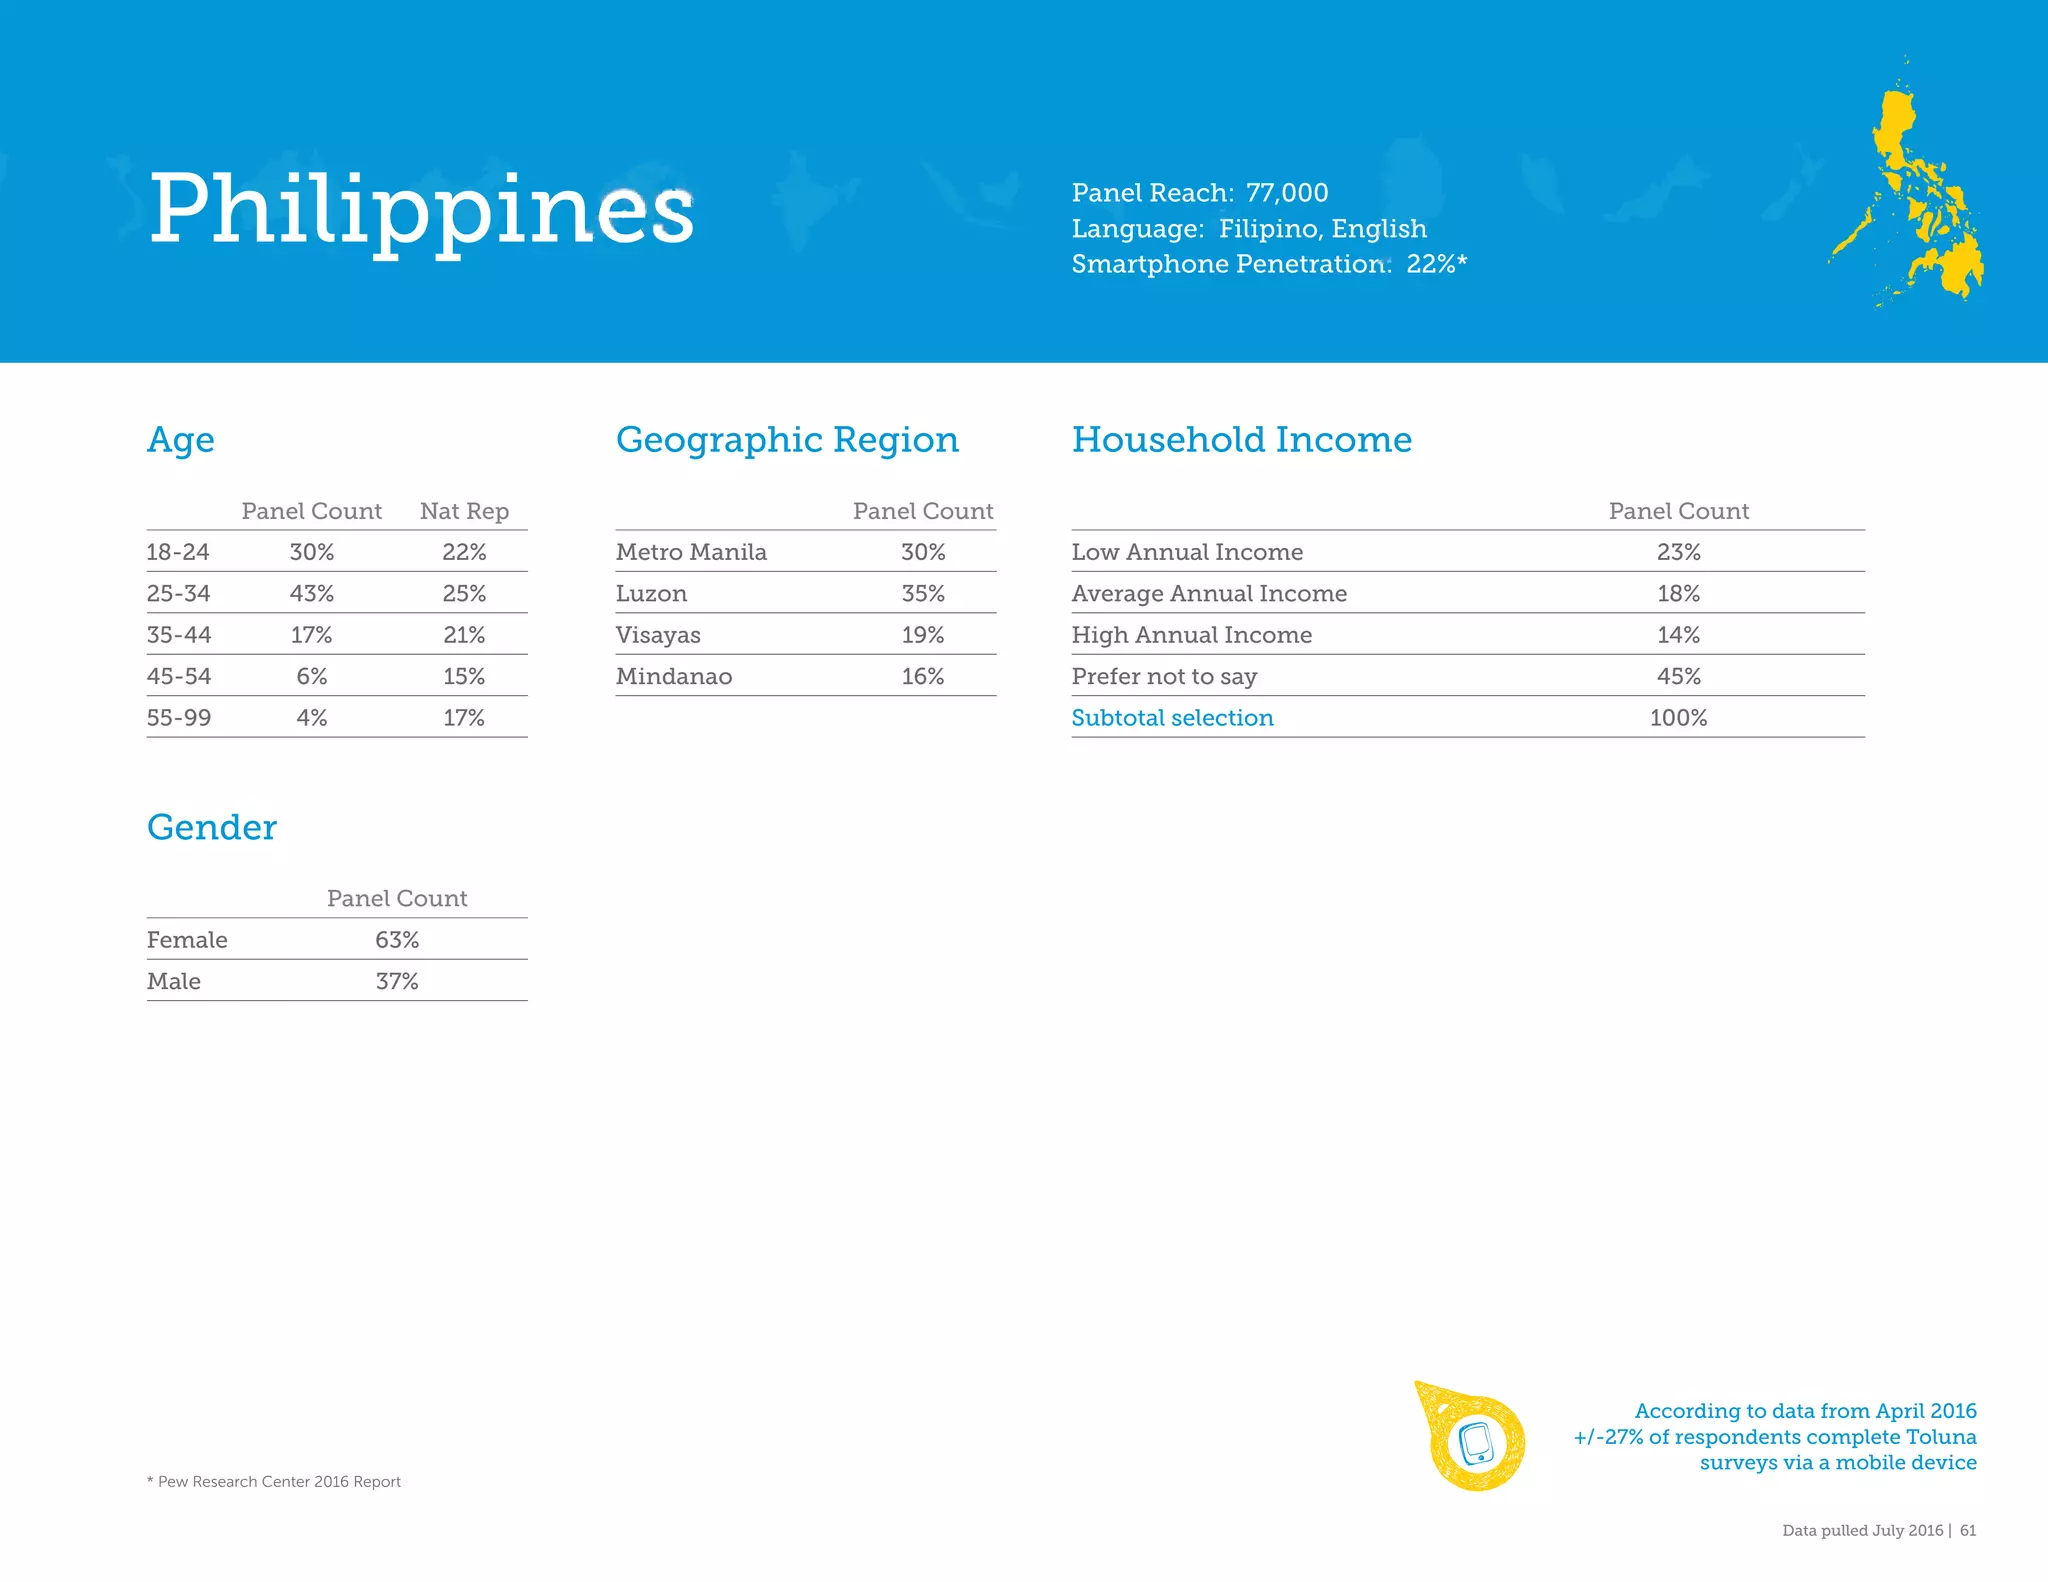
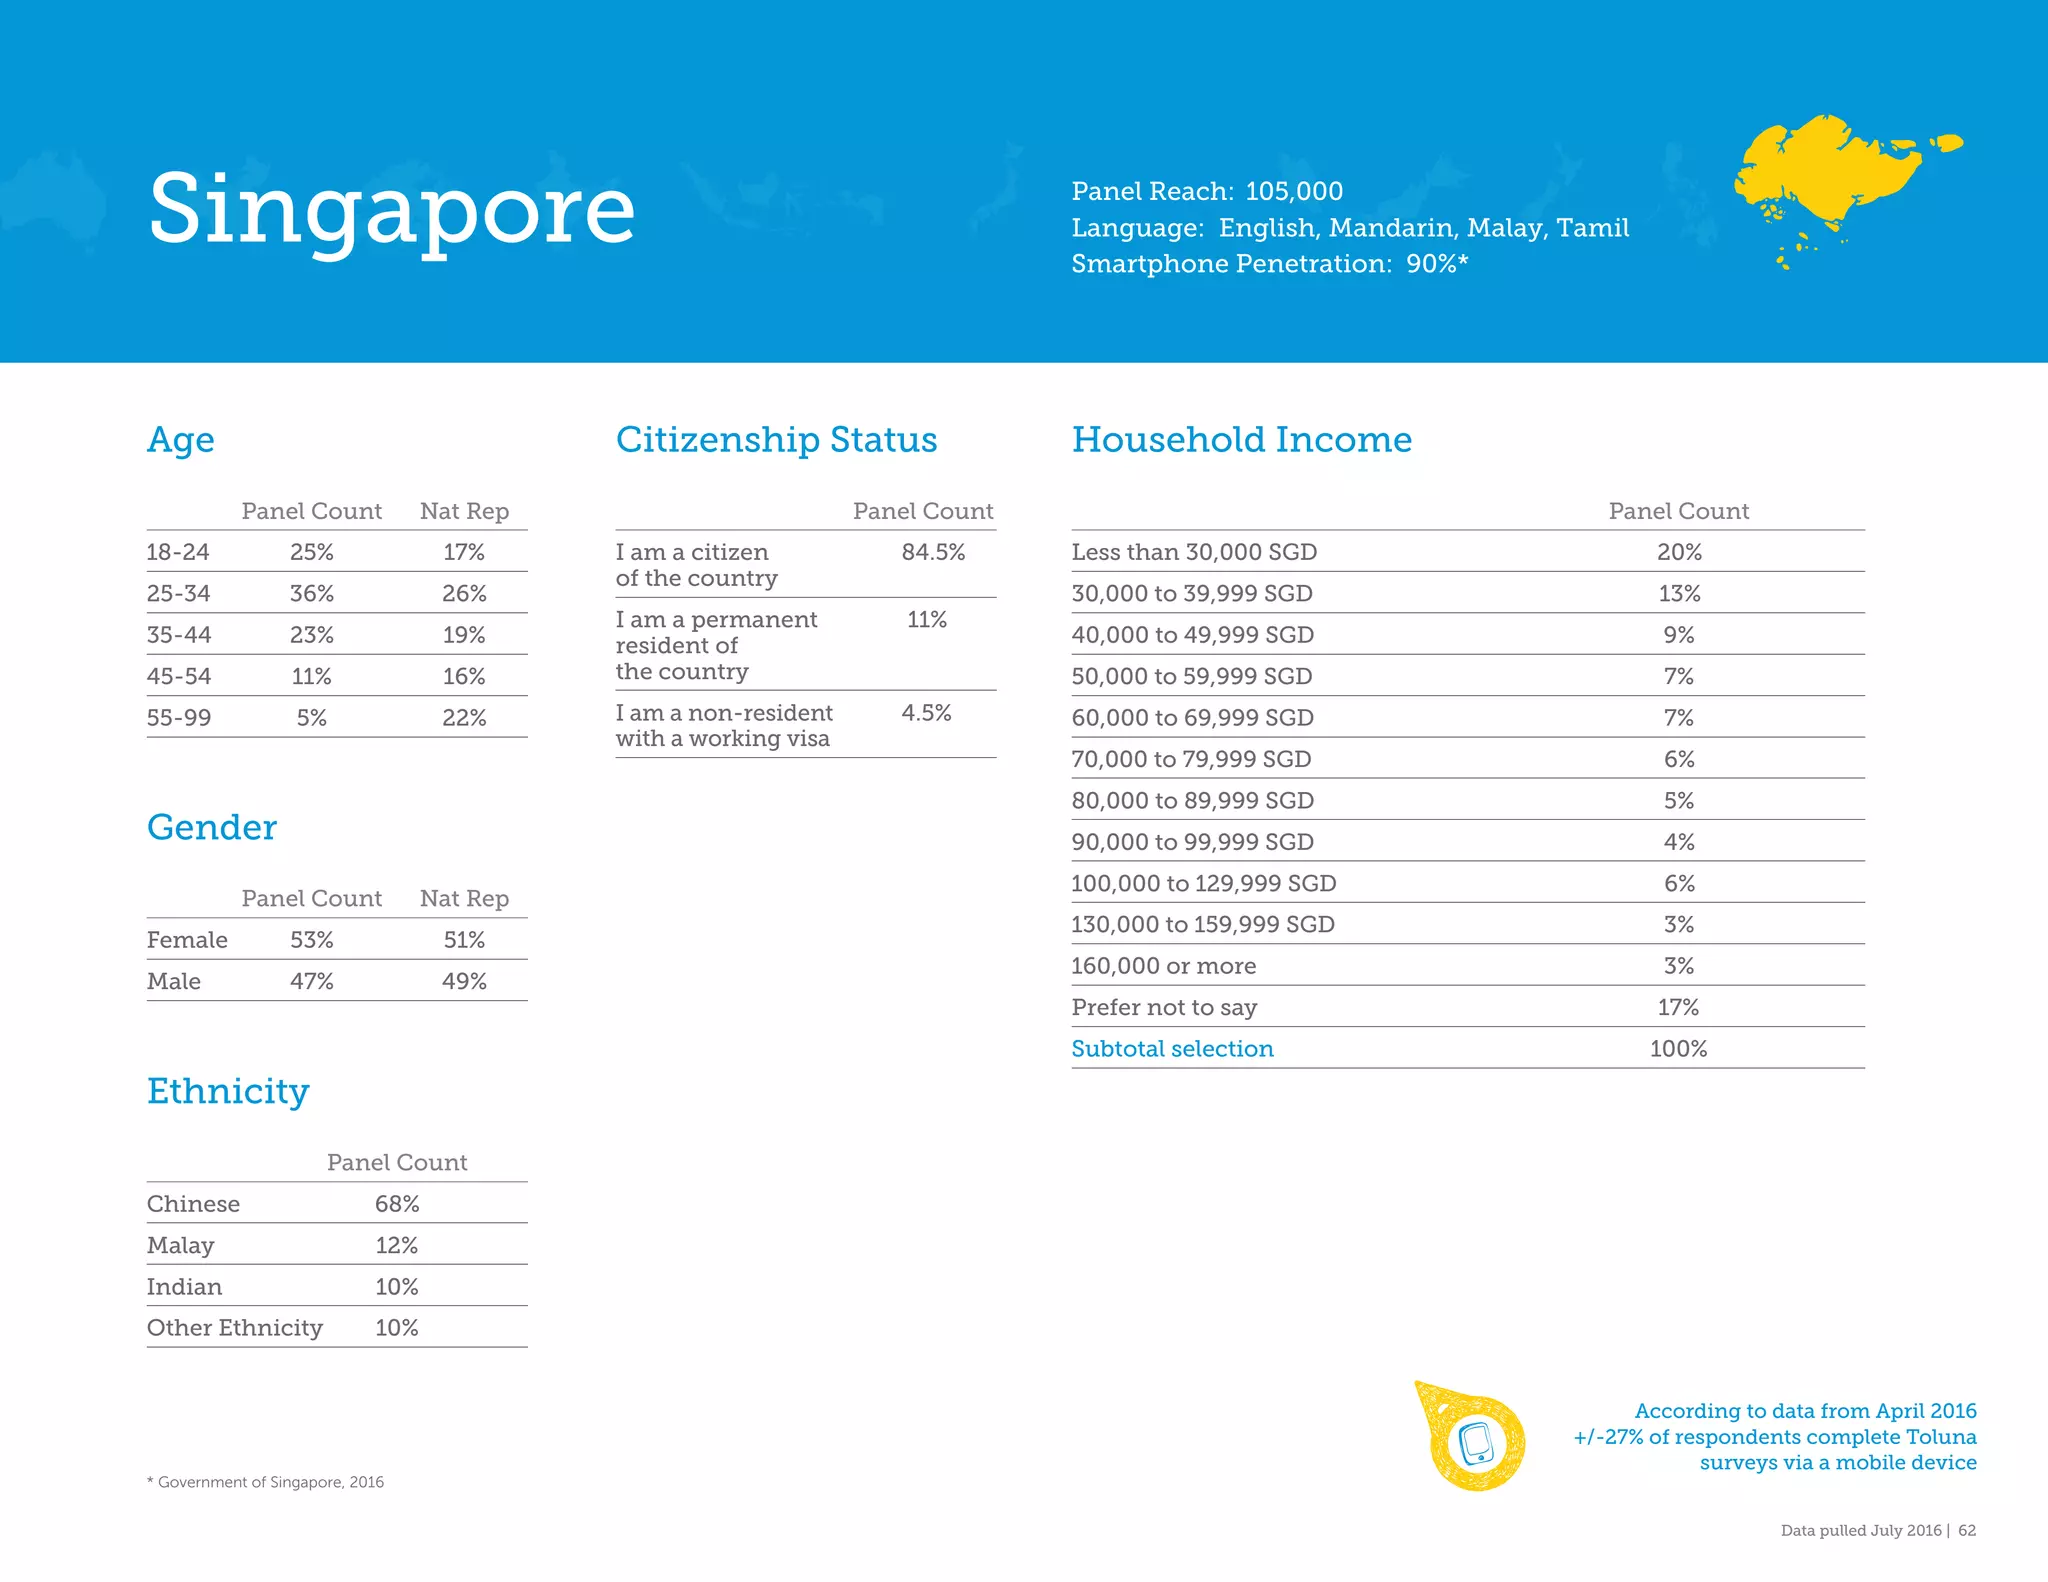
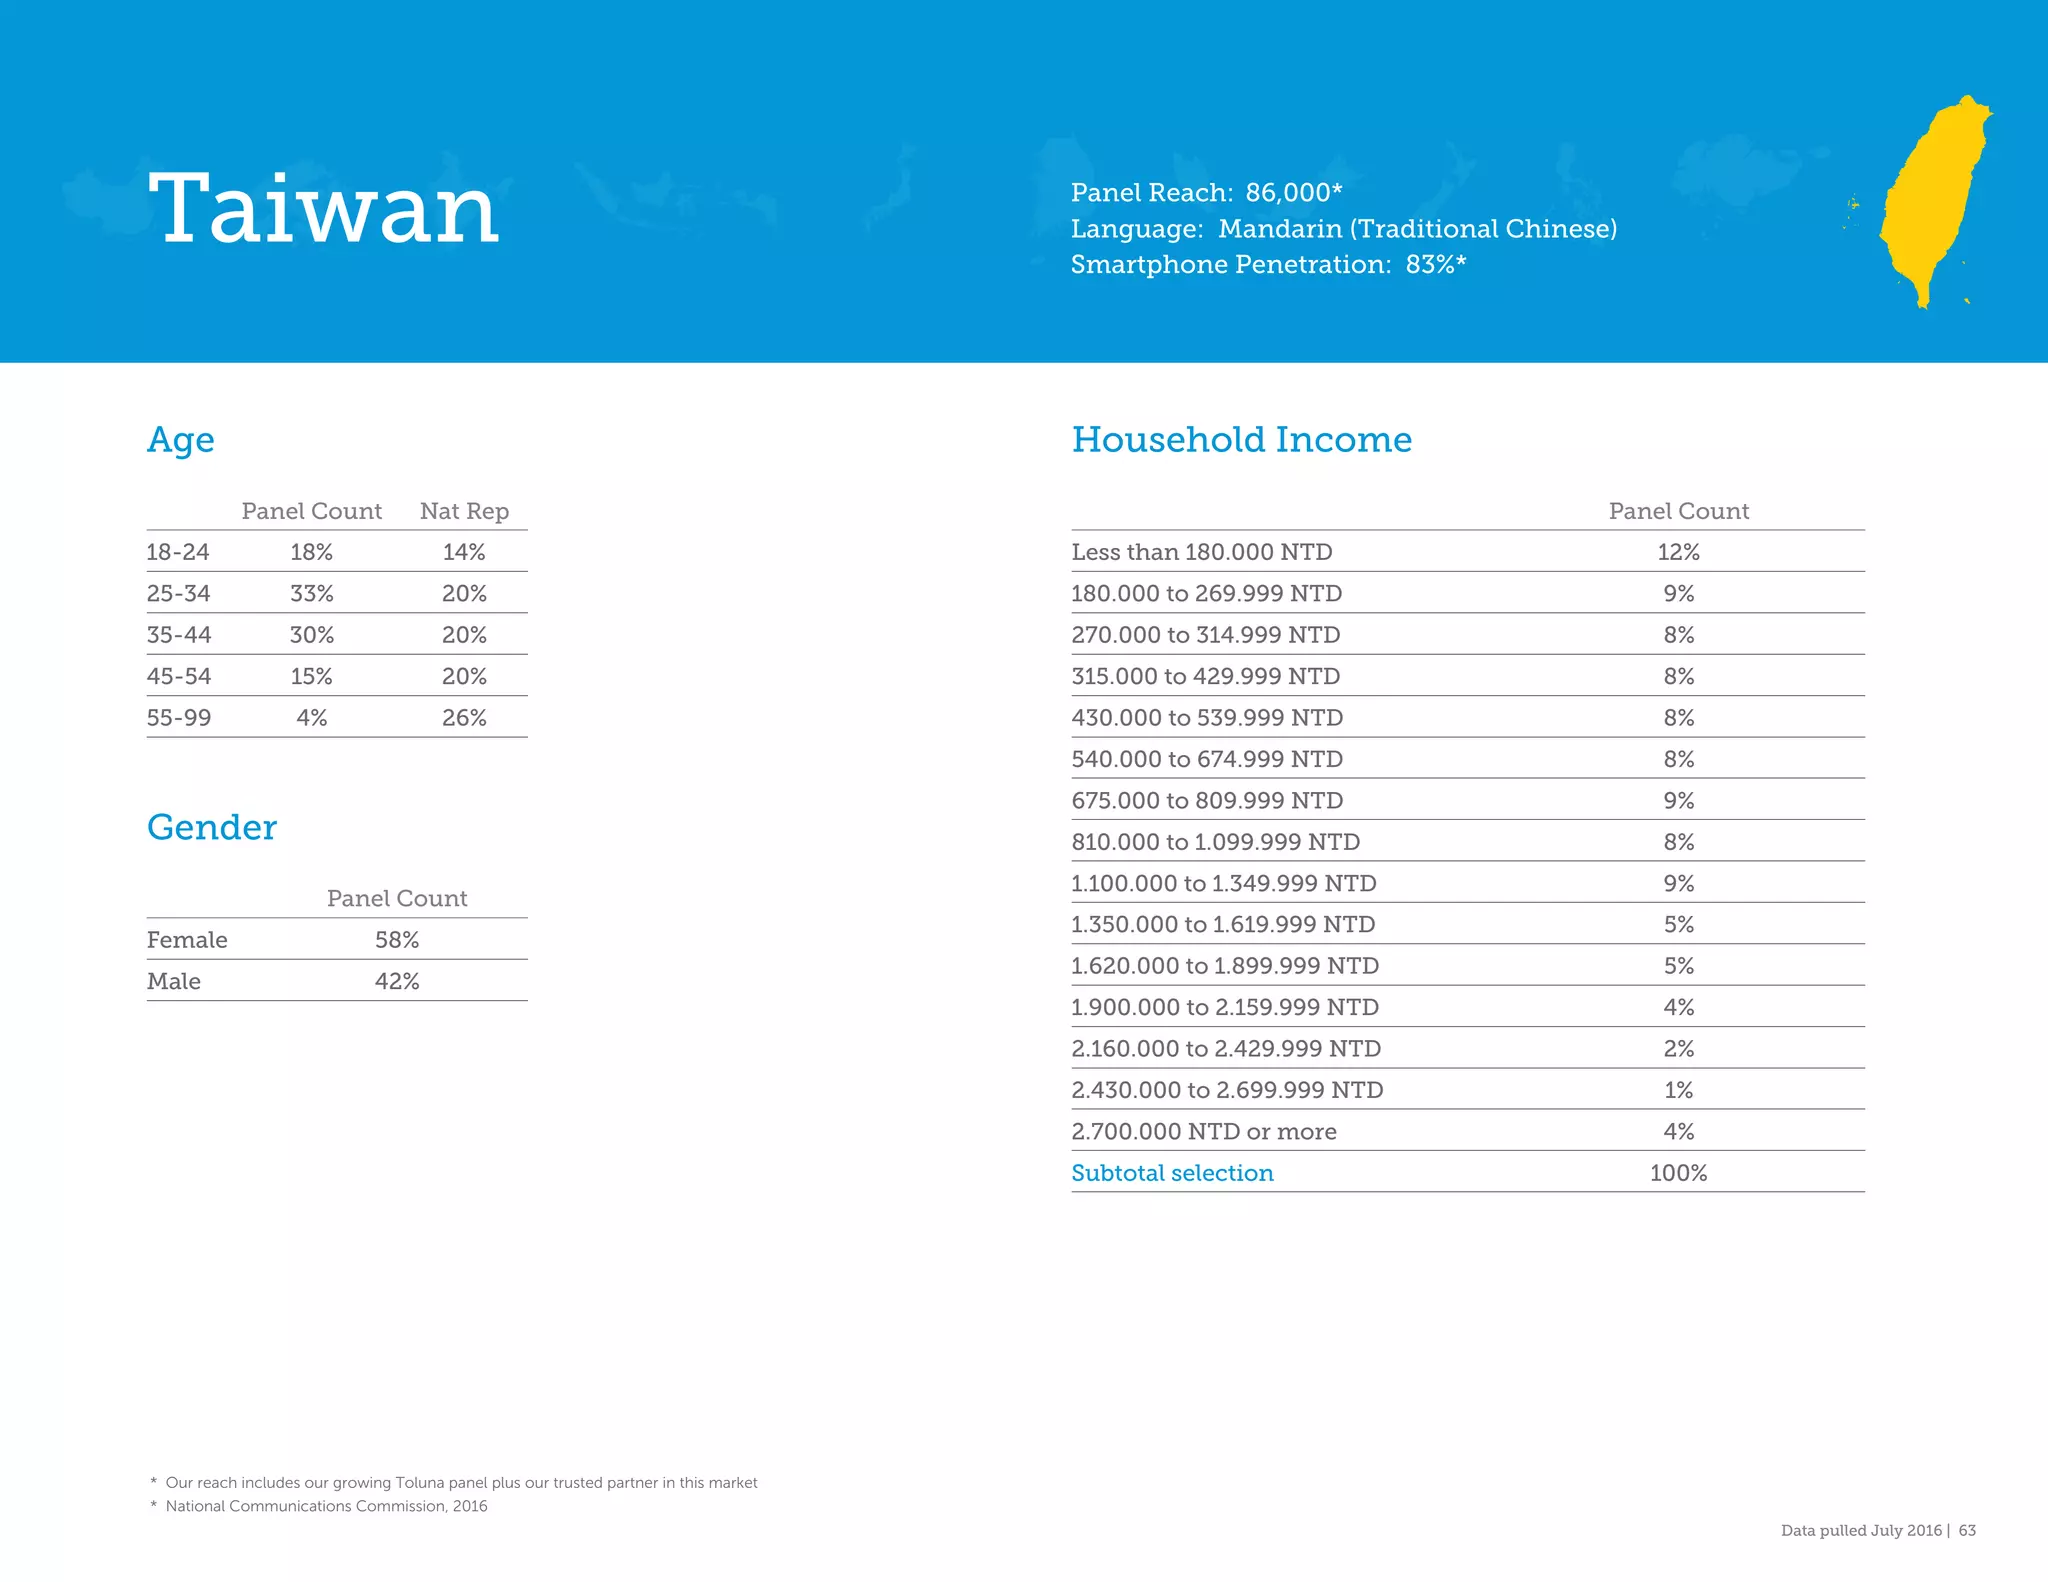
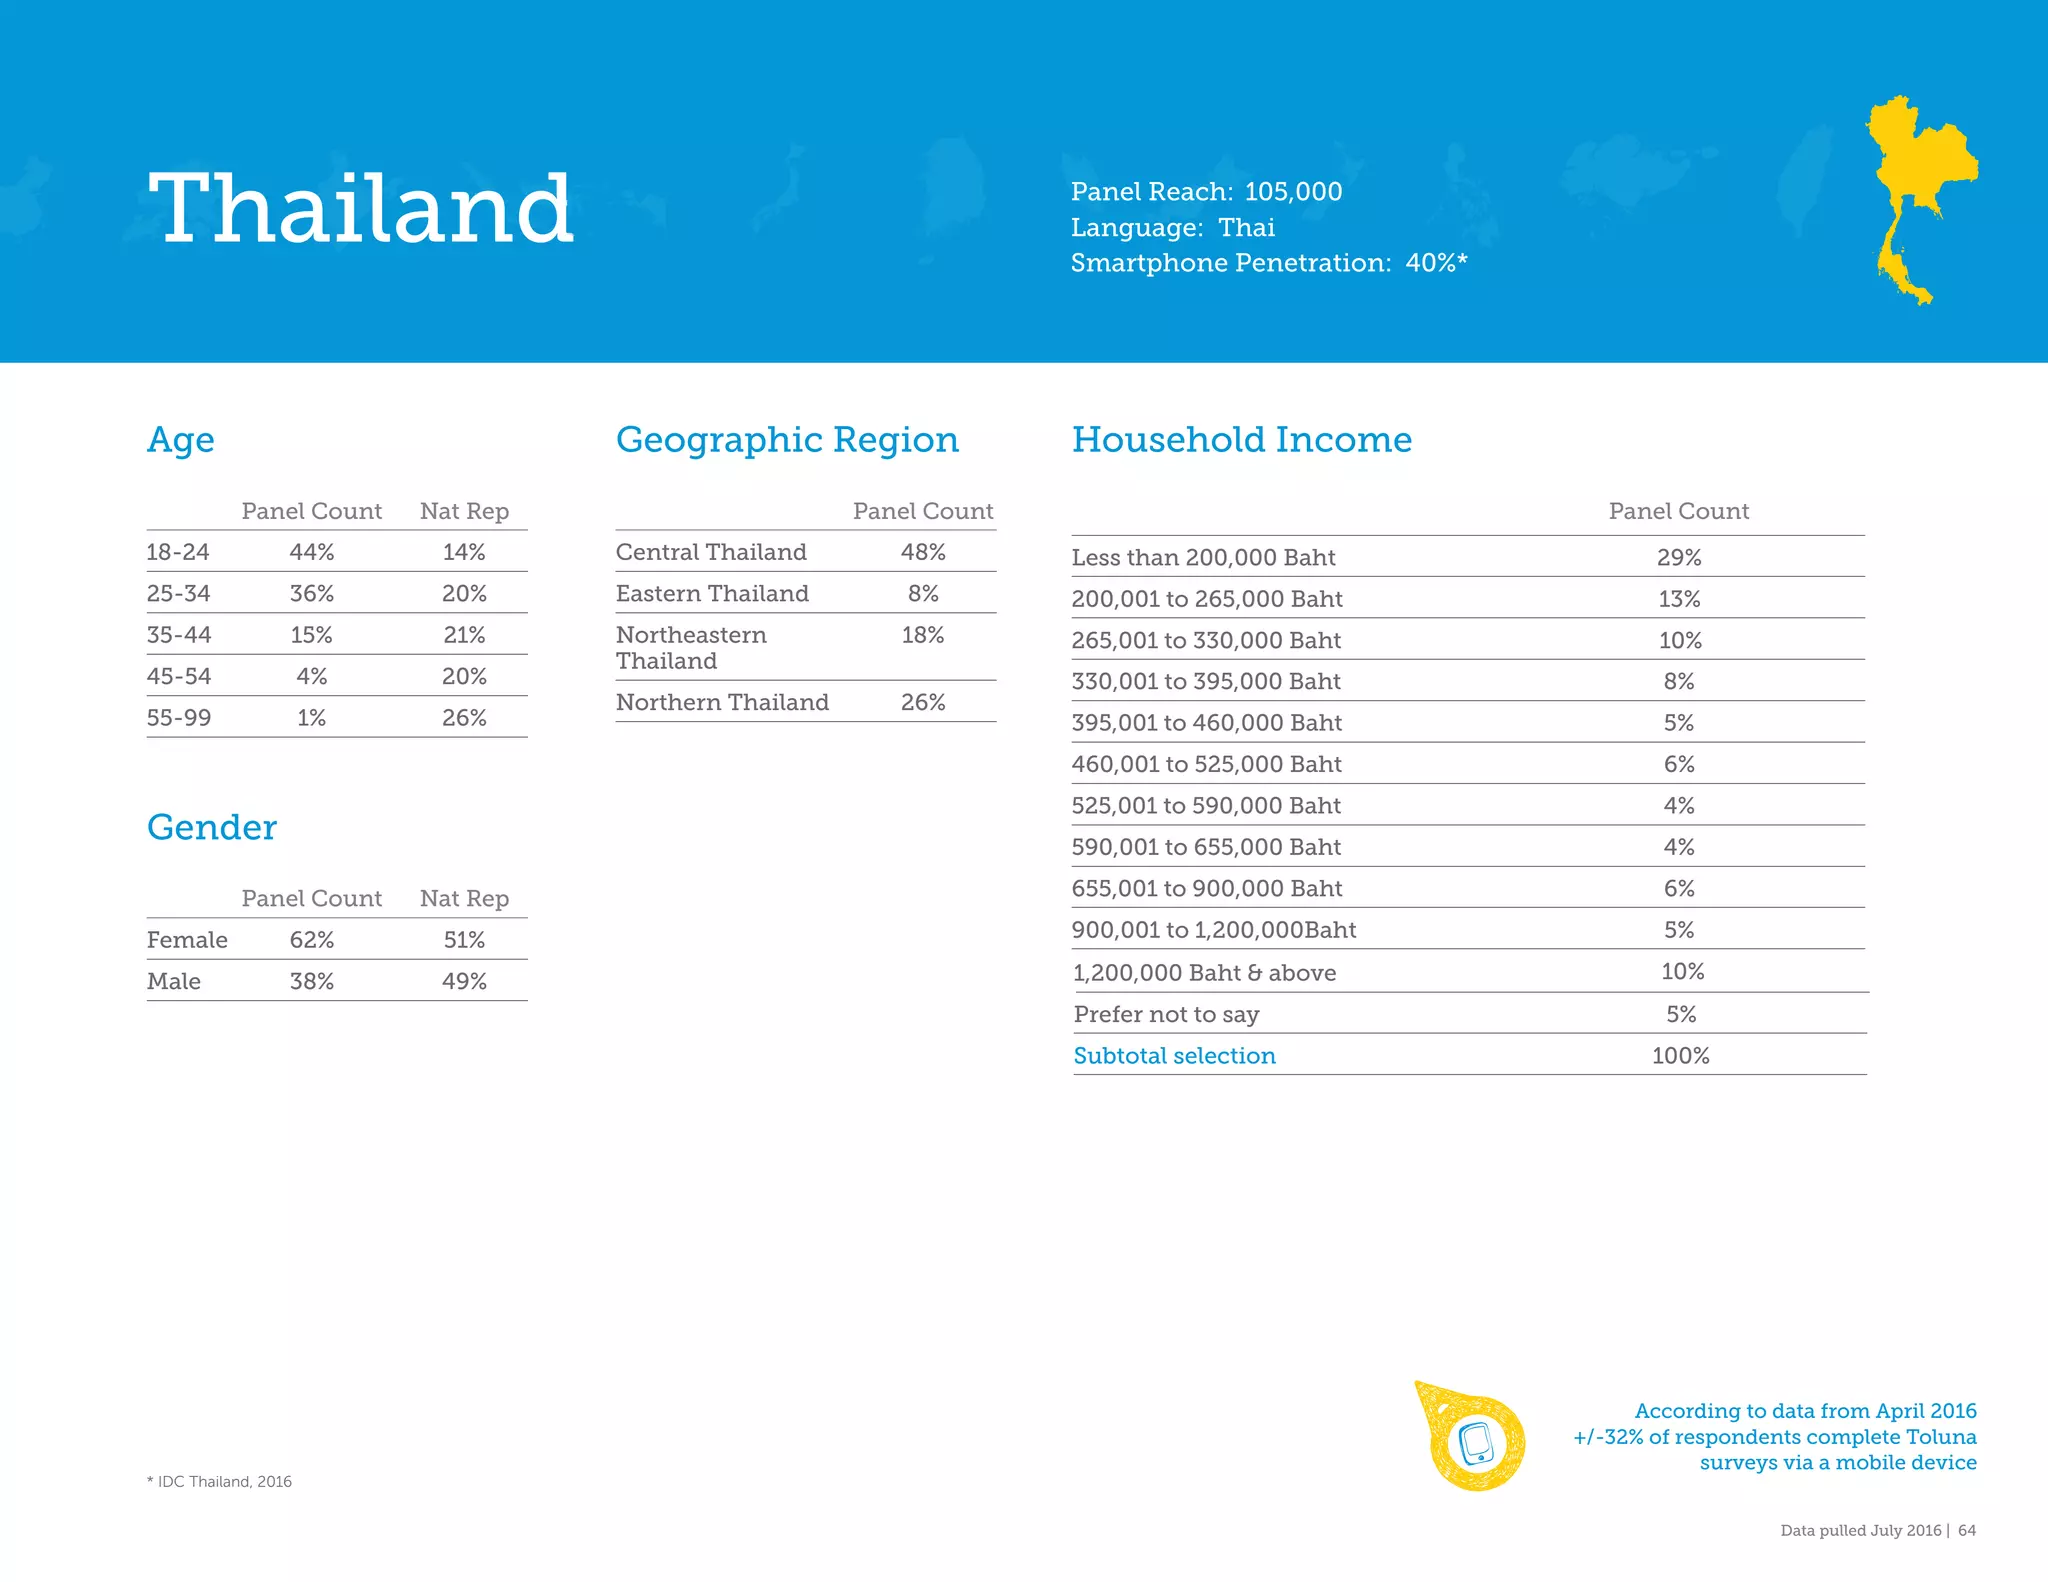
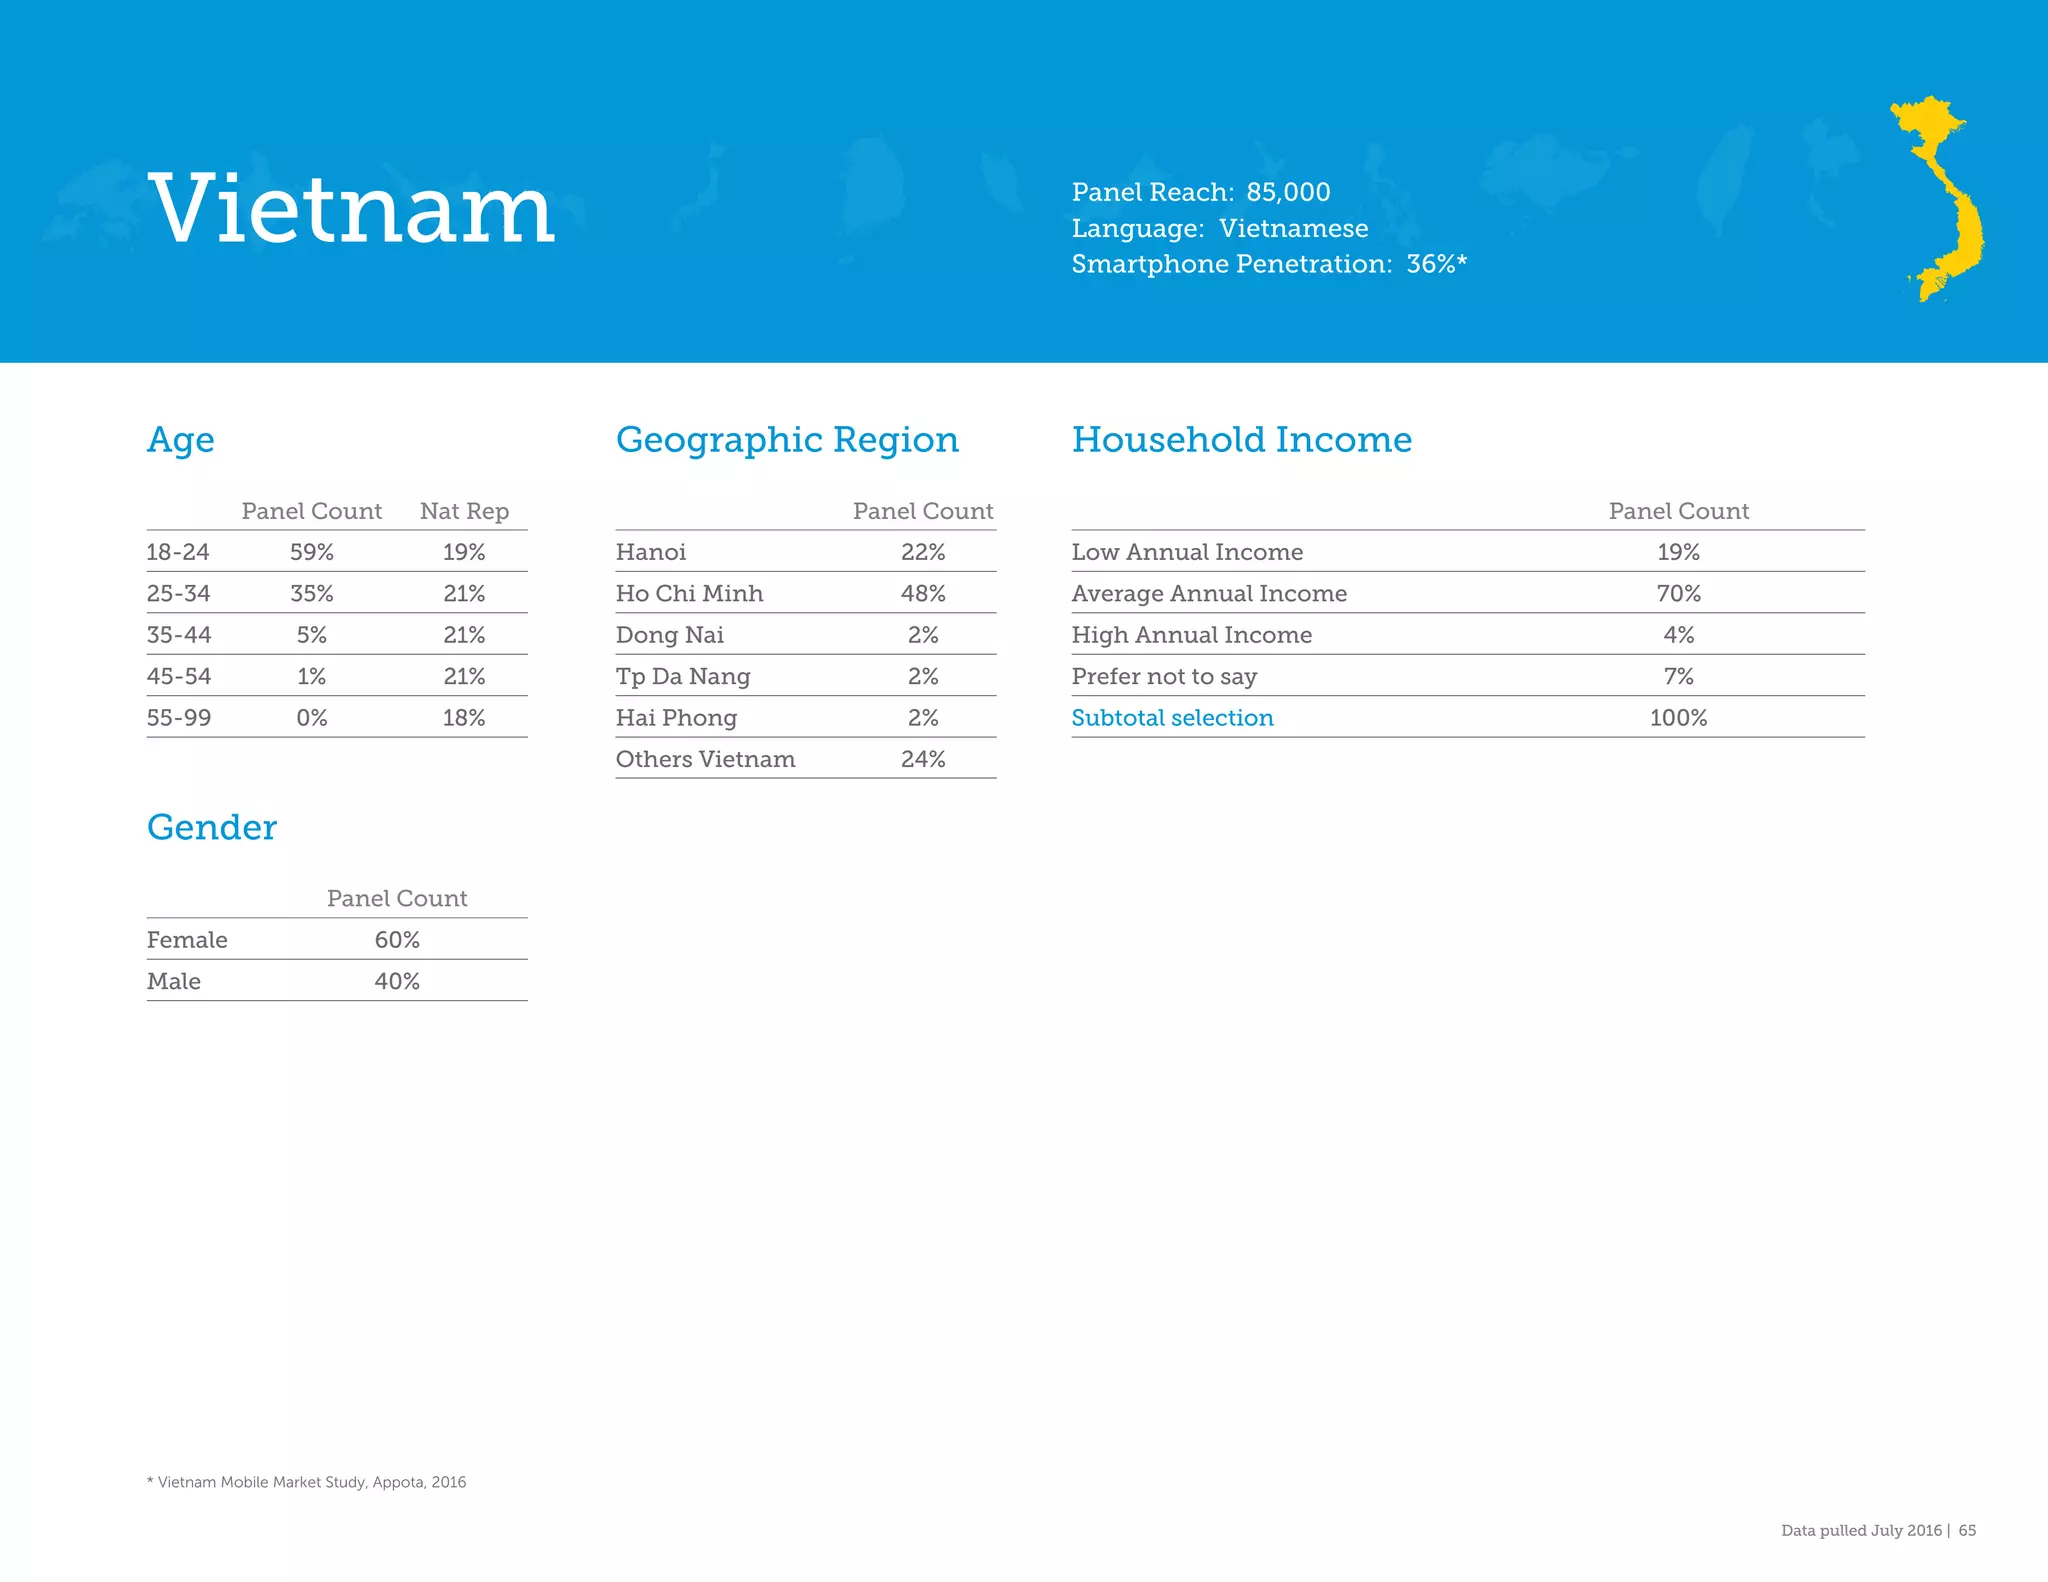


The document provides demographic information about Toluna panel members in various countries in Asia Pacific (APAC). It includes data on age, gender, geographic region, household income, panel size, language, and smartphone penetration for Australia (113,000 members), China (1,455,000 members), Hong Kong (100,000 members), India (150,000 members), Indonesia (117,000 members), Japan (210,000 members), and South Korea (245,000 members). The document indicates that Toluna has a total of over 10 million panel members globally, with approximately 3 million members each in Europe, the Middle East, and Africa, as well as Asia Pacific and the Americas.