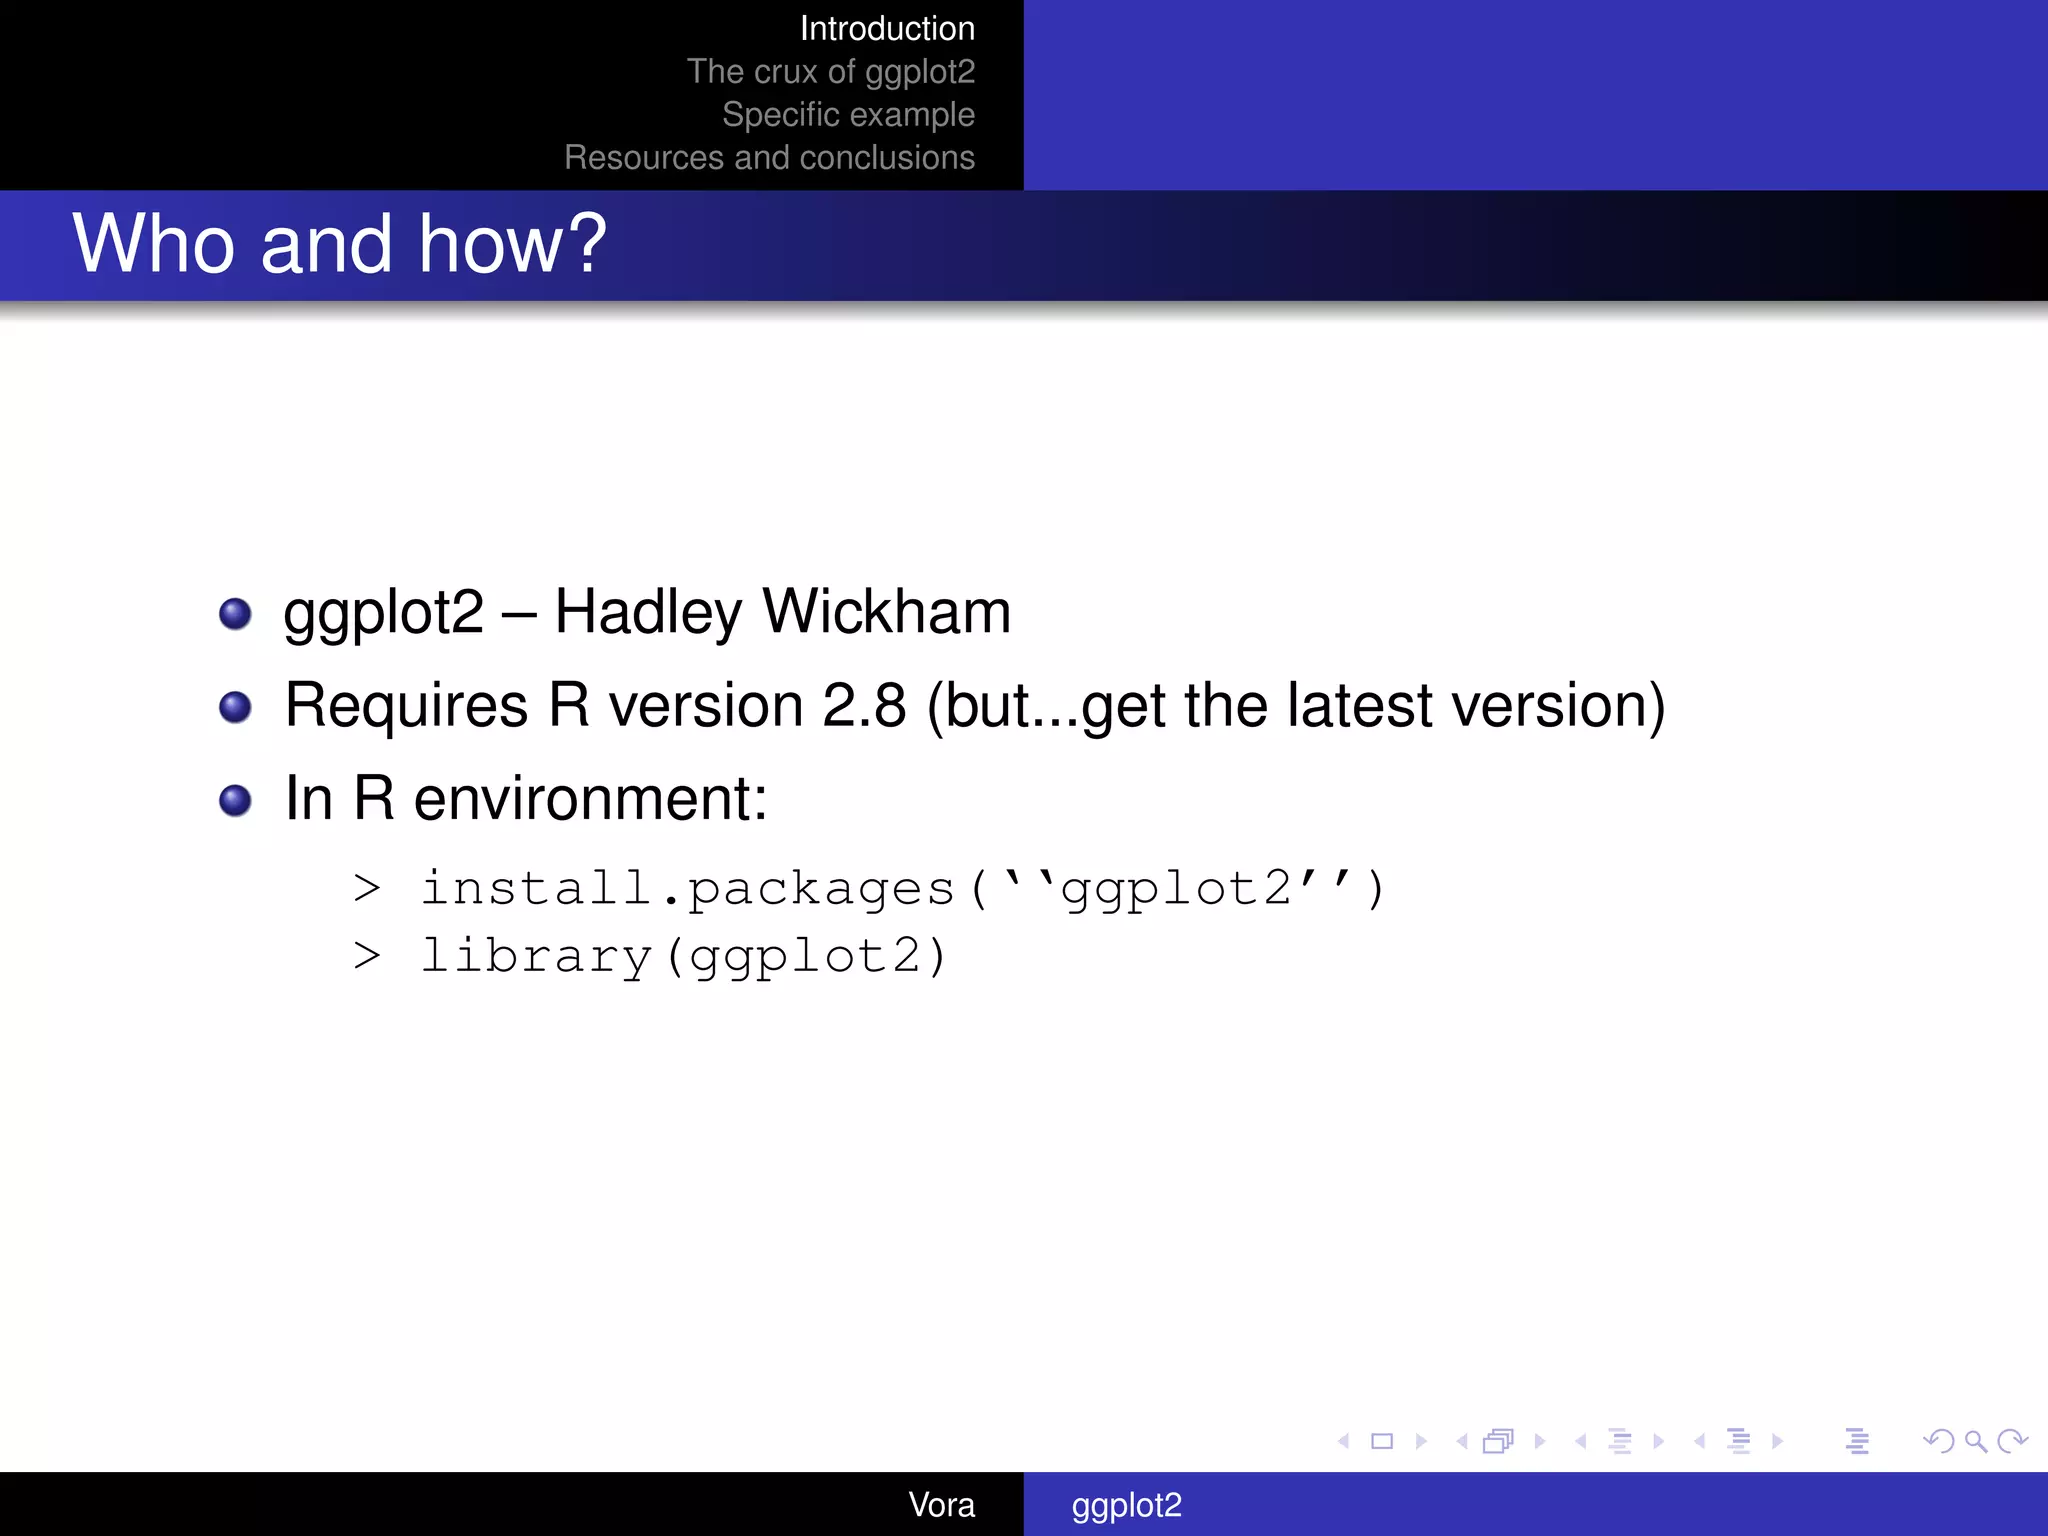
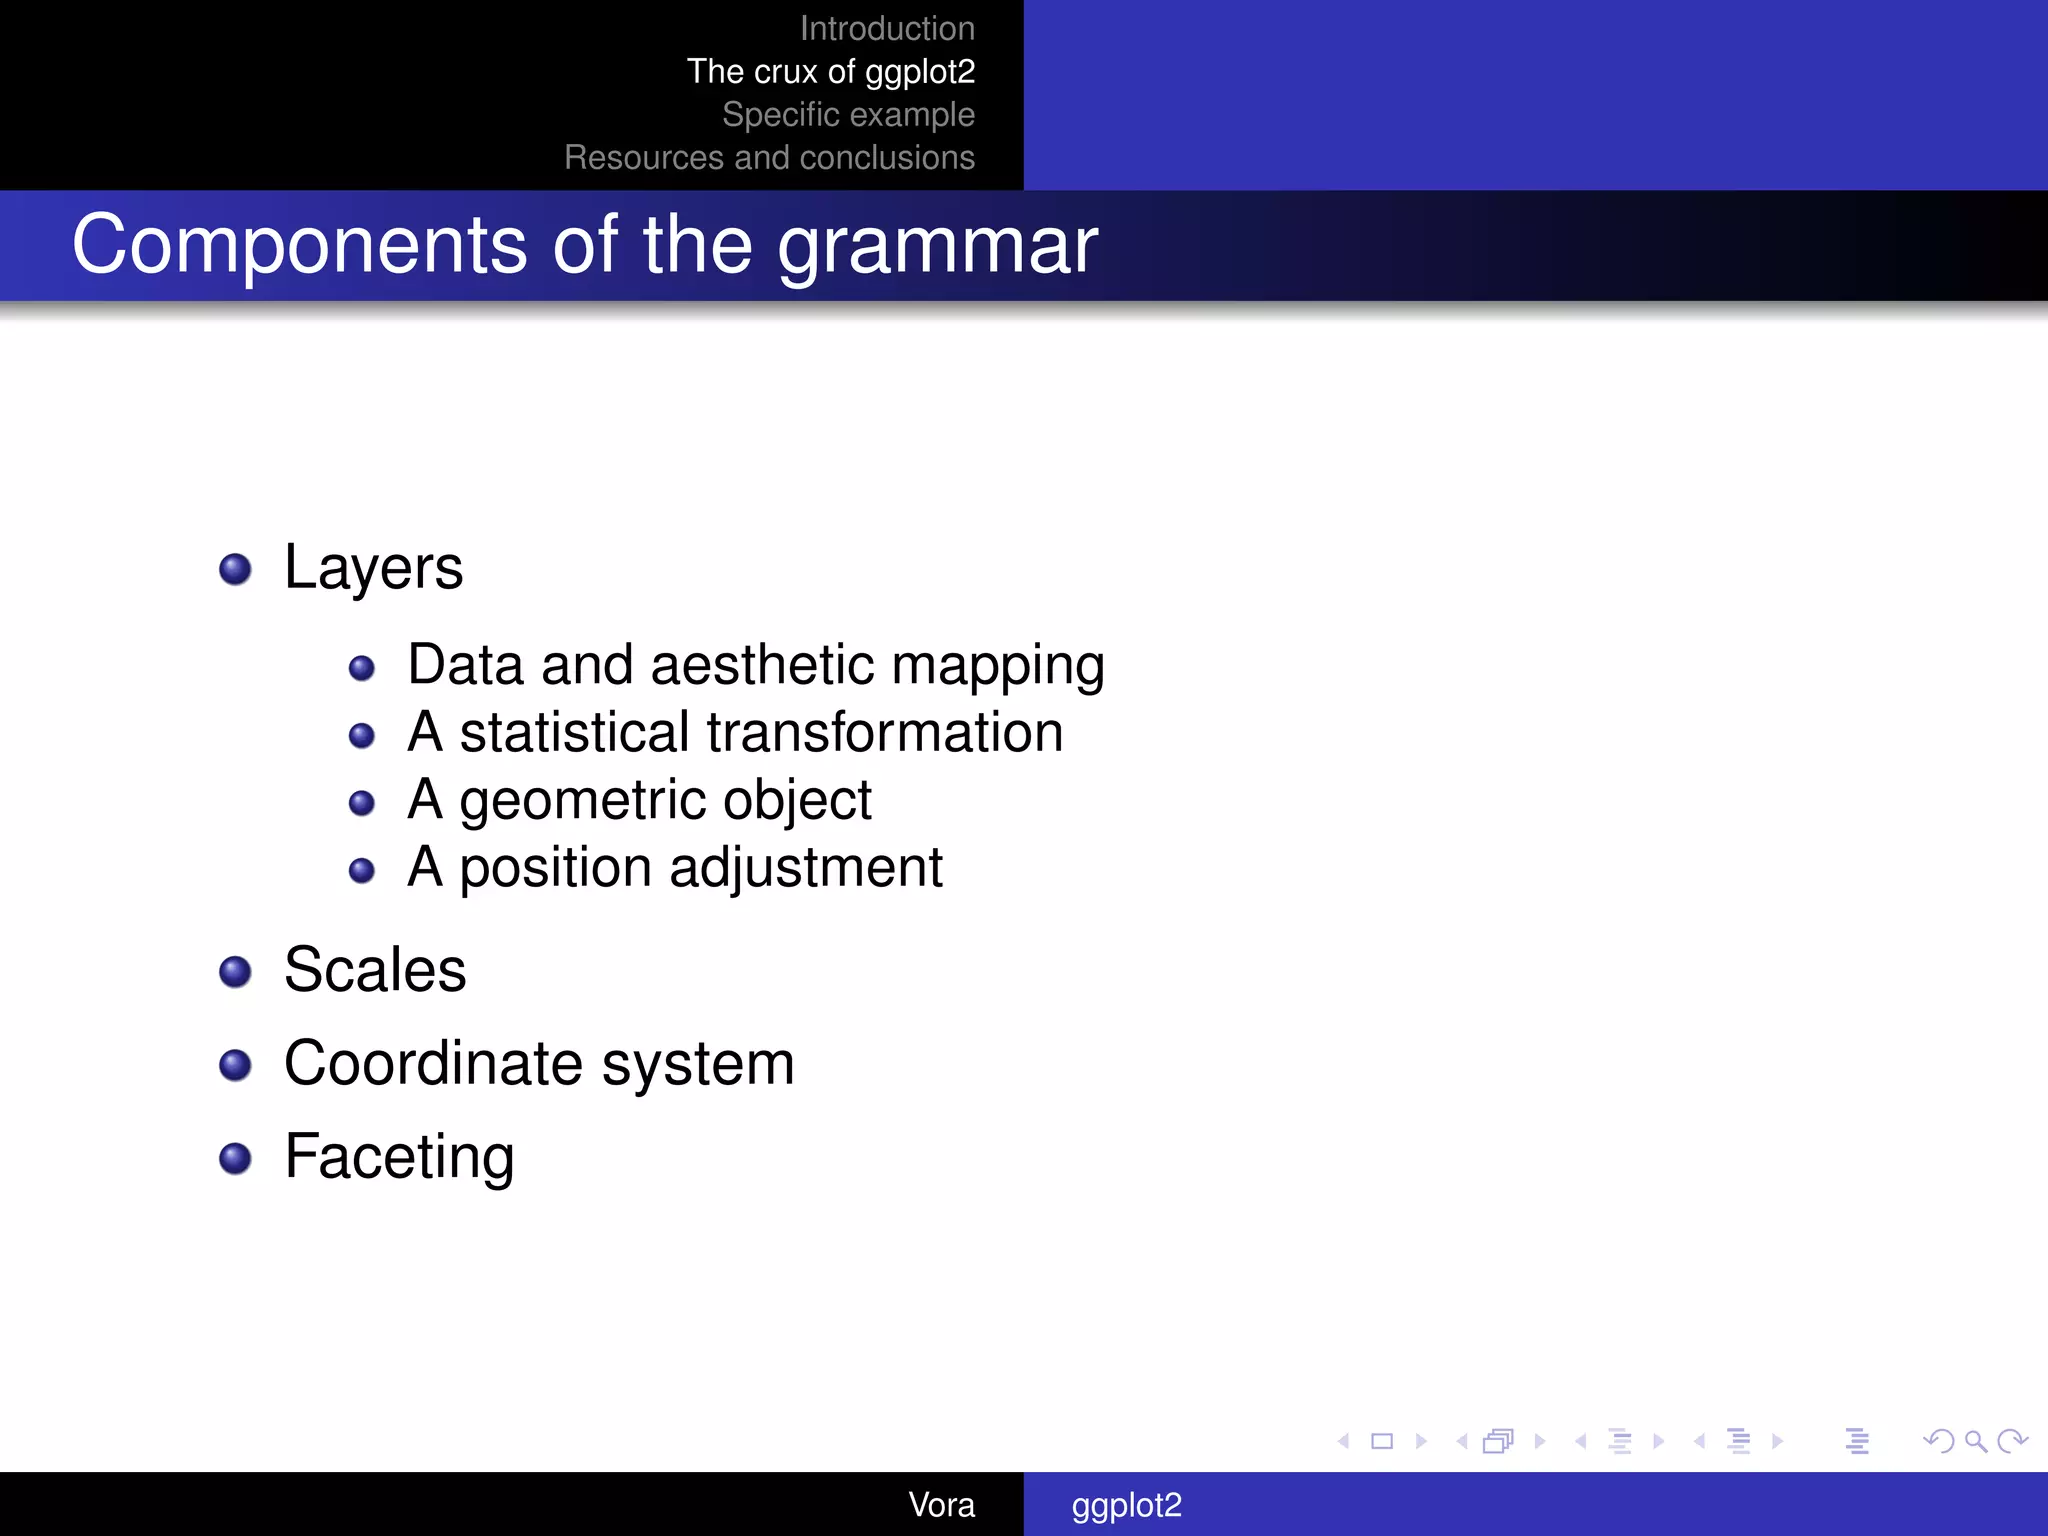
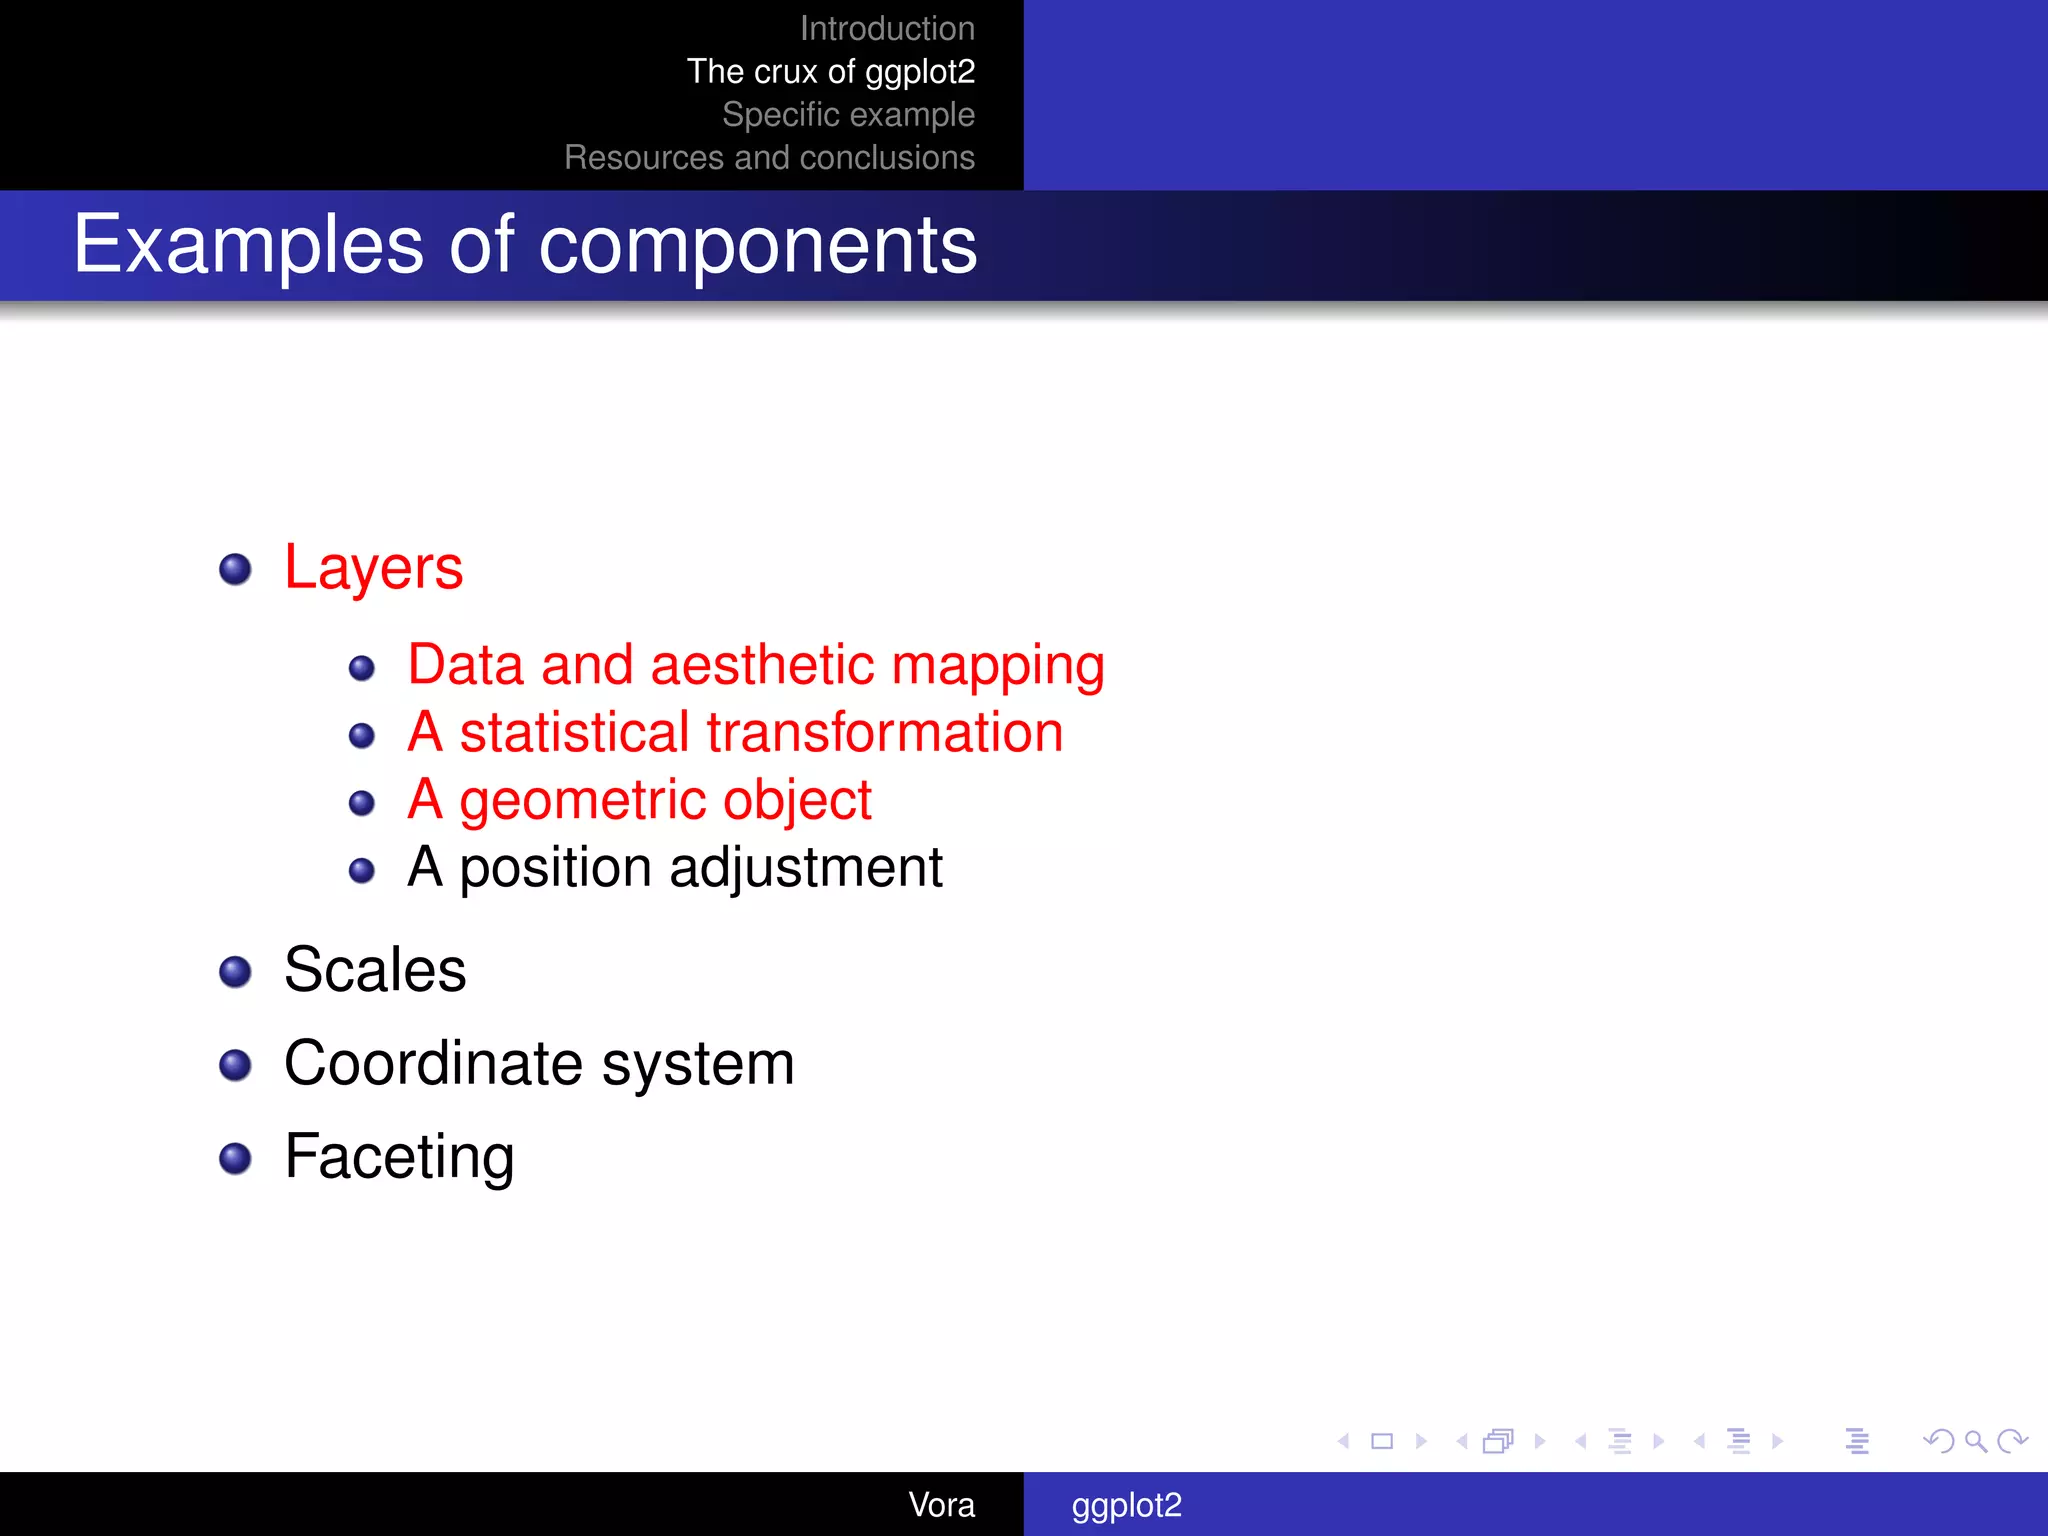
The document introduces ggplot2, an R package for creating statistical graphics based on the 'grammar of graphics' concept. It outlines its components, such as layers, aesthetic mapping, and provides code examples for plotting economic data including deficits and surpluses. Additional resources and references for ggplot2 are also included.
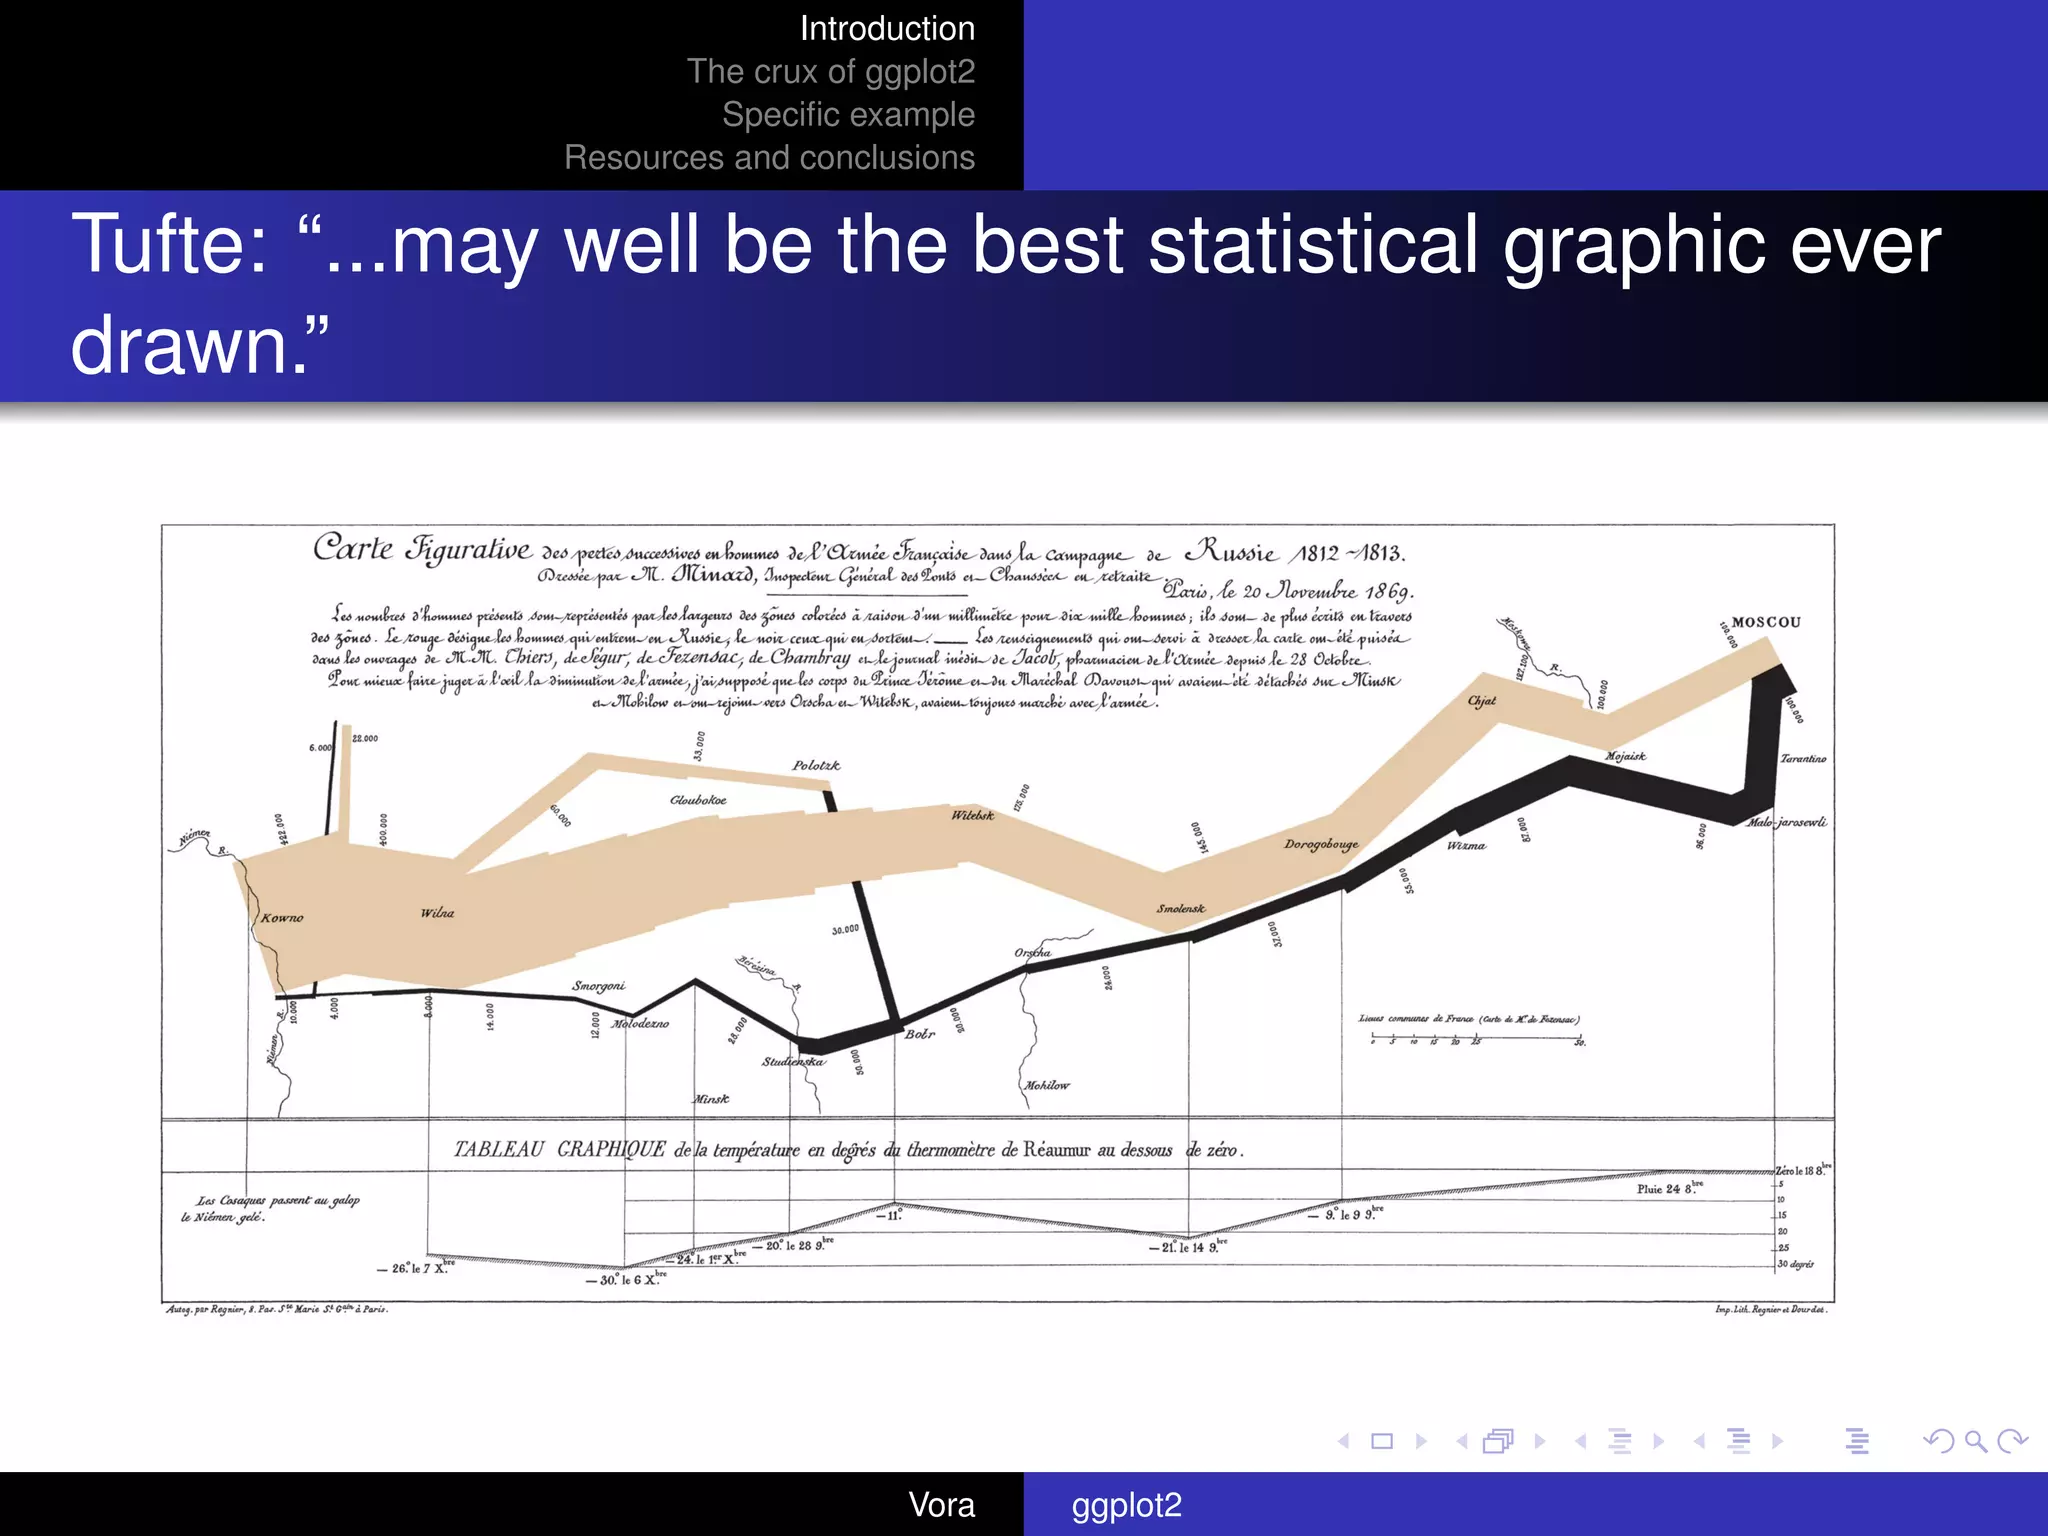
![Introduction
The crux of ggplot2
Specific example
Resources and conclusions
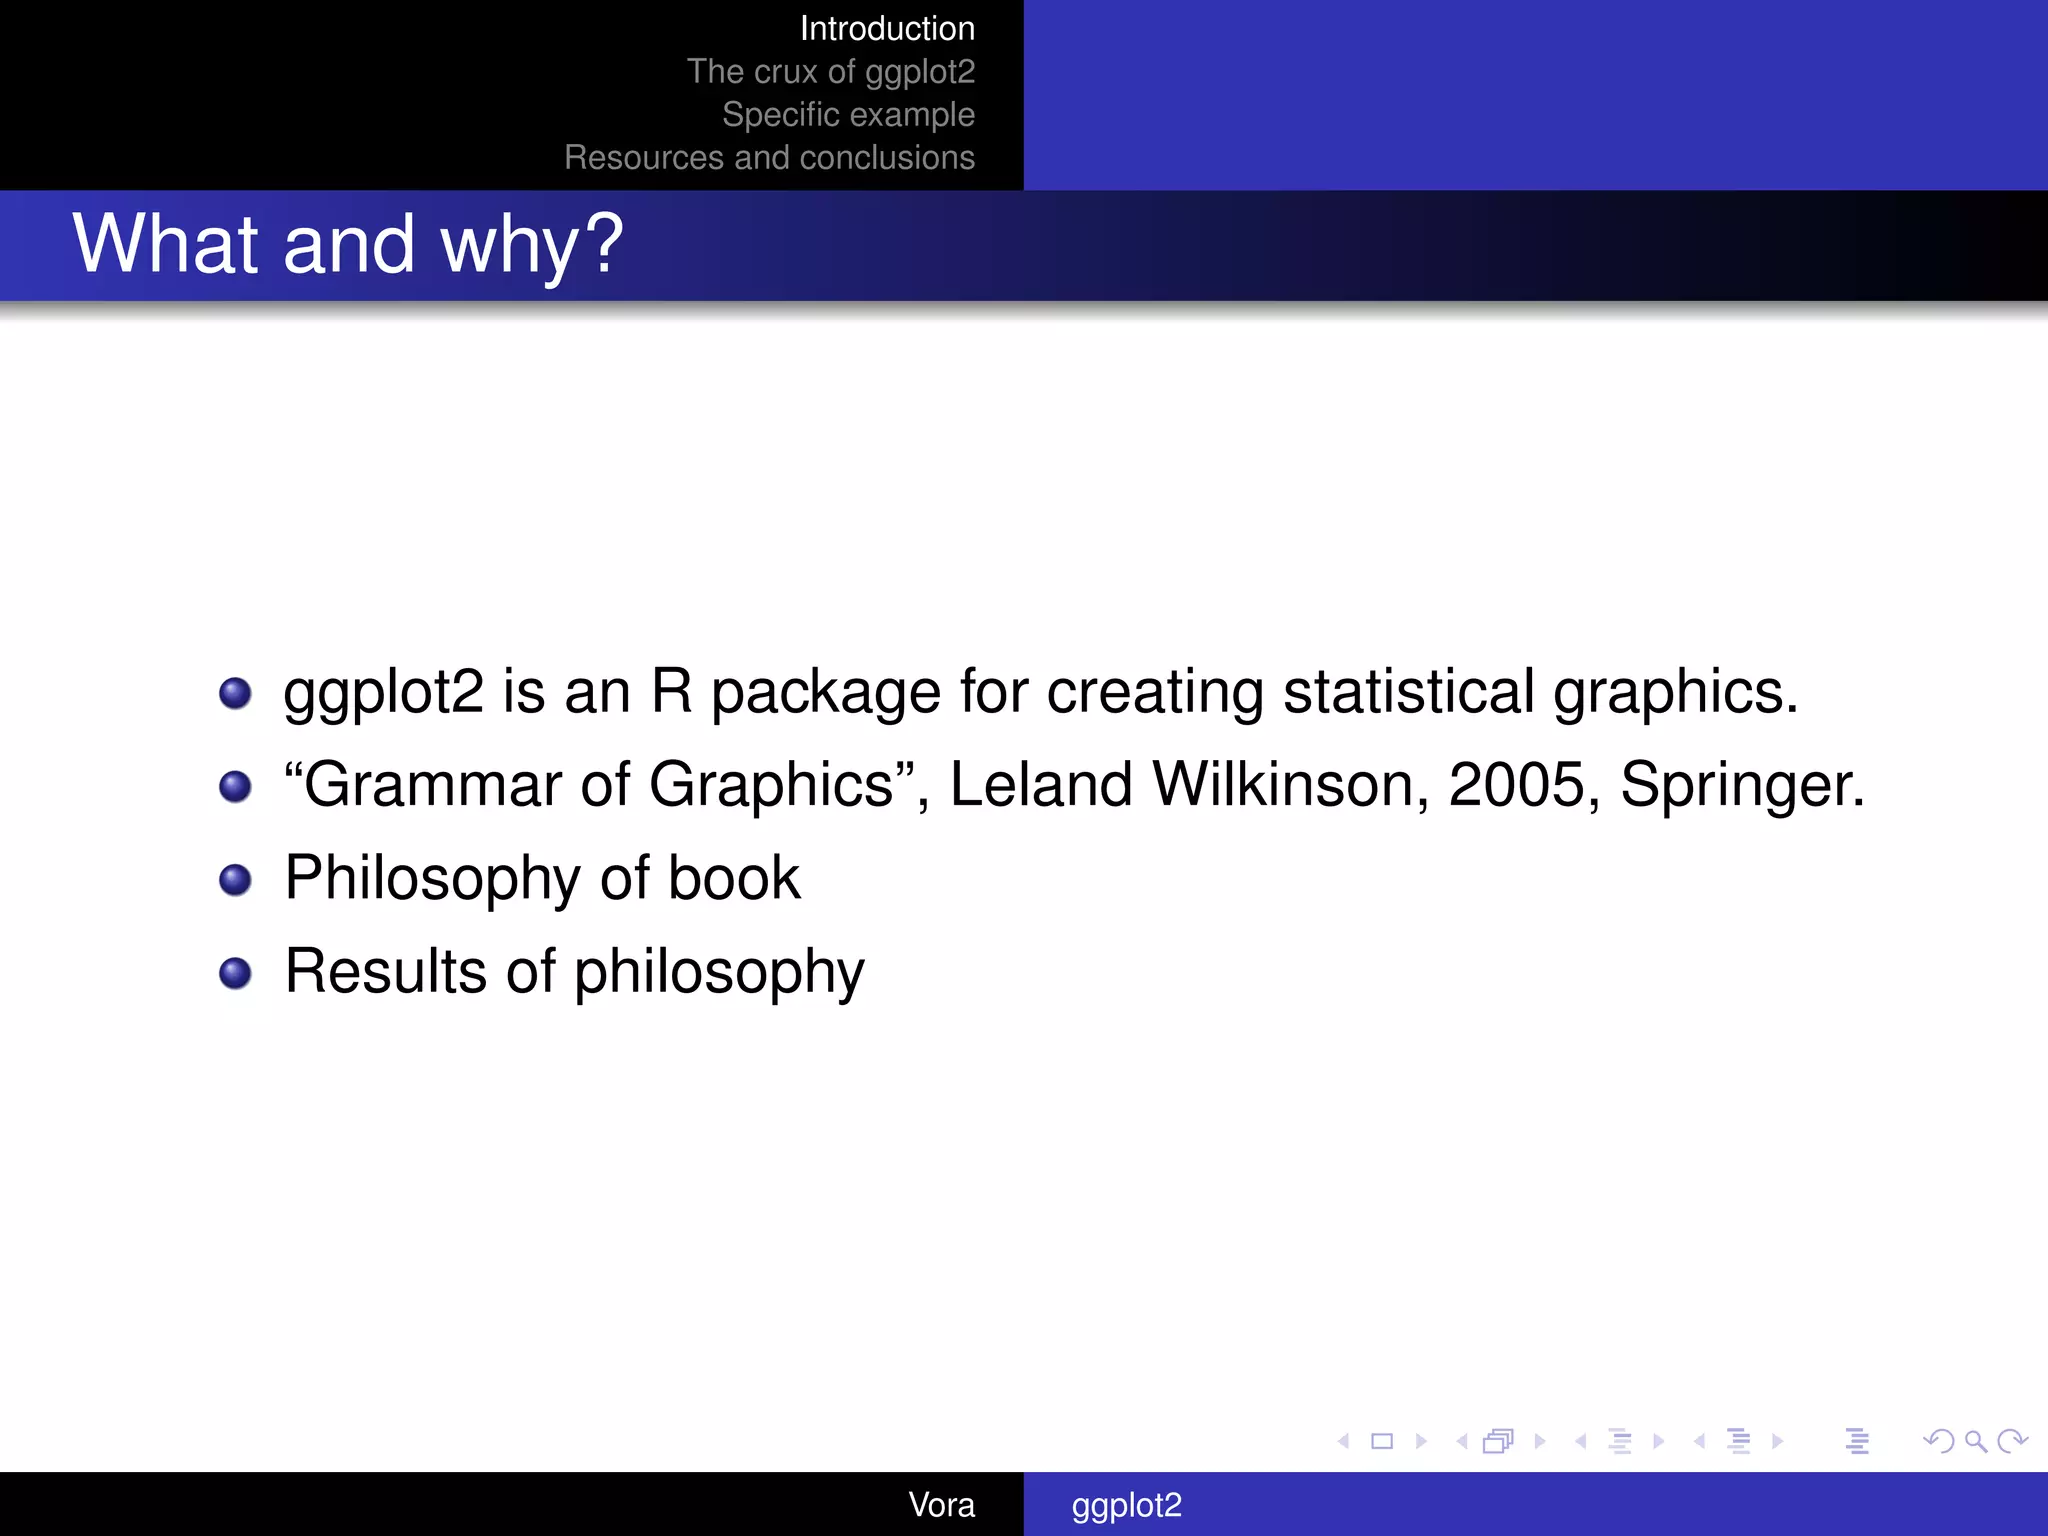
Economics and finance data
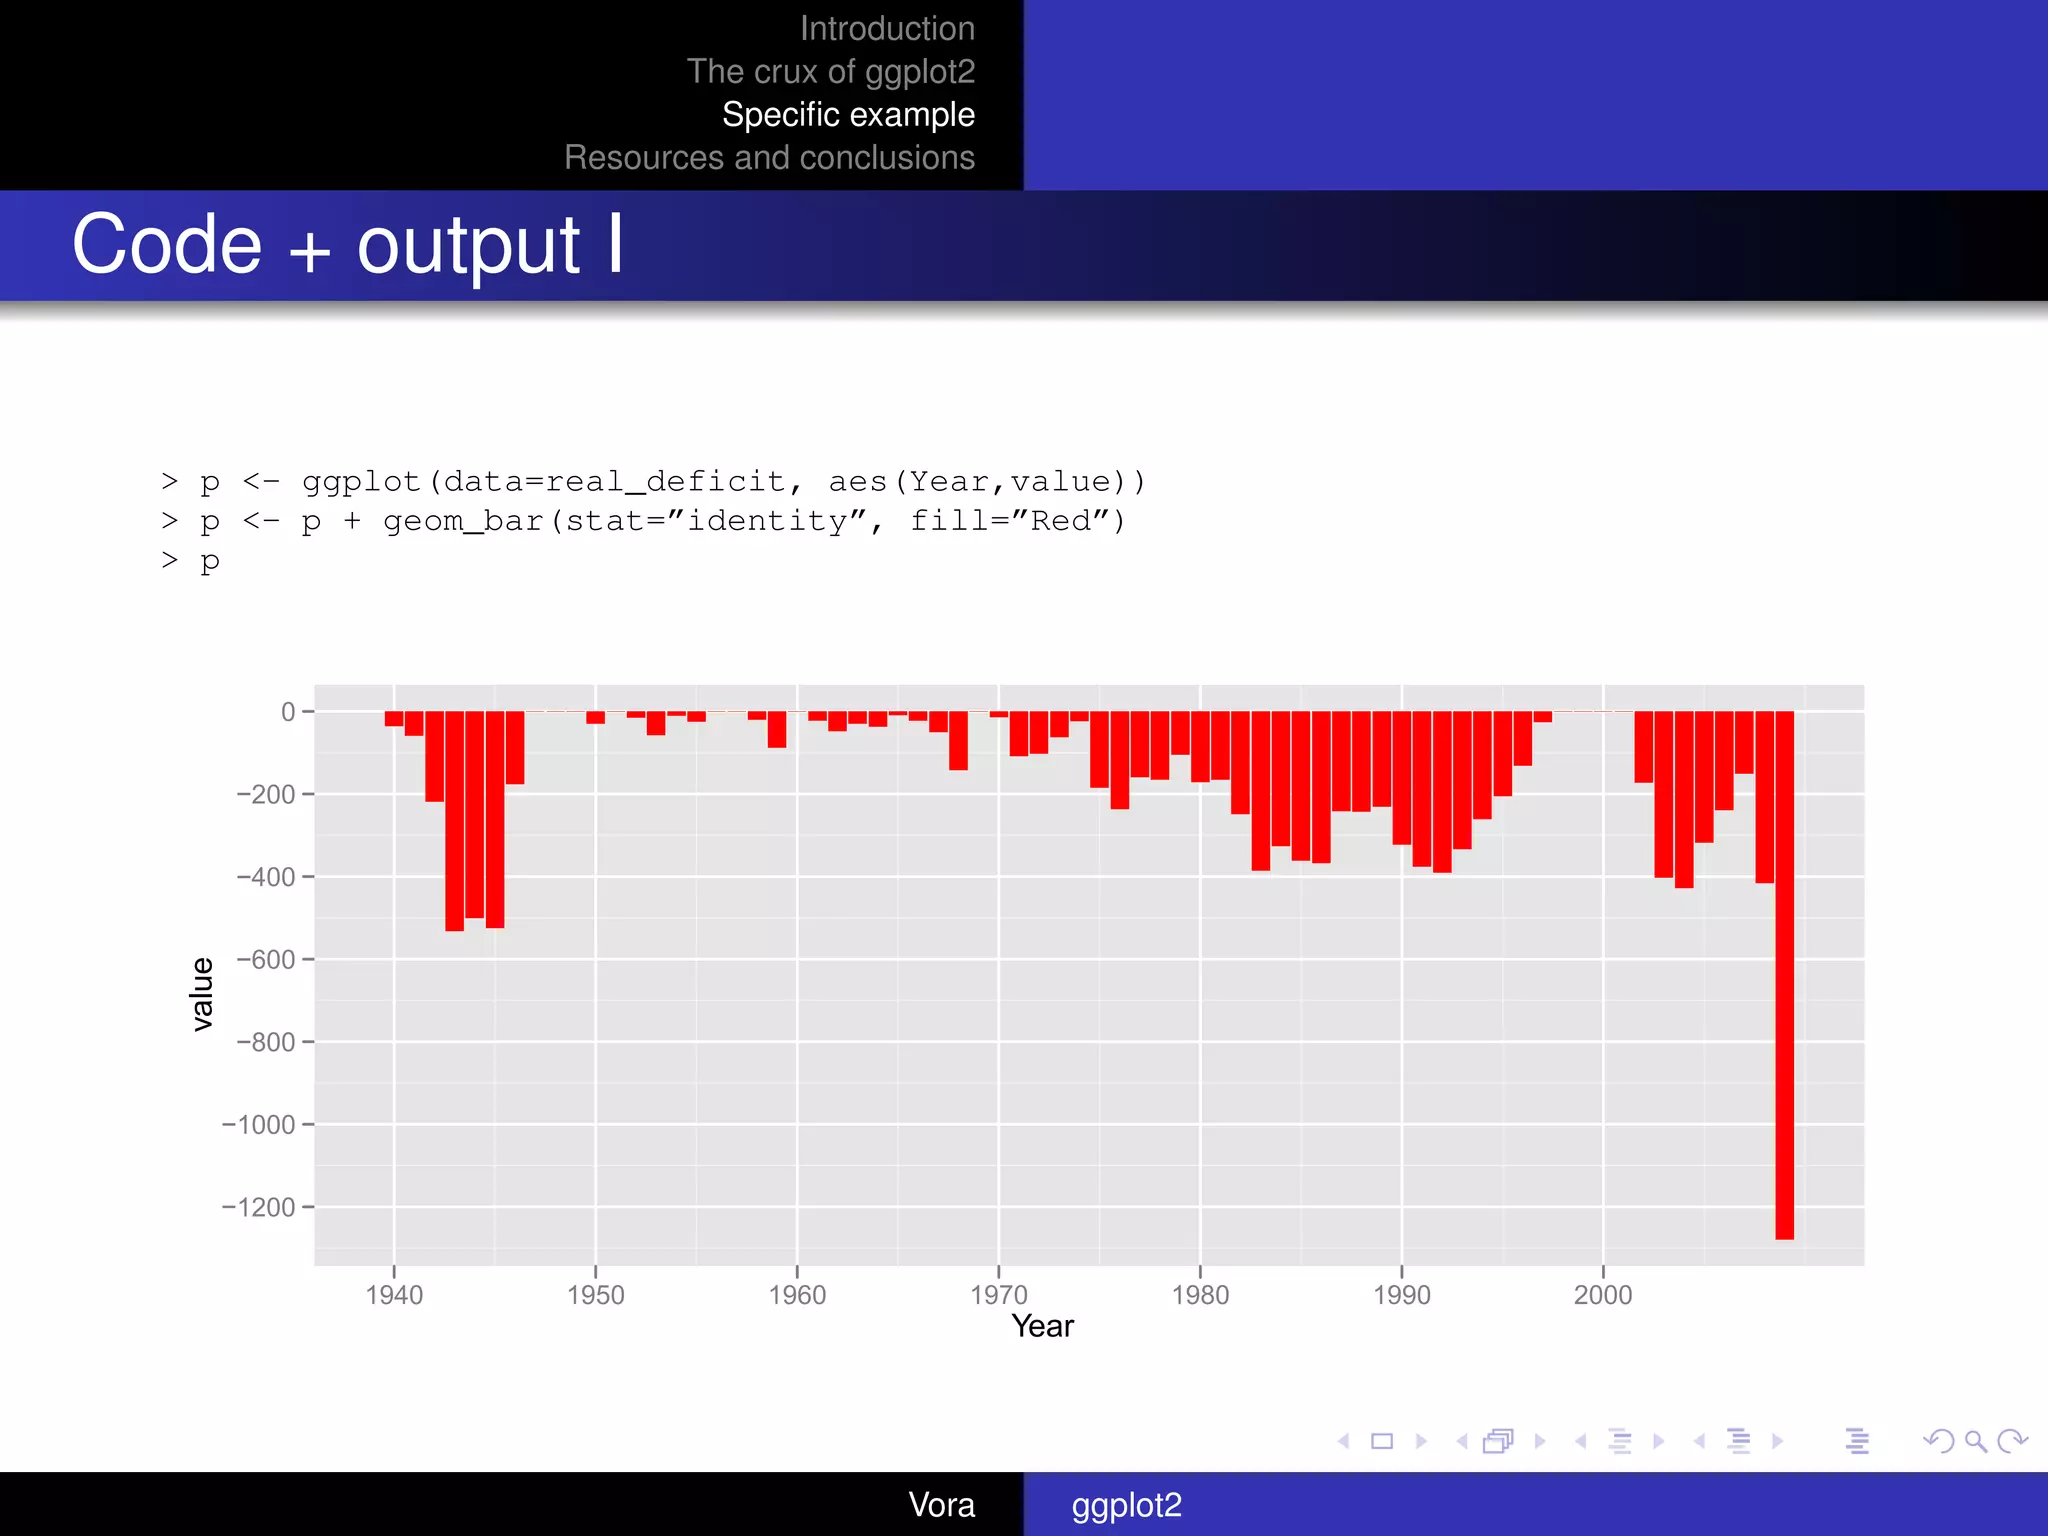
> real_deficit[1:5,]
Year value
1 1940 -36.3
2 1941 -59.1
3 1942 -219.1
4 1943 -531.7
5 1944 -501.1
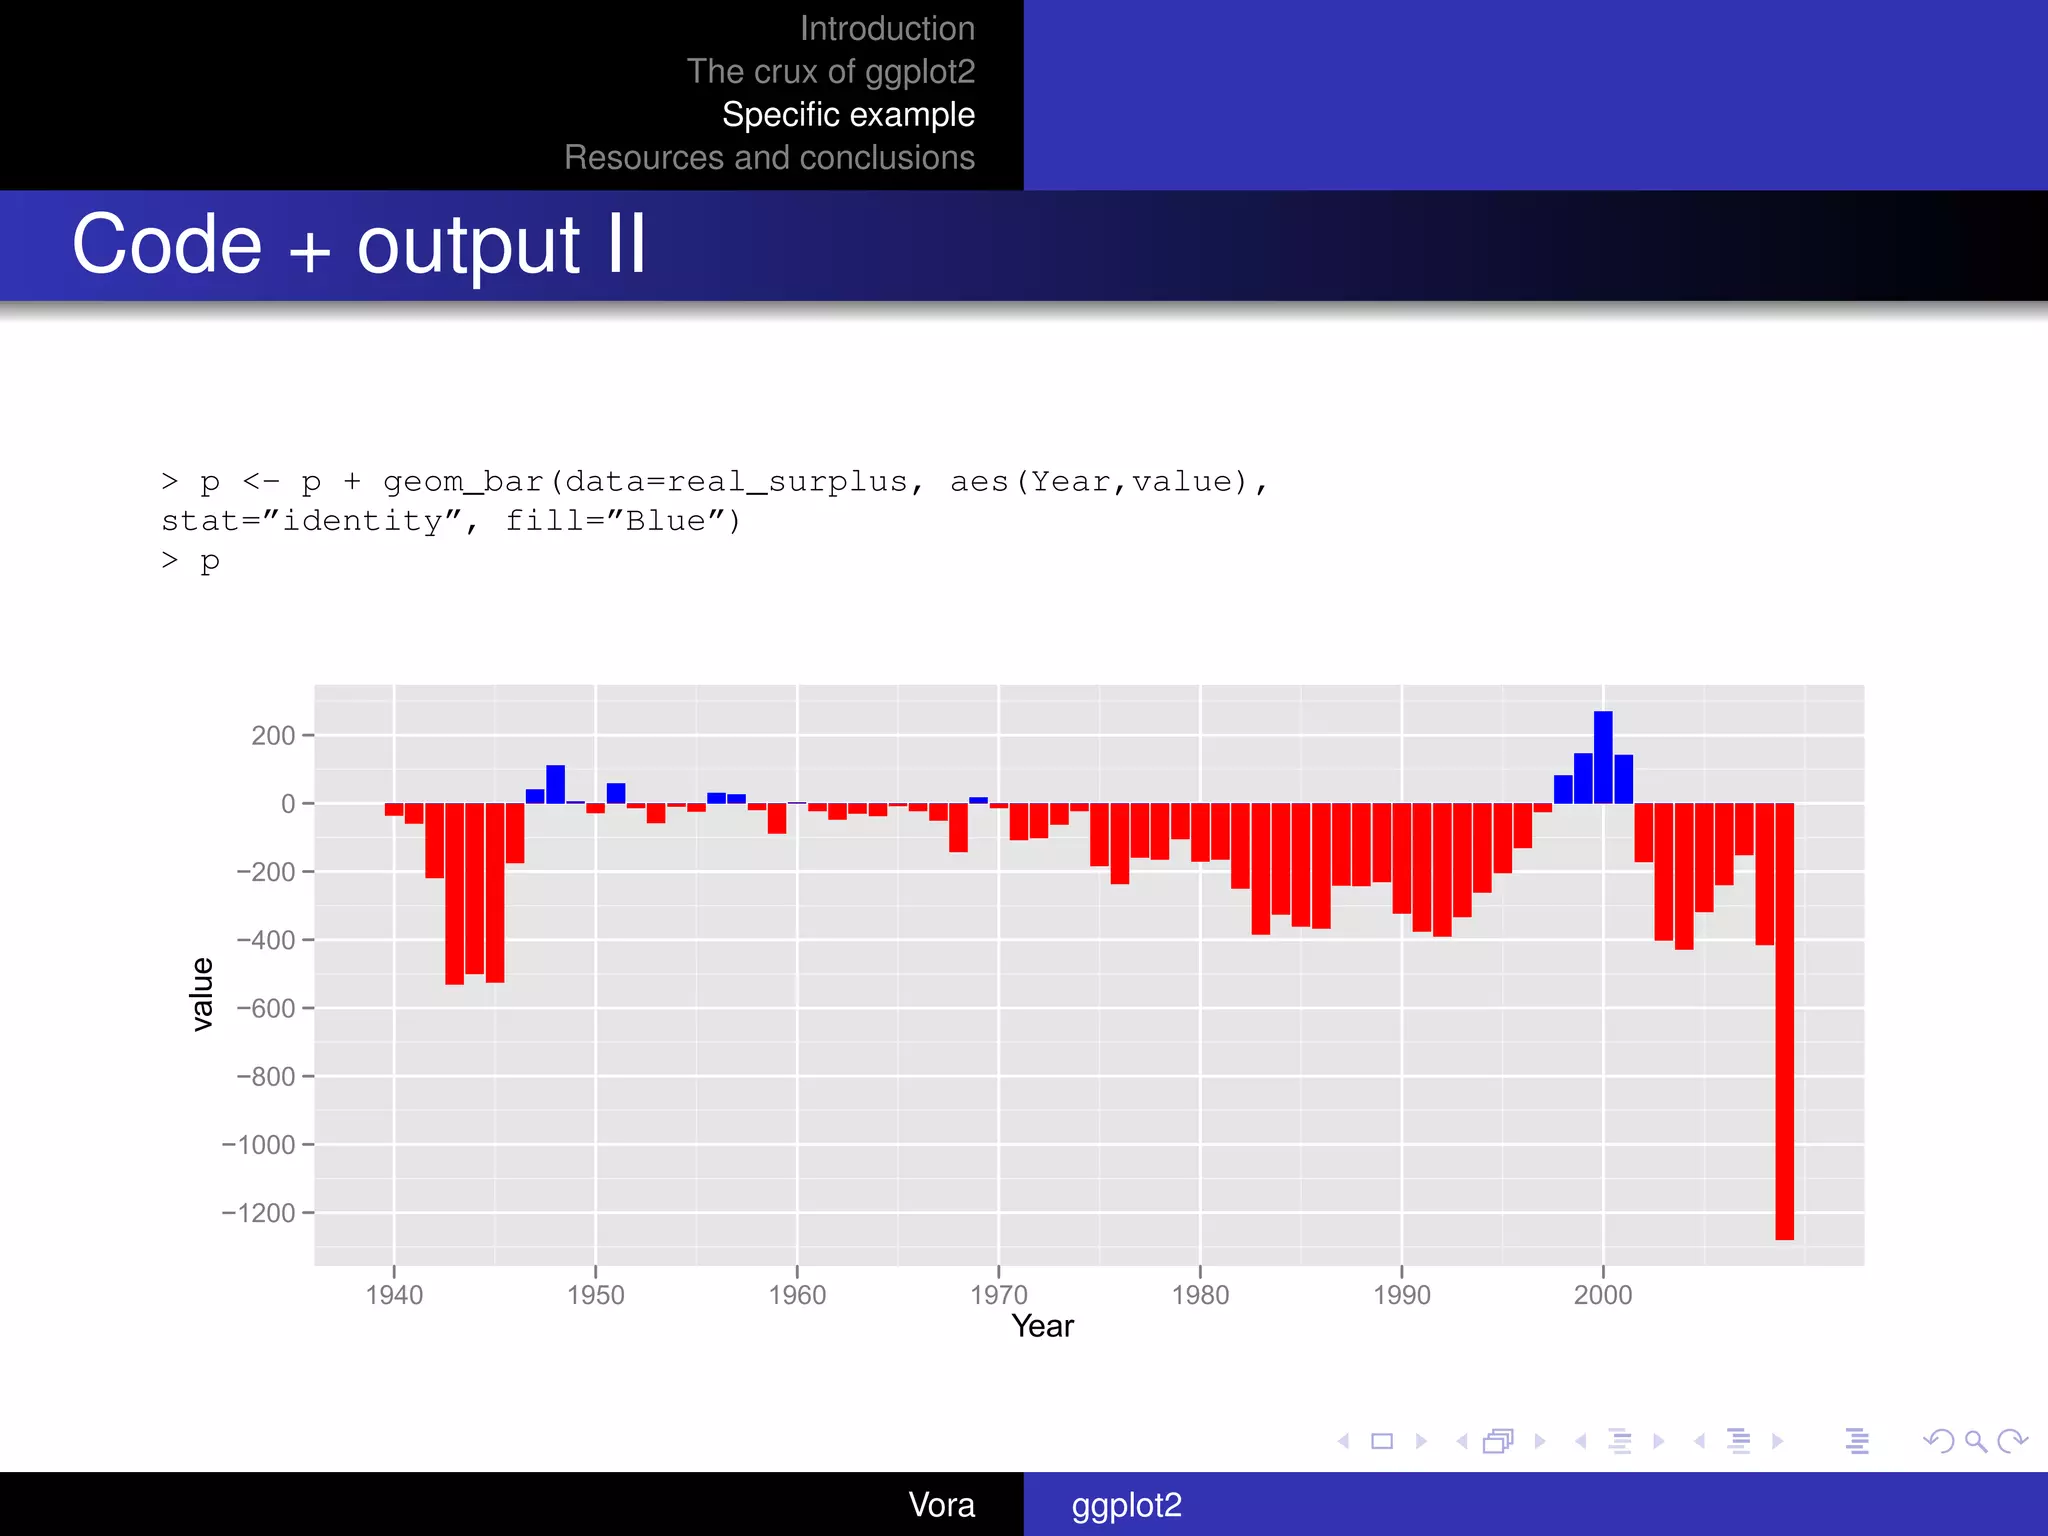
> real_surplus[6:10,]
Year value
6 1945 0.0
7 1946 0.0
8 1947 40.2
9 1948 111.5
10 1949 5.7
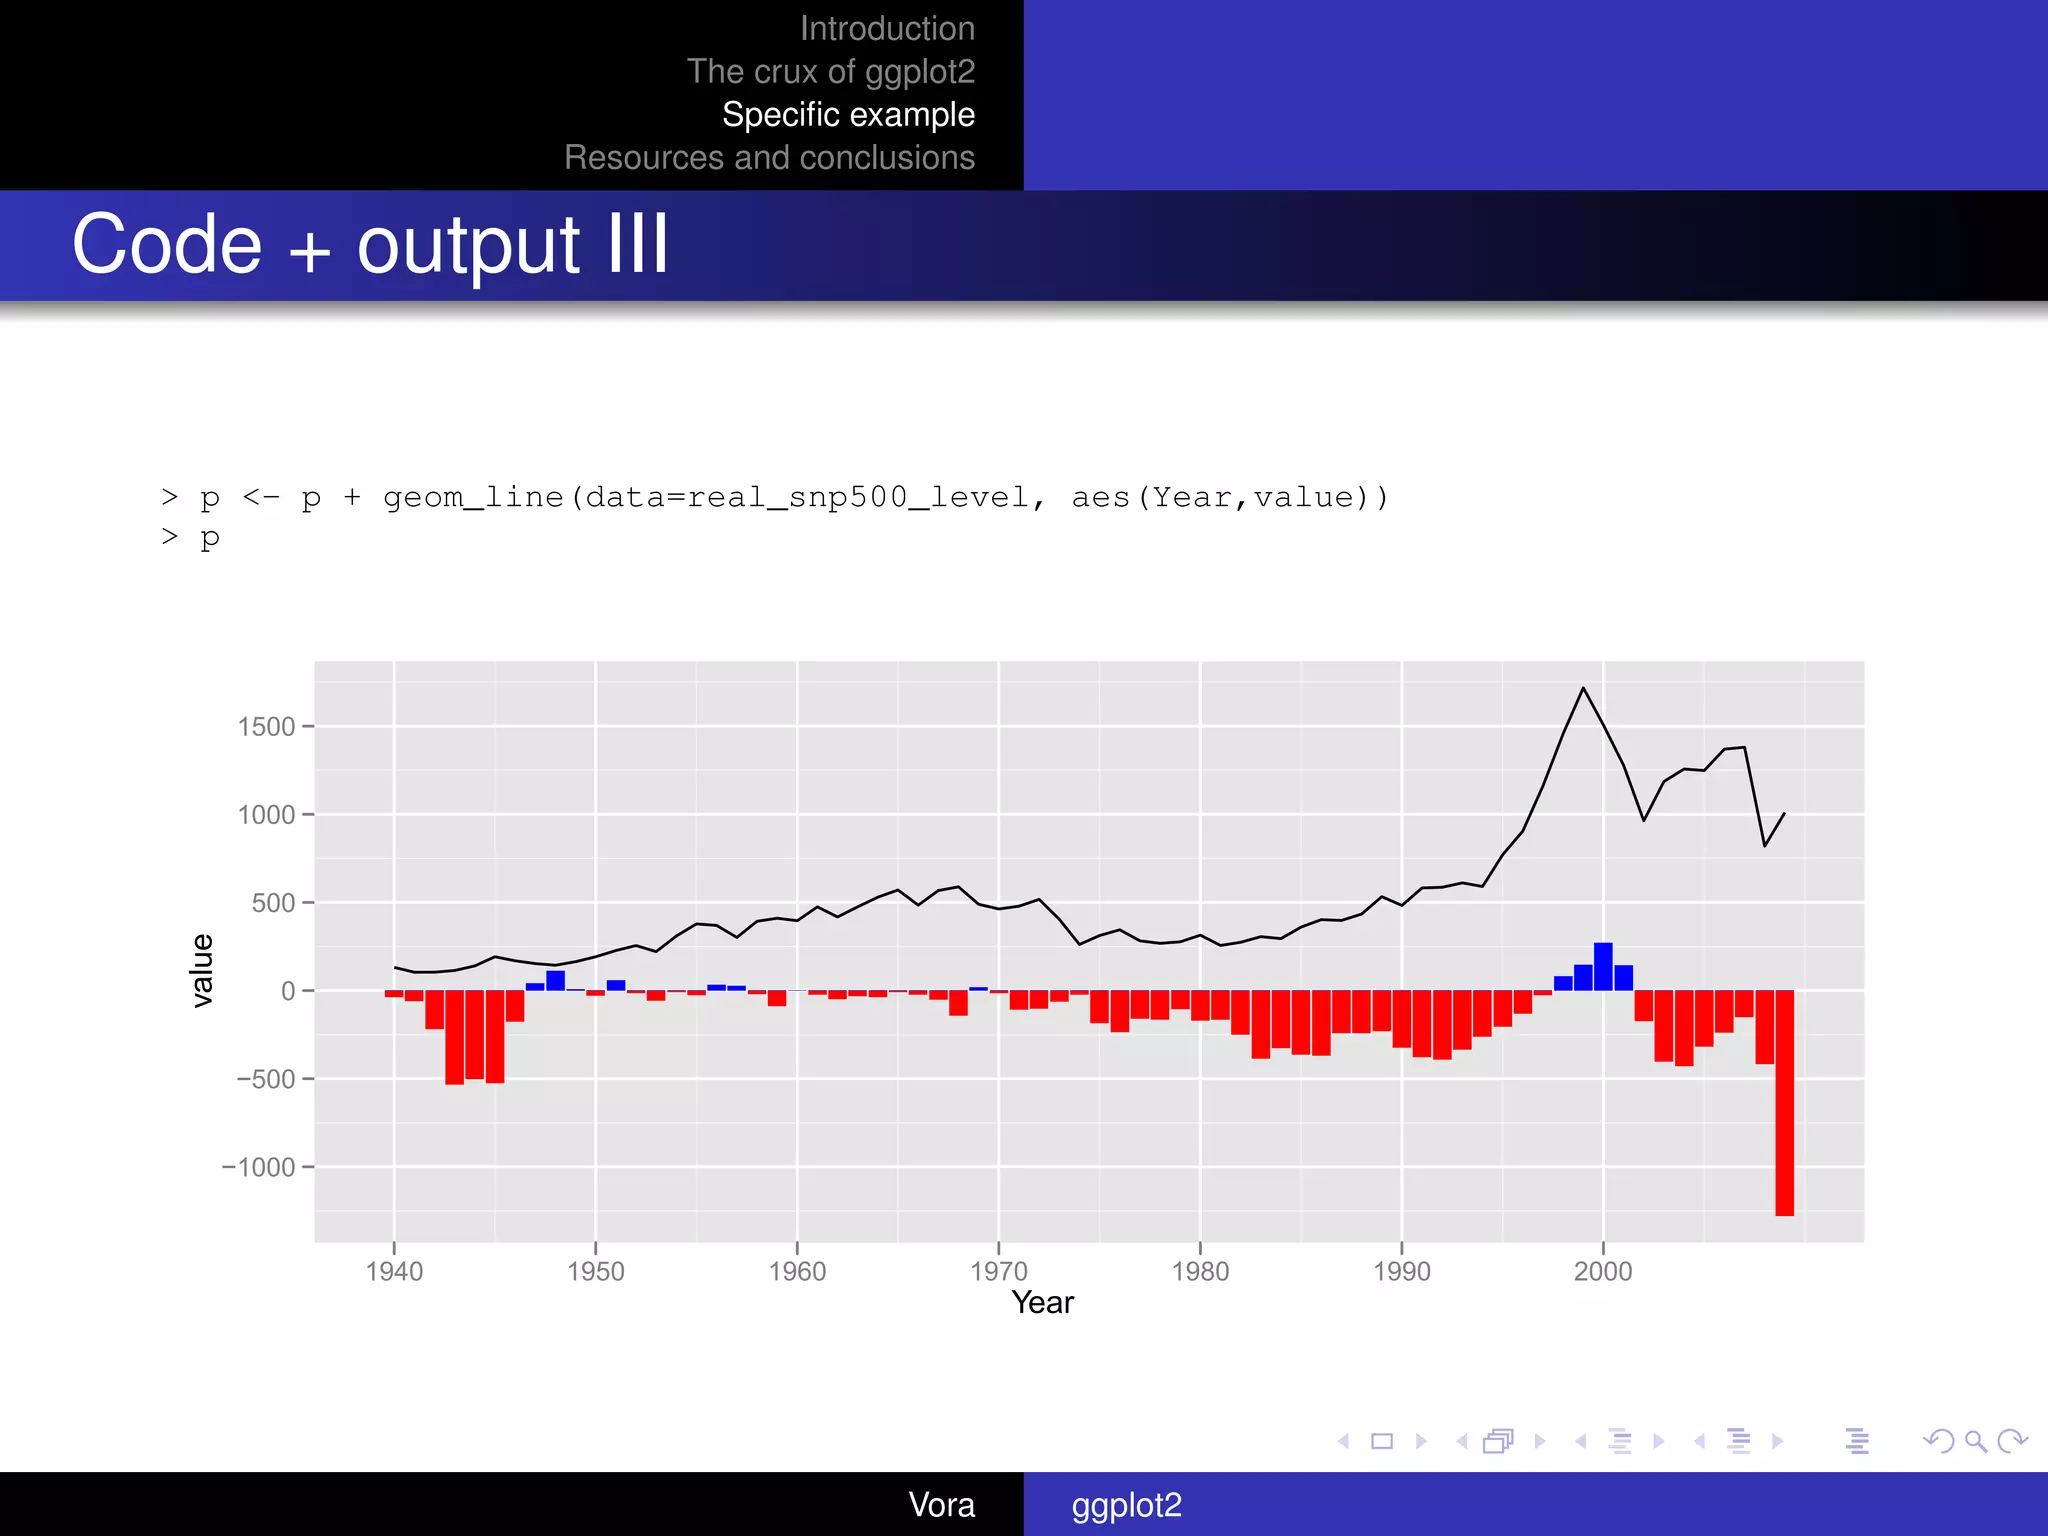
> real_snp500_level[1:5,]
Year value
1 1940 131.5920
2 1941 103.9474
3 1942 104.3803
4 1943 113.7427
5 1944 139.9368
Vora ggplot2](https://image.slidesharecdn.com/ggplot2-13069567685109-phpapp02-110601145332-phpapp02/75/Ggplot2-7-2048.jpg)