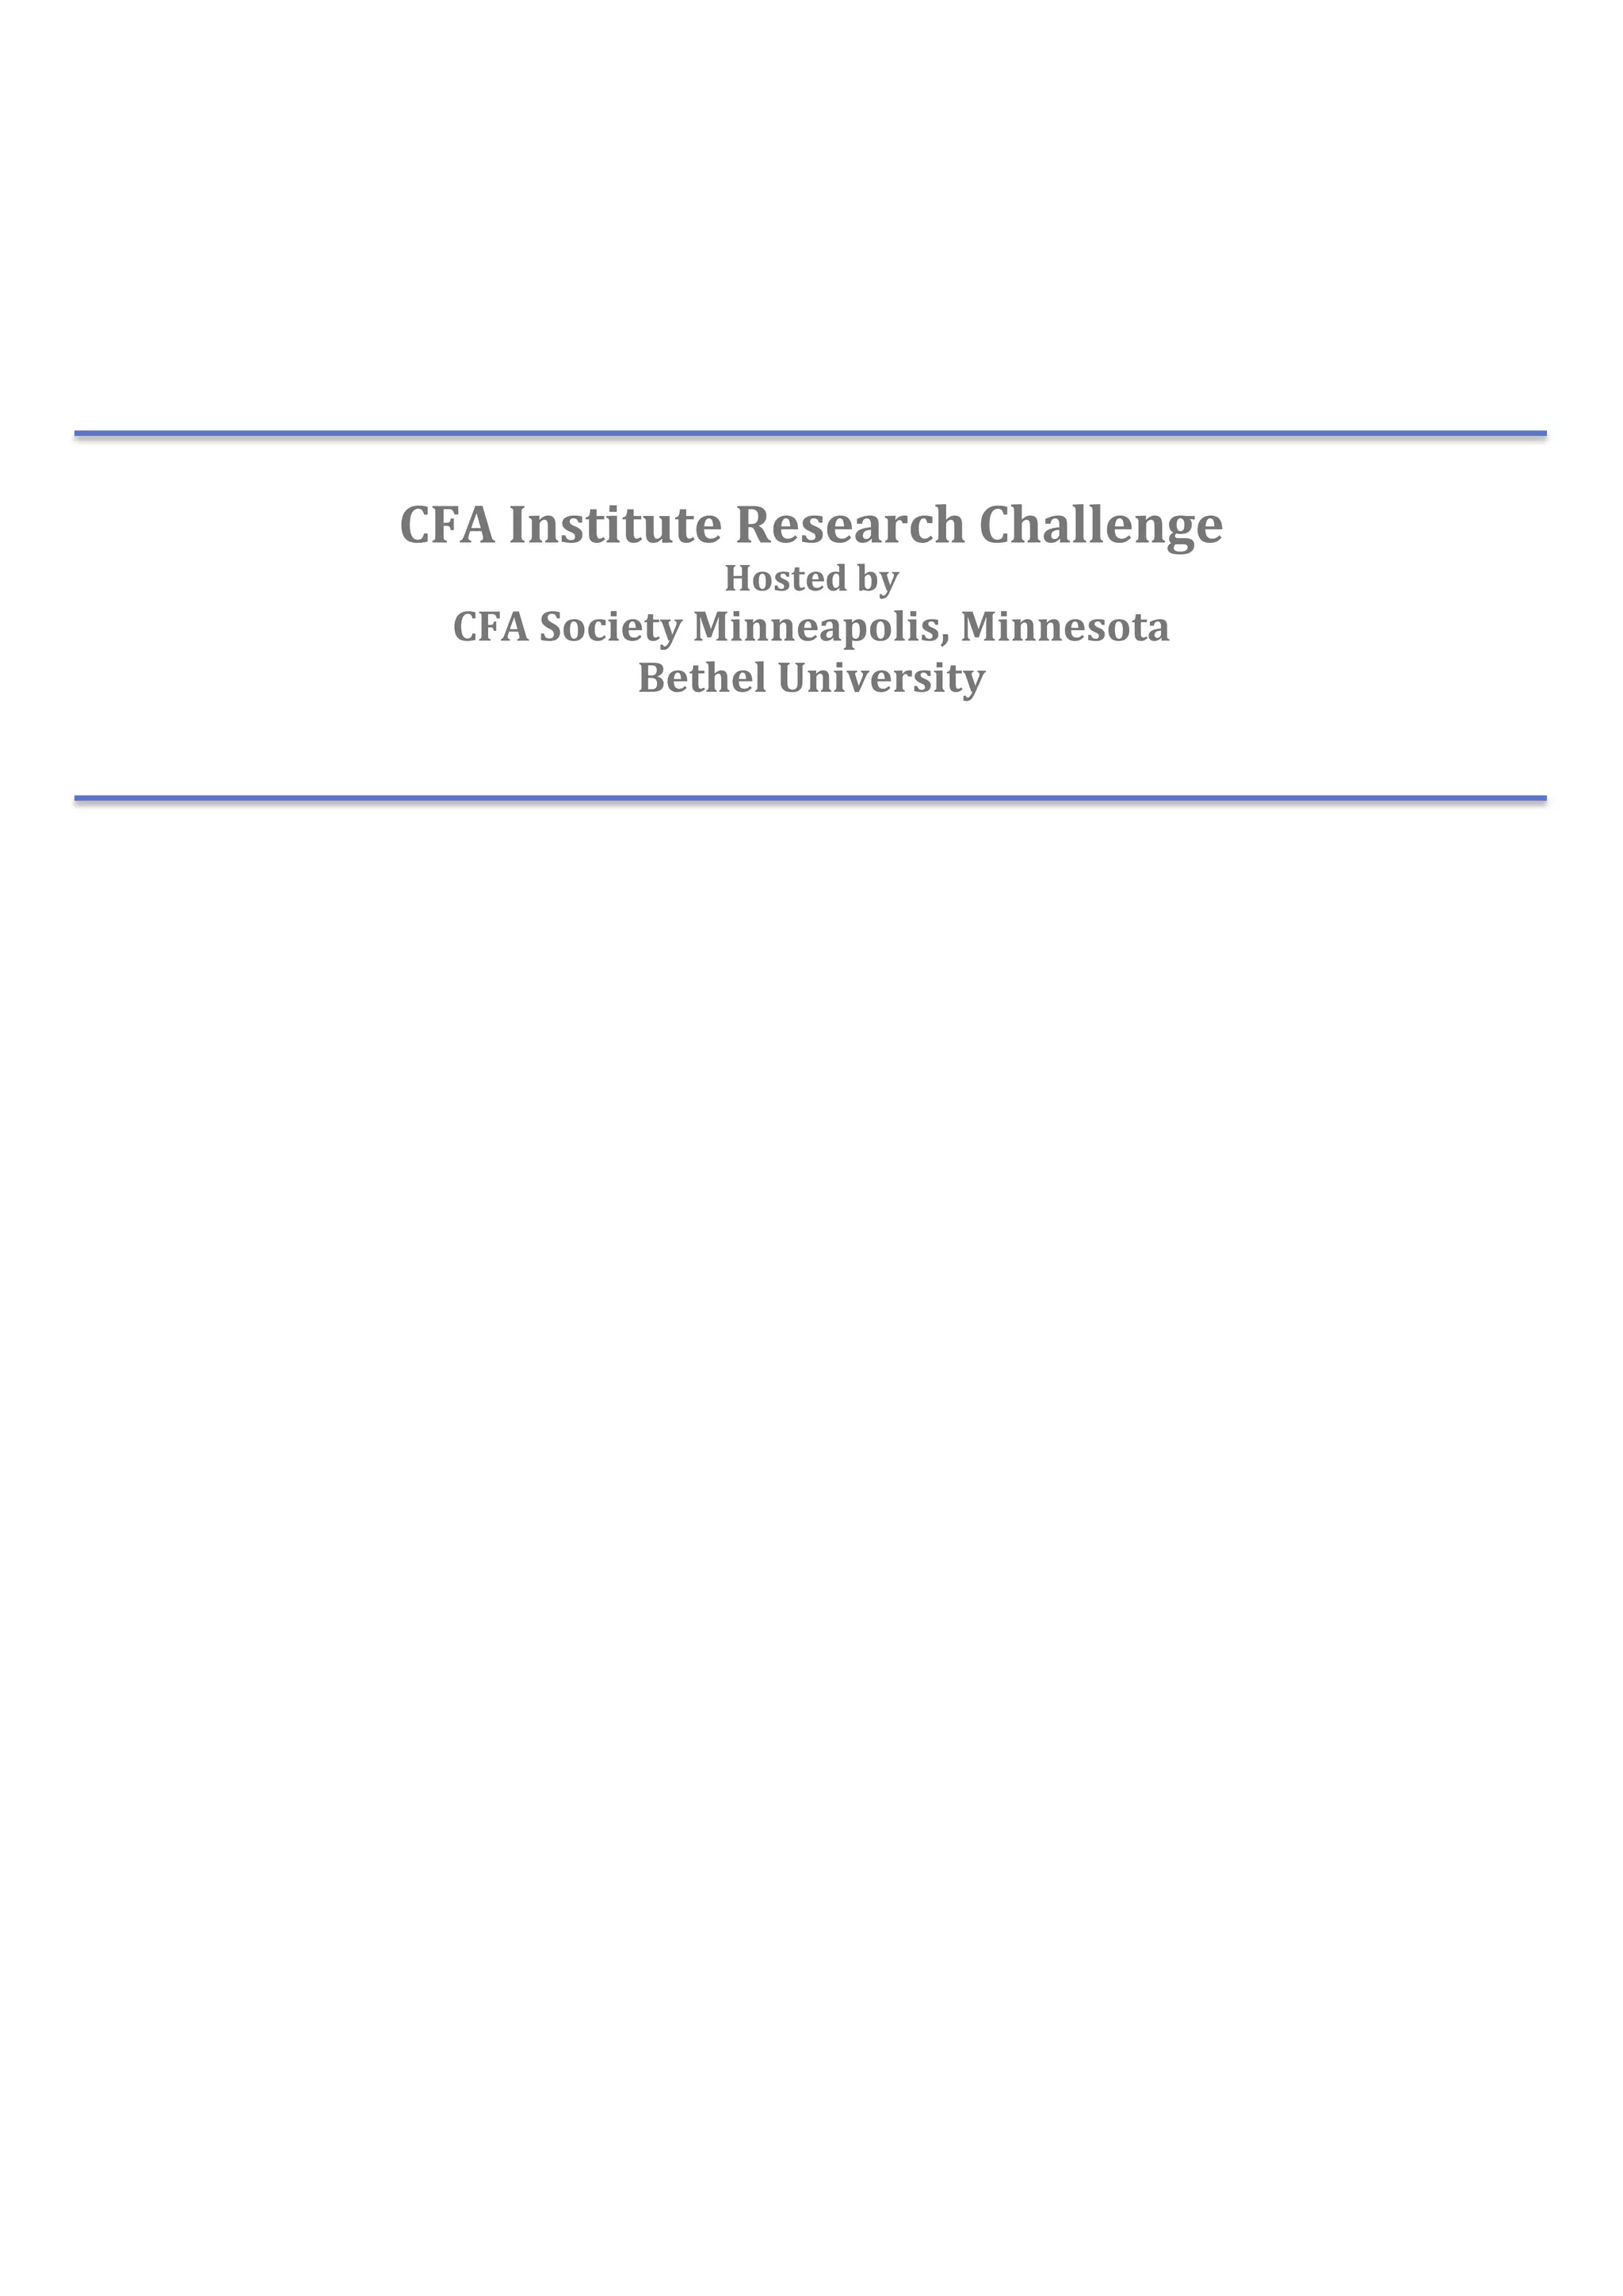
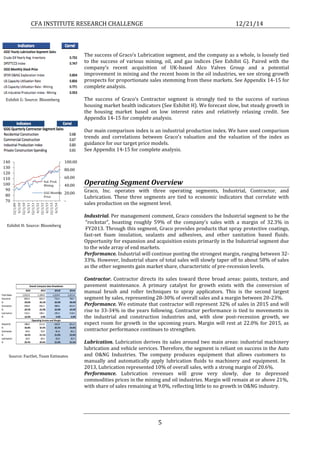
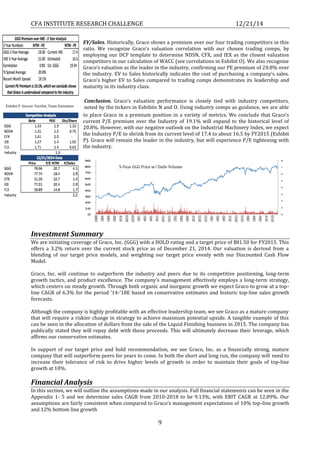
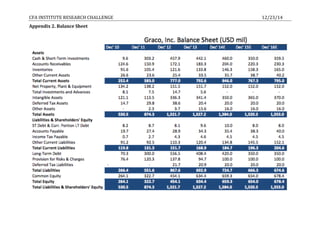
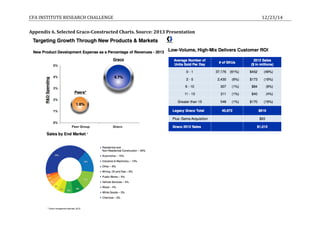
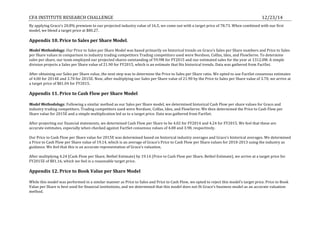
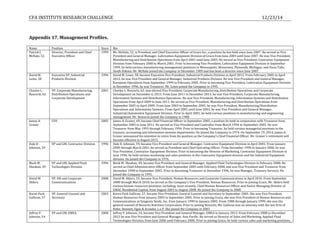
Graco Inc. is analyzed with a HOLD recommendation and 12-month price target of $81.50. Graco has a solid but conservative business model in the diversified machinery industry, with impressive market share but lack of significant growth. At its current valuation of 20.71x next-twelve-month EPS of $3.95 based on discounted cash flow analysis, Graco appears fully valued with little upside potential. The company has a strong focus on operational excellence, customer intimacy, and product leadership that provides a strong position, but management's conservative approach could lead to missed growth opportunities.

![CFA
INSTITUTE
RESEARCH
CHALLENGE
12/23/14
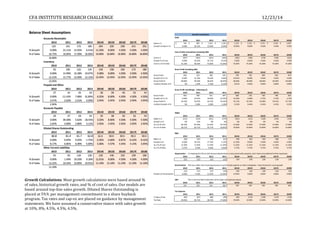
Appendix
8.
Discounted
Cash
Flow
Model
and
Calculations
!"#$%&'()$
*+,$%-)./0'1#,2'34%5'6)#47,+,
3+,$#4'8/#"'9)0/0'*/$/:;/"'<=&'>?=<
@+,.%"+$#4 A"%B/$./0
>?=? >?== >?=> >?=< >?=C >?=D >?=E >?=F >?=G H=<'I'H=G'16!J
K/.'J/L/)-/ FCCM''''''''''''''''''''''' GNDM''''''''''''''''''''''' =&?=<M''''''''''''''''''' =&=?CM''''''''''''''''''' =&>=CM''''''''''''''''''' =&<=>M''''''''''''''''''' =&<F=M''''''''''''''''''' =&C<>M''''''''''''''''''' =&CNFM''''''''''''''''''' EO<P
!"#$%&'( )*+,! -,+-! .+*! -*+*! /+*! 0+1! 0+1! 0+1!
!"#$%"&%'()*# +,-./%%%%%%%%%%%%%%%%%%%%%%%% +,0,/%%%%%%%%%%%%%%%%%%%%%%%% +12,/%%%%%%%%%%%%%%%%%%%%%%%% +134/%%%%%%%%%%%%%%%%%%%%%%%% +3-3/%%%%%%%%%%%%%%%%%%%%%%%% +310/%%%%%%%%%%%%%%%%%%%%%%%% +3.-/%%%%%%%%%%%%%%%%%%%%%%%% +340/%%%%%%%%%%%%%%%%%%%%%%%% +02,/%%%%%%%%%%%%%%%%%%%%%%%%
!"%,,'A"%Q+. C<G''''''''''''''''''''''''' D<<''''''''''''''''''''''''' DGN''''''''''''''''''''''''' ECD''''''''''''''''''''''''' F?N''''''''''''''''''''''''' FEE''''''''''''''''''''''''' G??''''''''''''''''''''''''' G<E''''''''''''''''''''''''' GFC''''''''''''''''''''''''' EO<P
!"23$456 1/+/! 1.+1! 1/+)! 1/+0! 1/+0! 1/+0! 1/+0! 1/+0! 1/+0!
'567 +28,/%%%%%%%%%%%%%%%%%%%%%%%% +2,4/%%%%%%%%%%%%%%%%%%%%%%%% +208/%%%%%%%%%%%%%%%%%%%%%%%% +2.1/%%%%%%%%%%%%%%%%%%%%%%%% +248/%%%%%%%%%%%%%%%%%%%%%%%% +,83/%%%%%%%%%%%%%%%%%%%%%%%% +,24/%%%%%%%%%%%%%%%%%%%%%%%% +,11/%%%%%%%%%%%%%%%%%%%%%%%% +,34/%%%%%%%%%%%%%%%%%%%%%%%%
96: +,;/%%%%%%%%%%%%%%%%%%%%%%%%%% +12/%%%%%%%%%%%%%%%%%%%%%%%%%% +14/%%%%%%%%%%%%%%%%%%%%%%%%%% +38/%%%%%%%%%%%%%%%%%%%%%%%%%% +3;/%%%%%%%%%%%%%%%%%%%%%%%%%% +02/%%%%%%%%%%%%%%%%%%%%%%%%%% +03/%%%%%%%%%%%%%%%%%%%%%%%%%% +0;/%%%%%%%%%%%%%%%%%%%%%%%%%% +.8/%%%%%%%%%%%%%%%%%%%%%%%%%%
60B-,./0'9R(S*6 =GF''''''''''''''''''''''''' >D>''''''''''''''''''''''''' >FN''''''''''''''''''''''''' <=N''''''''''''''''''''''''' <E?''''''''''''''''''''''''' <GN''''''''''''''''''''''''' C?E''''''''''''''''''''''''' C>D''''''''''''''''''''''''' CCC''''''''''''''''''''''''' EOGP
!"23$456 )1+)! )/+)! )7+8! )/+.! ).+7! ).+7! ).+7! ).+7! ).+7!
:*<=*>?($?"@ +22/%%%%%%%%%%%%%%%%%%%%%%%%%% +22/%%%%%%%%%%%%%%%%%%%%%%%%%% +22/%%%%%%%%%%%%%%%%%%%%%%%%%% +2,/%%%%%%%%%%%%%%%%%%%%%%%%%% +21/%%%%%%%%%%%%%%%%%%%%%%%%%% +21/%%%%%%%%%%%%%%%%%%%%%%%%%% +21/%%%%%%%%%%%%%%%%%%%%%%%%%% +21/%%%%%%%%%%%%%%%%%%%%%%%%%% +21/%%%%%%%%%%%%%%%%%%%%%%%%%%
7A"=$?B($?"@ +82/%%%%%%%%%%%%%%%%%%%%%%%%%% +88/%%%%%%%%%%%%%%%%%%%%%%%%%% +8./%%%%%%%%%%%%%%%%%%%%%%%%%% +81/%%%%%%%%%%%%%%%%%%%%%%%%%% +80/%%%%%%%%%%%%%%%%%%%%%%%%%% +80/%%%%%%%%%%%%%%%%%%%%%%%%%% +80/%%%%%%%%%%%%%%%%%%%%%%%%%% +80/%%%%%%%%%%%%%%%%%%%%%%%%%% +80/%%%%%%%%%%%%%%%%%%%%%%%%%%
9R(S =D<''''''''''''''''''''''''' >>?''''''''''''''''''''''''' >C=''''''''''''''''''''''''' >G>''''''''''''''''''''''''' <>?''''''''''''''''''''''''' <CN''''''''''''''''''''''''' <EE''''''''''''''''''''''''' <GD''''''''''''''''''''''''' C?C''''''''''''''''''''''''' FODP
!"23$456 )*+8! )0+1! ),+/! )1+1! )8+0! )8+8! )8+7! )8+.! )7+*!
C(D*# +10/%%%%%%%%%%%%%%%%%%%%%%%%%% +0./%%%%%%%%%%%%%%%%%%%%%%%%%% +0;/%%%%%%%%%%%%%%%%%%%%%%%%%% +.;/%%%%%%%%%%%%%%%%%%%%%%%%%% +4,/%%%%%%%%%%%%%%%%%%%%%%%%%% +882/%%%%%%%%%%%%%%%%%%%%%%%% +82-/%%%%%%%%%%%%%%%%%%%%%%%% +82./%%%%%%%%%%%%%%%%%%%%%%%% +8,1/%%%%%%%%%%%%%%%%%%%%%%%%
9R(6S =?F''''''''''''''''''''''''' =D>''''''''''''''''''''''''' =F<''''''''''''''''''''''''' >?C''''''''''''''''''''''''' >>F''''''''''''''''''''''''' ><F''''''''''''''''''''''''' >CF''''''''''''''''''''''''' >DG''''''''''''''''''''''''' >F?''''''''''''''''''''''''' DOGP
E)F#G%:67 ,1%%%%%%%%%%%%%%%%%%%%%%%%%%% ,2%%%%%%%%%%%%%%%%%%%%%%%%%%% ,4%%%%%%%%%%%%%%%%%%%%%%%%%%% ,.%%%%%%%%%%%%%%%%%%%%%%%%%%% 1-%%%%%%%%%%%%%%%%%%%%%%%%%%% 1-%%%%%%%%%%%%%%%%%%%%%%%%%%% 1-%%%%%%%%%%%%%%%%%%%%%%%%%%% 1-%%%%%%%%%%%%%%%%%%%%%%%%%%% 1-%%%%%%%%%%%%%%%%%%%%%%%%%%%
H*##G%!(<*D +8;/%%%%%%%%%%%%%%%%%%%%%%%%%% +23/%%%%%%%%%%%%%%%%%%%%%%%%%% +8;/%%%%%%%%%%%%%%%%%%%%%%%%%% +2,/%%%%%%%%%%%%%%%%%%%%%%%%%% +,-/%%%%%%%%%%%%%%%%%%%%%%%%%% +,-/%%%%%%%%%%%%%%%%%%%%%%%%%% +,2/%%%%%%%%%%%%%%%%%%%%%%%%%% +,,/%%%%%%%%%%%%%%%%%%%%%%%%%% +,1/%%%%%%%%%%%%%%%%%%%%%%%%%%
!I(@J*#%?@%K"=L?@J%!(<?$() M%%%%%%%%%%%%%%%%%%%%%%%%%%%%%% +2;/%%%%%%%%%%%%%%%%%%%%%%%%%% +2-/%%%%%%%%%%%%%%%%%%%%%%%%%% +80/%%%%%%%%%%%%%%%%%%%%%%%%%% +2-/%%%%%%%%%%%%%%%%%%%%%%%%%% +8./%%%%%%%%%%%%%%%%%%%%%%%%%% +8-/%%%%%%%%%%%%%%%%%%%%%%%%%% +88/%%%%%%%%%%%%%%%%%%%%%%%%%% +88/%%%%%%%%%%%%%%%%%%%%%%%%%%
T)4/L/"/0'3"//'1#,2'34%5 =>C''''''''''''''''''''''''' =<>''''''''''''''''''''''''' =F<''''''''''''''''''''''''' >?>''''''''''''''''''''''''' >=F''''''''''''''''''''''''' ><?''''''''''''''''''''''''' >CD''''''''''''''''''''''''' >DC''''''''''''''''''''''''' >EC''''''''''''''''''''''''' DODP
U611 DONCP
:?#>"F@$%E*=?"N 8%%%%%%%%%%%%%%%%%%%%%%%%%%%%% 2%%%%%%%%%%%%%%%%%%%%%%%%%%%%% ,%%%%%%%%%%%%%%%%%%%%%%%%%%%%% 1%%%%%%%%%%%%%%%%%%%%%%%%%%%%% 3%%%%%%%%%%%%%%%%%%%%%%%%%%%%%
:?#>"F@$%O(>$"= -P41%%%%%%%%%%%%%%%%%%%%%%%% -P;4%%%%%%%%%%%%%%%%%%%%%%%% -P;1%%%%%%%%%%%%%%%%%%%%%%%% -P.4%%%%%%%%%%%%%%%%%%%%%%%% -P.3%%%%%%%%%%%%%%%%%%%%%%%%
A"/,/).'V#4-/'%Q'3"//'1#,2'34%5 >?DM''''''''''''''''''''''' >?DM''''''''''''''''''''''' >?EM''''''''''''''''''''''' >?>M''''''''''''''''''''''' =NGM'''''''''''''''''''''''
9W+.'X-4.+Y4/'X/.2%0 (:Y4+/0'9Z-+.7'V#4-/ (:Y4+/0'9V[9R(S*6
1-:-4#.+L/'A"/,/).'V#4-/'%Q'3"//'1#,2'34%5 =&?=DM''''''''''''''''''' 9)./"Y"+,/'V#4-/ D&CGCM''''''''''''''''''' 9)./"Y"+,/'V#4-/ D&CGCM'''''''''''''''''''
H*##G%:*Q$ +18;/%%%%%%%%%%%%%%%%%%%%%%%% HCR%STUC:7
C*=A?@()%7NVF#$*N%STUC:7 111%%%%%%%%%%%%%%%%%%%%%%%%% H*##G%E=*&*==*N%SWF?$X M%%%%%%%%%%%%%%%%%%%%%%%%%%%%%% (:Y4+/0'9V[9R(S*6 ?O??W
SD?$%RF)$?<)* 8,P11D 7NNG%!(#I
S/":+)#4'V#4-/ D&NE<'''''''''''''''''''''' 7NNG%!(#I%&="A%Y<$?"@# (:Y4+/0'A/"Y+.-+.7'!"%5.2'J#./
:?#>"F@$%O(>$"= -P.3%%%%%%%%%%%%%%%%%%%%%%%% (:Y4+/0'9Z-+.7'V#4-/ D&?EE'''''''''''''''''''''' S/":+)#4'8/#"'3"//'1#,2'34%5 201Z%%%%%%%%%%%%%%%%%%%%%%%
A"/,/).'V#4-/'%Q'S/":+)#4'V#4-/ C&CEN'''''''''''''''''''''' K7!! 3P41[
'I(=*#%YF$#$(@N?@J 34P4-%%%%%%%%%%%%%%%%%%%%%% C*=A?@()%()F* 3]40,%%%%%%%%%%%%%%%%%%%%%%
9)./"Y"+,/'V#4-/ D&CGCM''''''''''''''''''' .%$]'A"+$/ GCODF (:Y4+/0'A/"Y+.-+.7'!"%5.2'J#./ 8P11[
34P4-%%%%%%%%%%%%%%%%%%%%%%
C*=A?@()%()F*]%E 3]1;,P.1%%%%%%%%%%%%%%%%
H*##%:*Q$ +18;/%%%%%%%%%%%%%%%%%%%%%%%%
UA<)?*N%SWF?$X%()F* 3]-03P.1%%%%%%%%%%%%%%%%
'$">L%E=?>* ;1P3.%%%%%%%%%%%%%%%%%%%%%%
G=OF=M'''''''''''''''''''
O!O 84;%%%%%%%%%%%%%%%%%%%%%%%%%
J 2P.8[
K7!! 3P41[
C*=A?@()%()F* 0],-2%%%%%%%%%%%%%%%%%%%%%%
:?#>"F@$%O(>$"= -P.3%%%%%%%%%%%%%%%%%%%%%%%%
E%"&%C*=A?@()%()F* 1].2,%%%%%%%%%%%%%%%%%%%%%%
'$">L%E=?>* .;P;3%%%%%%%%%%%%%%%%%%%%%%
9W+.'X-4.+Y4/'X/.2%0
'I(=*#%YF$#$(@N?@J
A/"Y/.-+.7'!"%5.2'X/.2%0.%$]'A"+$/^
7^*=(J*%"&%$I*%SD?$%RF)$?<)*%R*$I"N%(@N%E*=<*$F?$X%
5="_$I%R*$I"N](https://image.slidesharecdn.com/23146272-a028-461f-9a3a-eae981db4d16-151005162916-lva1-app6892/85/GGG-19-320.jpg)
![CFA
INSTITUTE
RESEARCH
CHALLENGE
12/23/14
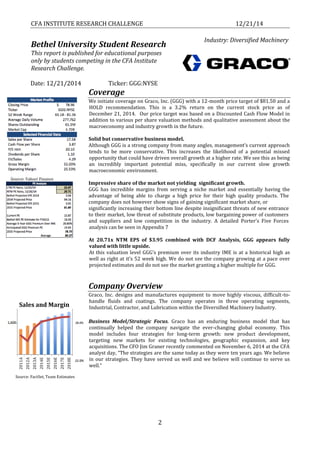
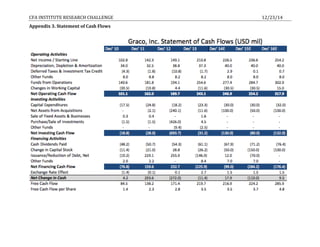
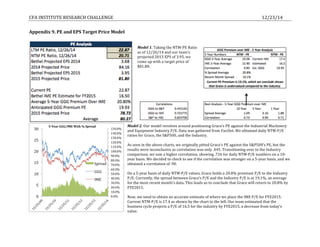
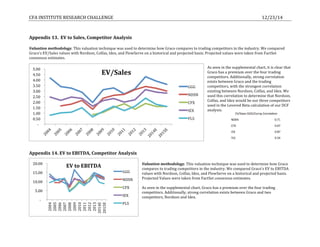
!"#$%&'()$
*+,-./+0'12+"#-+'3%4/'%5'3#6,/#7
8,4$#7'9+#"':)0+0';+$+<=+"'>?&'@A?>
3%4/'%5';+=/ 3%<6#"#=7+'3%<6#),+4'B)7+2+"+0'C+/#
D+),%"'E+"<'1 F"+0,$/+0 G#"H+/ G#"H+/ ;+=/I G#"-,)#7 B)7+2+"+0
!"#$!#!$%&'()*(+,-%.,-,)*/ !012%%%%%%%%%%%%%%%%%%%%%%% 3%<6#)J K+2+"+0'C+/# L#7M+'%5';+=/ L#7M+'%5':NM,/J :NM,/J E#O'P#/+ C+/#
3)4/'/54%6,4/ 071!8 9:-;,< !71= !>?1@%%%%%%%%%%%%%%%%%%%%%% ">A!?%%%%%%%%%%%%%%%%%%%%%% AB7!A8 $"7008 !7$$
3CDE !7!1 @@?%%%%%%%%%%%%%%%%%%%%%%%%% !>A@$%%%%%%%%%%%%%%%%%%%%%% ?B7"08 $"7008 0711
D+),%"'E+"<'C F:'G5:) !7"1 ==1%%%%%%%%%%%%%%%%%%%%%%%%% 111%%%%%%%%%%%%%%%%%%%%%%%%% @A7"=8 $"7008 071A
!"#$!#!$%&'()*(+,-%.,-,)*/ $002%%%%%%%%%%%%%%%%%%%%%%%
3)4/'/54%6,4/ ?71!8 G+#) ?QA@
100,/,%)#7'D+),%" 3%4/'%5':NM,/J P+7+2+"+0'C+/#
!"#$!#!$%&'()*(+,-%.,-,)*/ !"#$!#!$%&'/;/''/G%DHI(4J K2%%%%%%%%%%%%%%%%%%%%%%%%%%%% L/,)%M)-/N/'/G%./4, !70"
3)4/'/54%6,4/ 3)4/'/54%6,4/ O',*:>%3)*%C/P4#DHI(4J !00708
O',*:>%3)*%Q,<%6,4/ $"708
DM=';+=/'R'S/.+" !"#$!#!$%9:RR:)%DHI(4J =$?%%%%%%%%%%%%%%%%%%%%%%%%% P+7+2+"+0'C+/# @QTA
!"#$!#!$%&'()*(+,-%.,-,)*/
3)4/'/54%6,4/ 6(5SKT'//%6,4/ !7AB8 *133
L,'S/4%6(5S%&'/R(IR "7@A8 C/P4 !7"A8
S/.+"';+=/ U/N/'/G%./4, "7@0 &'/;/''/G%DHI(4J 07008
!"#$!#!$%&'()*(+,-%.,-,)*/ !02%%%%%%%%%%%%%%%%%%%%%%%%% V(W/%&'/R(IR 07008 9:RR:)%DHI(4J ?7=B8
3)4/'/54%6,4/ 3%4/'%5'3%<<%)':NM,/J B70!8 *133 UQVWX
E%/#7';+=/ W?YZ''''''''''''''''''''''' 3#6,/#7'D/"M$/M"+
C/P4%8 A07008 B7$B8
9:54%:;%C/P4 $7==8 &'/;/''/G%DHI(4J%8 07008 !7AB8
Q,<%6,4/ $"7008 9:RR:)%DHI(4J%8 A07008 A71B8
15/+"'E#O'3%4/'%5';+=/ "7?B8 Q:4,-%DHI(4J%8 A07008 "7@0
070
"7?B8
6(5S%T'//%6,4/ 31FG'G%0+7 $"7008
A%X/,'%QK.:)G !7AB8 A0%G/P4>%A0%/HI(4J
M+G,4/G%,5%:; !"#"#!? 6T !"#$% #"$&%
$0%X/,'%QK.:)G $7008 U/N/'/G%./4, '"()
L6& #"*$% 3%4/'%5':NM,/J
V& )"))% B7$B8
T(),-%YZ99
6(5S%T'//%6,4/
L,'S/4%6(5S%&'/R(IR
U/N/'/G%./4,
V(W/%&'/R(IR
3%4/'%5':NM,/J'R'C+/.+7'B),2+"4,/J
6T%[%U/N/'/G%./4,%<%L6&%K%6T]%[%V&
*133'3%<6%)+)/4
9:54%:;%9:RR:)%DHI(4J
Z;4/'%Q,<%9:54%:;%C/P4
Z55IR/G%Q,<%6,4/
9,+(4,-%V4'I*4I'/
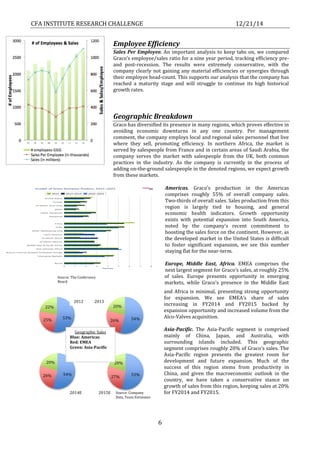
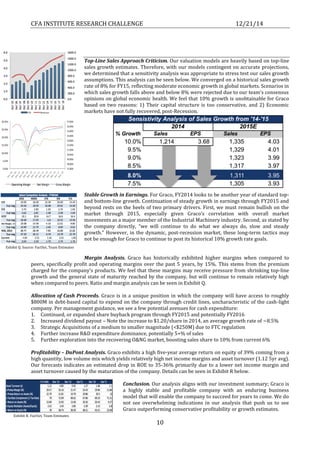
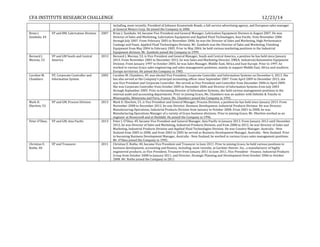
MRP.
Market
Risk
Premium,
as
depicted
in
the
chart
to
the
left,
is
a
blend
of
the
average
Quarter
over
Quarter
returns
of
Graco
(and
competitors)
over
the
S&P500
and
DJIA.
Our
final
number,
5.89%,
is
very
comparable
to
Aswath
Damodaran
and
KPMG’s
numbers
of
5.21%
and
6%,
but
our
calculation
provides
a
more
accurate
representation
of
the
industrial
machinery
industry.](https://image.slidesharecdn.com/23146272-a028-461f-9a3a-eae981db4d16-151005162916-lva1-app6892/85/GGG-20-320.jpg)
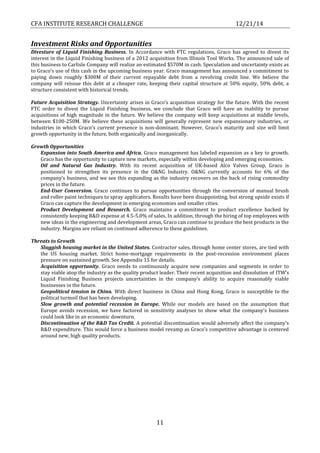
![Disclosures:
Ownership
and
material
conflicts
of
interest:
The
author(s),
or
a
member
of
their
household,
of
this
report
[does
not
hold]
a
financial
interest
in
the
securities
of
this
company.
The
author(s),
or
a
member
of
their
household,
of
this
report
[does
not
know]
of
the
existence
of
any
conflicts
of
interest
that
might
bias
the
content
or
publication
of
this
report.
Receipt
of
compensation:
Compensation
of
the
author(s)
of
this
report
is
not
based
on
investment
banking
revenue.
Position
as
a
officer
or
director:
The
author(s),
or
a
member
of
their
household,
does
not
serve
as
an
officer,
director
or
advisory
board
member
of
the
subject
company.
Market
making:
The
author(s)
does
not
act
as
a
market
maker
in
the
subject
company’s
securities.
Disclaimer:
The
information
set
forth
herein
has
been
obtained
or
derived
from
sources
generally
available
to
the
public
and
believed
by
the
author(s)
to
be
reliable,
but
the
author(s)
does
not
make
any
representation
or
warranty,
express
or
implied,
as
to
its
accuracy
or
completeness.
The
information
is
not
intended
to
be
used
as
the
basis
of
any
investment
decisions
by
any
person
or
entity.
This
information
does
not
constitute
investment
advice,
nor
is
it
an
offer
or
a
solicitation
of
an
offer
to
buy
or
sell
any
security.
This
report
should
not
be
considered
to
be
a
recommendation
by
any
individual
affiliated
with
[Bethel
University],
CFA
Institute
or
the
CFA
Institute
Research
Challenge
with
regard
to
this
company’s
stock.](https://image.slidesharecdn.com/23146272-a028-461f-9a3a-eae981db4d16-151005162916-lva1-app6892/85/GGG-29-320.jpg)


