Collaborative Robot Market by Product Type, Distribution Channel, End User 20...
Final Draft
1. North Dakota State University Student Research
This report is published for educational purposes only by students competing in the CFA Institute Research Challenge.
Graco Inc. (New York: GGG)
Recommendation: HOLD
Price Target: $67.49 High Margins
Current Price: $76.22 Market Cap: 4.53 Bil.
Sector: Industrials
Industry: Machinery
Sub-Industry: Industrial Machinery
Graco: Strong Barriers and Enterprising
Growth
We are issuing a HOLD rating on Graco with a price target of $67.49 per share based on
our discounted cash flow valuation. While our target price is below the current trading
price, a strong business model and competitive advantage make Graco an attractive
company, and since Graco trades at a high P/E compared to similar firms price seems to
be above intrinsic value but this is less likely to weaken key performance measures.
Manufacturing Premium Priced, Highly Engineered Products for
Niche Markets
Graco’s business model of targeting specialized flow control markets has yielded high
ROIC and profit margins for the firm. Focusing on these specialized markets has allowed
the firm to gain economies of scale in difficult to enter markets and charge high prices to
consumers with no feasible substitute to Graco’s highly specialized products.
Breaking the Tradeoff between Profit Margin and Asset
Turnover
Graco’s high-priced, specialized products have yielded high profit margins for the firm,
but they have also maintained uncharacteristically high asset turnover largely due to
good communication and longstanding relations with end users. This has been a
significant driver for Graco’s ROE and ROA.
Significant Barriers to Entry Matched With Cyclical Growth
Graco benefits from high barriers to entry in the markets they serve, and is diversified
across several end markets in the industrials sector. This allows investors in Graco
exposure to cyclical growth while still having relatively secure long term profit because
Graco does not operate in easily contestable markets.
Business Description
Graco manufactures equipment to pump, meter, mix, and dispense fluids and coatings,
specifically for difficult-to-handle materials with high viscosities, abrasive or corrosive
properties and multiple component materials that require precise ratio control. They serve
niche markets where they provide customers value by providing products that reduce use
of labor, materials and energy, improve quality, and achieve environmental compliance.
Drivers of growth in the Industrial Equipment segment include factory movements and
upgrades, integration of equipment with factory data and control systems, reducing
energy consumption, and material changes driving demand. In the Contractor Equipment
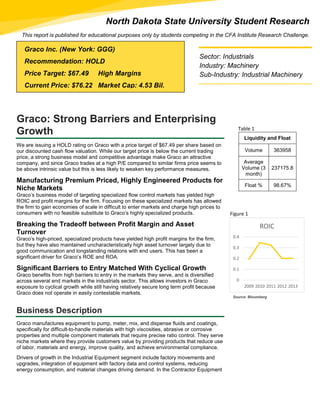
Liquidity and Float
Volume 363958
Average
Volume (3
month)
237175.8
Float % 98.67%
0
0.1
0.2
0.3
0.4
2009 2010 2011 2012 2013
ROIC
Table 1
Figure 1
Source: Bloomberg
2. 2
segment growth drivers include conversion of end users outside of North America from
manual application methods to spraying equipment, application of texture and cement
materials, entry level product and channel expansion, and expanding pavement
maintenance product line and channel. In the Lubrication segment growth drivers include
filling product lines for a single source solution and targeting competition in the industrial
lubrication market. Overall the firm has four strategies for long-term growth; investing in
new products, expending geographically, targeting new markets, and making
acquisitions.
Graco sells a low quantity of products at a high margin and thus has a high proportion of
fixed costs to variable costs. Manufacturing and engineering excellence are highly valued
at Graco so there are high costs for developing new technology and meeting specific end
user needs. To manage high fixed costs and high costs from specialization Graco
centralizes their manufacturing operations geographically, allowing for leveraging of
overhead, and leverages their product technologies for new applications and markets.
Industry Overview and Competitive Positioning
Macroeconomic Analysis
Graco operates in the industrials sector and is well diversified across end markets with
the largest percent of their revenue in 2012 coming from residential and non-residential
construction (40%), the second largest from automotive (15%), the third largest from
Industrial & machinery (13%), and the rest coming from end markets individually
representing less than 10% of revenue (Table 2). With the industrials sector being fairly
cyclical Graco is exposed to quite a bit of systematic risk, their three, five, and ten year
betas are all above one. Also with Graco’s products being the high price premium option
in nearly all their markets they are more exposed to economic downturns than the typical
industrial manufacturing firm. Overall Graco has a lot of systematic exposure, exposure
to the construction market, and to the automotive market.
Based on consensus of analyst’s forecasts we can expect growth in GDP around the
2.85% range in the US in the first half of 2015, slower growth in the Eurozone between
0.74% and 1%, and growth in the 7% range in China. Slow growth in Europe and slower
growth in China are both headwinds for Graco as well as the continued strengthening of
the dollar. But with around half of their revenue generated domestically Graco is set to
benefit from continued economic growth in the US and further recovery in the US housing
market.
Group of Peer Companies
We’ve developed a group of peer companies for Graco listed in appendix B. This group
was selected from Graco’s Bloomberg peers group and screened based on correlation of
revenue, earnings, and market capitalization, and similarities in business operations and
geographical operations.
Five Forces Analysis
Threat of New Entrants
Low: Graco benefits from barriers to entry from a high scale threshold in their markets,
high switching costs, and specialized assets.
Economies of Scale: In 2012 Graco had a total of 40,972 different SKU’s, 91% of
which sold an average between 0-1 units per day and made up nearly half of
their 2012 annual revenue (Table 3). These low units sold per day products are
typically highly specialized industrial equipment produced to meet specific
customer needs. Because these products are highly specialized and need to be
Revenue by End Market
Residential & Non-
Residential
Construction
40%
Automotive 15%
Industrial & Machinery 13%
Other 8%
Mining, Oil & Gas 6%
Public Works 5%
Vehicle Services 4%
Wood 4%
White Goods 3%
Chemical 2%
Table 2
Table 3
Average Number of
Units Sold Per Day # of SKU's
2012 Sales ($
in millions)
0 to 1 37176 (91%) $452 (49%)
2 to 5 2430 (6%) $173 (19%)
6 to 10 307 (1%) $84 (9%)
11 to 15 211 (1%) $40 (4%)
Greater than 15 548 (1%) $170 (19%)
Legacy Graco Total 40,972 $919
Plus: Gema Acquisition $93
Graco 2012 Sales $1,012
*Souce Graco Investor Presentation
3. 3
made of quality materials they are produced at a high marginal cost, and couldn’t
be produced by a competing firm because no other firm is manufacturing
products like this on the scale Graco does.
High Switching Costs: Customers in markets for specialized industrial equipment
could find less specialized substitute products that would be available to them at
a much lower price, but added costs from additional usage of labor, materials,
and energy, or from not being in compliance with environmental standards
makes switching costs in these markets very high.
Specialized Assets: Difficult-to-handle materials require equipment made of
quality materials that need more engineering expertise to produce than typical
industrial equipment. So to operate in these markets firms need very specialized
assets that could not be easily converted to other uses if the firm where to need
to make a strategic move out of the market.
Degree of Rivalry between Firms
Low: Graco experiences a weak degree of rivalry in its markets due to these markets
being concentrated, their leadership position in most of its markets, and having
differentiated products.
According to the 2002 economic census the Pump and pumping equipment
manufacturing industry had a concentration ratio of 21.7% among the four largest
firms and an HHI of 321.6 between the 50 largest firms. Within this industry
Graco targets niche markets where there are typically very few firms competing,
and Graco typically holds a leadership position in most of these markets.
Because Graco is able to serve small markets efficiently this severely dampens
rivalry between them and competing firms. Very few other companies can or do
serve these markets, and for firms that can serve them it is difficult to keep up
with Graco’s technology advances (Graco’s R&D expenditure as a percent of
sales in 2013 of 4.66% far exceeded the average of comparable firms of 2.03%).
Threat of Substitutes
Low: The threat of substitutes for Graco’s products is weak because of their
specialization.
A pump, meter, mixer, or dispenser of a viscous, abrasive, or corrosive material
could not feasibly be replaced by one manufactured for a normal liquid.
Graco’s customers on in the market for specialized industrial equipment because
they deal in products where performance and precision are critically important
and they need reliable equipment, they deal in materials that cannot be handled
by less sophisticated equipment, or need to follow precise regulatory guidelines.
Under these circumstances it is not economically feasible to substitute a Graco
product with a less specialized one.
Bargaining Power of Suppliers
Low to Moderate: Graco’s suppliers have low to moderate bargaining power mostly
driven by moderate switching costs in manufacturing equipment.
Graco gets its raw materials such as steel and aluminum from through multiple
sources so there is little concentration and commodities like these are typically
sold at low margin.
As of 2013 Graco has no unionized workers. They do have a significant amount
of their manufacturing in Minnesota so labor costs are not as low as they could
be but Graco does benefit from a loyal workforce.
There are significant switching costs for the manufacturing equipment used by
Graco, which is the main source of supplier bargaining power facing the firm.
Figure 2
4. 4
Bargaining Power of Customers
Low: Graco’s buyers have little bargaining power because of high switching costs and
fragmented buyers.
These traits are a product of the niche markets Graco operates in and the firm’s
diversification among end markets.
Only construction and automotive end markets take up a significant portion of
Graco’s revenue, and no products sold in any of these markets are critically
important to Graco; therefore no single buyer has much power.
Competitive Advantage
In summary we can see Graco has a distinct competitive advantage derived from their
business strategy of targeting niche markets where they can provide highly engineered
and specialized products. Graco has significant cost advantages over competitors
because of the efficient scale they are able to produce these specialized products at.
Because of their specialization most customers have no feasible substitute to Graco
products. For an example of the lack of viable substitutes in Graco’s markets we’ll look at
Graco’s recently acquired abrasive blasting product line EcoQuip. EcoQuip is significantly
different from other forms of blasting because it is a dry blaster that ejects 92% less
airborne dust during use. Customers have been quoted to use this product because it
could clean delicate materials that other equipment could not, it could be used for interior
blasting because of the well-contained dust, and one customer whose business was
forced to blast at night because of dust complaints was able to now blast during the day
which is obviously much more convenient. Although this is a very specific example it
conveys the unique value-added that is present in most Graco products and cannot be
replaced by less specialized substitutes.
Management & Governance
Management Experience, Compensation, and Capital Allocation
Graco’s management team has provided continued progress for the company’s
operations and investor returns. Senior management has a lengthy track record of both
company loyalty and strong performance within their respective positions with the current
team having an average of 15.6 years of experience with Graco. Executive compensation
aligns with Graco’s continued long term growth strategies as it focuses largely on stock
oriented compensation which increased 192% from 2009 to 2013. With the retirement of
Jim Graner as CFO, there is the possibility of short term turmoil in senior management.
However, with a search committee already in place and the recognition of the change to
come from management, the expected transition from Jim Graner to a new CFO appears
it will go smoothly.
Recently Graco made a deal to acquire ITW’s finishing business for $650 million. Graco
has a great track record of making quality acquisitions as part of their long term growth
strategy, but with ITW they clearly overlooked some of the regulatory risk involved with
the transaction and were forced to sell it in October 2014. Another major decision made
by Graco that differs from their competitors is in regards to their spending on research
and development. Graco currently spends twice as much on R&D as compared to their
competitors and never reduced their spending during the recession of 2008 when
comparable firms did, giving them a competitive advantage when the economy turned
around.
Quality of the Board of Directors
Graco’s board of directors is composed of the nine members and chaired by Lee Mitau.
The board is structured as a unitary board with Graco’s CEO, Patrick McHale serving on
0.000
0.100
0.200
0.300
0.400
0.500
0.600
2009 2010 2011 2012 2013
ROE
Figure 3
Source: Bloomberg
5. 5
the board. Currently Graco has 3 standing committees which are the audit, governance,
and management organization and compensation committee.
Independence: Except Graco’s CEO, Pat McHale, the other eight members are
independent.
Experience: Each board member has previous management experience; Graco’s board
members have on average 14.4 years on their board compared to Nordson’s 6.9 years.
In addition, half of Graco’s audit committee have been designated financial experts.
Resources: Graco’s board has the authority to hire external auditors through their
auditing committee without management’s approval.
Accurate Information of financial and operating position: The board establishes the
financial statement reporting procedures.
Overall, Graco complies with the standard requirements and good practices of corporate
governance.
Financial Analysis
ROE Decomposition
Historically Graco has maintained a high return on equity driven by superior operating
efficiency, asset use efficiency, and appropriate use of leverage, but has seen a decline
recently largely due to the ITW Liquid Finishing businesses sitting on their books. Graco’s
high profit margins are a product of the barriers to entry they have built in their markets.
The firm has seen steady growth in their profit margin since the 2008-2009 financial
crisis. In 2013 their profit margin was 19.1%, above pre-recession levels and well above
their long run average of 11.4%. As was stated above since 2012 there has been roughly
$420 million in short term assets on Graco’s balance sheet due to the FTC’s order for the
firm to hold the business separate until a final order had been made on the acquisition.
Earnings from the liquid finishing business came to Graco in the form of dividend
payments, so the assets were a major draw on asset turnover and brought it to a historic
low of 0.92 and 0.83 in 2012 and 2013 respectively. Historically Graco has had an
average asset turnover of 1.55 since 1988 and has done an outstanding job of
generating revenue on a slim asset base. Even at this recent deflated level Graco’s asset
turnover is about on par with comparable firms while still having a significantly higher
profit margin. This demonstrates one of Graco’s most impressive traits, how they
seemingly reject the typical tradeoff between a high profit margins and high asset
turnover.
Our outlook for Graco’s continued maximization of ROE is largely contingent on the
capital redeployment from the recent divestiture of the liquid finishing business assets.
Net proceeds from the sale are expected to be roughly $570 million. Management has
stated their priorities for the proceeds to be reducing their net debt position to nearly zero
(about $300 million in debt offset by a nearly equal amount of cash), redeploying capital
in acquisitions (will have about $800 million in capital capacity after closing), and to
continue buying back shares to current goal of less than 60 million shares outstanding.
Putting that cash to work will have an obvious benefit to shareholders, but more
importantly the firm will have to find investment opportunities that will sustain their high
margins and long run profitability.
Financial Statement Analysis
Looking more closely at asset use efficiency we can see Graco compares the best to its
peers in total asset turnover, net fixed asset turnover, and accounts receivable turnover
(Table 4). They compare worst to their peers in the inventory turnover category. Its
0.000
0.050
0.100
0.150
0.200
0.250
0.000
0.500
1.000
1.500
2.000
2.500
3.000
20092010201120122013
Decomposition A
Asset Turnover
Equity Multiplier
Profit Margin
Figure 4
0.000
0.500
1.000
1.500
2.000
2.500
3.000
0.000
0.100
0.200
0.300
0.400
0.500
0.600
0.700
0.800
2009 2010 2011 2012 2013
Decomposition B
Tax Burden
ROTA
Compound Leverage Factor
Table 4
Figure 5
Source: Bloomberg
TTM
Average of
comparable
firms (TTM)
Economic Value Added 104.06 55.35
Return on Common Equtiy 35.48% 18.71%
Return on Assets 16.04% 7.92%
Asset Turnover 0.86 0.801
Net Fixed Asset Turnover 7.68 7.54
Accounts Receivable Turnover 5.80 5.55
Inventory Turnover 3.82 4.539
Annualized Days Sales Outstanding 64.55 70.404
Source: Bloomberg
6. 6
trailing twelve month inventory turnover is lower than its 10 year average implying Graco
may have developed a habit of holding excess inventories. However, their turnover in net
fixed assets and accounts receivable are higher than comparable firms, and their
annualized days sales outstanding is significantly lower indicating Graco uses fixed
assets efficiently and collects on receivables quickly.
Graco has strong liquidity ratios (Table 5), showing they are in a very good position to
service short-term debt obligations. Graco’s current assets have been inflated over the
past three years from the Liquid Finishing business acquisition being held separately
from the firm as a short term investment. These assets are mostly offset by long-term
debt. Management has stated that they expect their cash reserves to be reduced to
roughly $300 million when the sale of the liquid finishing business has been completed,
and even at this level of cash Graco will still have a favorable amount of liquidity
compared to its peers.
Graco currently has a debt to equity ratio of 0.8 in the trailing twelve months and a
substantially higher interest coverage ratio and Altman’s Z score than comparable firms.
Historically the firm has done a very good job of using leverage appropriately to maximize
shareholder’s return while still being conservative with their capital structuring decisions
and never putting the firm in serious risk of bankruptcy.
Overall looking at the financials for Graco we can see a history of superior performance
driven by high margins that they have sustained over time (Table 6), uncommonly high
asset turnover matched with this profitability, and good capital structure decisions by
management that enhance return to shareholders while maintaining solvency and
liquidity. Looking forward we expect margins to stay high relative to peers, and continue
rising consistently with their historical rate. Graco’s asset use efficiency will be contingent
on how they can redeploy cash from the liquid finishing business divestiture.
Management targets a revenue growth rate around 9%, coming from 6% organic growth
and 3% revenue growth added on through acquisitions. The outlook to make their
organic growth goal seems favorable based on macroeconomic conditions and conditions
in key end markets. We expect the firm will be able to maintain this superior performance.
Quality of Earnings
To analyze the quality of Graco’s earnings we looked at the company’s accruals ratio
using the cash flows method and compared it to both historic figures for Graco and their
peer group. Historically Graco has a good record of low accruals ratios. There have only
been a few spikes caused by anomalies in the financing of the business, and the ratio
has consistently reverted to normal levels after. Graco’s accrual ratios have been lower
than peers on average during three of the past four years. In 2012 the firm acquiring the
Liquid Finishing Business and having to hold it separately caused their accruals ratio to
spike to 147.12%. Grouping those short term assets in with cash would drop the ratio to
51.1%, and in 2013 the ratio reverted back down to -0.17% (Table 7). Based on our
analysis of Graco’s accrual ratios we feel we can be confident in the quality of earnings
reported.
We also looked at their history of restatements of earnings, late filings over the past five
years, dividend cuts over the past five years and auditor changes in the past three years.
A history of restatements and other forms of accounting irregularities generally signal bad
quality of earnings. Graco has no restatements in the past two years, no late filings in the
past five years, no dividend cuts in the past five years, and no auditor changes in the past
three years. A good record based on these measures further improves our confidence in
the quality of Graco’s earnings.
TTM
Average of
comparable
firms (TTM)
Gross Margin 54.79% 38.63%
Operating Margin 26.08% 15.43%
Pretax Margin 27.28% 14.71%
Profit Margin 19.68% 8.69%
TTM
Average of
comparable
firms (TTM)
Current Ratio 5.28 2.291
Quick Ratio 4.16 1.449
Cash Ratio 2.82 0.628
Debt/Equity 0.80 0.56
Debt/Capital 0.44 0.34
LT Debt/Equity 0.64 0.49
LT Debt/Capital 0.44 0.31
Interest Coverage Ratio 17.28 11.85
Altman's Z 6.46 4.64
Table 5
Table 7
Peer Average
Accruals
Ratio
Graco's
Accruals
Ratio
2010 11.20% 6.45%
2011 14.51% 2.50%
2012 26.62% 147.12%
2013 20.24% -0.17%
Accruals Ratios
Table 6
7. 7
Valuation
Discounted Cash Flow Model
Through the discounted cash flow valuation method we have determined the intrinsic
value of Graco to be $67.49 per share. The discounted cash flow model is our primary
form of valuation and the sole determinant of our price target. Our forecasting method
starts with a forecasting revenue, then forecasting nearly every expense between
revenue and free cash flow to the firm as a percent of sales.
Revenue Forecast
We first estimated 2014 Q4 earnings based on our Autoregressive Integrated Moving
Average (ARIMA) model constructed using Graco’s quarterly revenue and a four quarter
lag in both the autoregressive and moving average parts of the model. Then from 2015 to
2019 our forecast is based on expansion period growth rates and a revenue shock we’ve
incorporated into the forecast to Account for the cyclical nature of Graco’s revenue. The
organic growth rates outlined in the table to the table to the right are driven by favorable
conditions in the construction, automotive, and industrials market which are poised to
benefit from a strong domestic economy, and the firm successfully continuing to develop
new products and make acquisitions that add the target 3% growth to revenue. The
revenue shock represents the economic reality of a recession happening at some point in
the near future and risk from poor economic forecasts in the Eurozone and China. Overall
this estimate yields a CAGR of 6.65% (Table 8) in revenue which is consistent with long
term averages for the firm, and we believe reflects mid-cycle growth.
Margins and Expenses Forecast
We’re forecasting a gross margin of 54.63% in 2014 ramping up to 55.83% by 2019,
which is consistent with Graco’s long term downward trend in cost of goods sold. We’re
forecasting an operating margin of 27.92% in 2014 ramping up to 31.92% in 2019, based
on research and development expenses maintaining a 5% of sales level and non-R&D
operating expenses continuing their long-term downward trend. Effective tax rate was
forecasted as 30% through 2017 then increasing to 32% in 2018 and 2019 to factor in the
uncertainty of Graco’s R&D tax credit continually being renewed every year. Capital
expenditures and changes in net working capital where forecasted as 2.5% and 2% of
sales respectively.
WACC
We’ve calculated Graco’s cost of debt to be 2.37% based on the weighted average
interest rate on Graco’s outstanding bonds, revolving credit, and notes payable to banks.
We calculated Graco’s cost of equity to be 14.12% based on the Fama-French three-
factor model, adjusting the market beta for its mean reverting property (Table 9). Graco’s
SMB and HML coefficients where both positive and statistically significant, causing our
WACC to be higher than one calculated using the CAPM. Since small cap and value
oriented firms have a history of outperforming the market, and Graco’s returns are
positively correlated to this outperformance we believe it’s appropriate to use this higher
discount rate.
Terminal Value
Terminal Value was calculated using the H-Model under the assumptions that it will take
Graco 15 years to reach its maturity period, and that cash flows will grow at 3% in the
mature growth period.
5-year CAGR From
Forecast 6.65%
Average Annual
Growth Rate Since IPO 6.61%
15-year Average
Annual Growth Rate 7.34%
10-year Average
Annual Growth Rate 8.76%
Source: Bloomberg
Wd 0.144558
Cd 0.023686
Tax Rate 0.278616
We 0.855442
Ce 0.141191
= 12.325%
WACC
Table 8
Figure 6
Table 9
8. 8
Multiples Valuation
Through a relative valuation method based on the median EV/EBITDA and P/E multiples
of comparable firms we believe Graco has a fair value of $66 per share with a feasible
range from $50 to $80 based on the highest and lowest reasonably comparable multiples
(Table 10). Because of Graco's large and diversified product line it’s a more challenging
firm to make an accurate peer group for to use for valuation. Firms we’ve chosen to
compare to Graco all operate in specialized industrial manufacturing, but vary in the end
markets they serve and therefore the risks and growth prospects of these markets. With
this in mind we believe the most comparable firm to Graco is Nordson Corp based on the
products they manufacture, their size, and geographic exposure.
Peer Comparison
Compared to Peers Graco’s EV/EBITDA (TTM) of 13.52 is higher than the median of
peers, 11.61, and Nordson, their most comparable firm, with an EV/EBITDA of 12.5.
Judging valuation by P/E ratio Graco is also trading at a comparably higher ratio than the
median of peers, Nordson, and the S&P 500.
The Market is valuing Graco at higher multiples than comparable firms.
We believe this is driven more by Graco’s higher historic ROE and ROIC than its
peer group, than by inflated forecasts of growth
Implied earnings growth rates in EBITDA and EPS by multiples are 9.59% and
9.71% respectively. These rates are fairly consistent with historic growth for
Graco, and our forecast of earnings growth.
Higher valuation than comparable firms is not favorable, but because of Graco’s
record of high ROE and ROIC that will likely be sustained this valuation seems
justified.
Multiples History
Graco’s average annual EV/EBITDA ratio over the past 10 years is 12.5, with the lowest
annual average of 7.3 occurring in 2009 and the highest of 15.8 occurring in 2013. Based
on Figure 7 Graco has traded at an average annual P/E ratio of 22.3 over the past 10
years, with the lowest average annual P/E in that period being 10.8 in 2008 and the
highest being 36.6 in 2010.
Graco’s current valuation multiples are near mid-cycle levels.
Market valuations of Graco are near historic average multiples, making it unlikely
the firm is currently overpriced.
This also implies investors may benefit from waiting for a more favorable market
valuation of Graco.
Estimated Forward Multiples
Based on our forecast of earnings Graco is currently trading at a forward EV/EBITDA
multiple of 10.6 and a forward P/E of 17.52, higher than the forward P/E of the S&P 500
of 17.2.
Benjamin Graham Valuation Methods
Our analysis included use of the modified Graham Formula, not as an indicator of
intrinsic value but as a sanity check for our discounted cash flow model and multiples
valuation. Graham proposed two formulas for valuation; the original formula in the 1962
edition of Security Analysis, and a Revised Formula in 1972. By the original formula
Graco’s value per share is $88.42, and by the revised formula its value is $156.99. By
these methods it seems our valuation of Graco is reasonable given value investing
criteria. The Piotroski F score seen in Appendix O yielded a 6 out of 9 which indicates
overall strength in various key areas. We also used the Benjamin Graham Enterprise
Figure 7
Low Median High
EV/EBITDA
(TTM) 45.81$ 64.32$ 76.22$
P/E (TTM) 23.90$ 65.54$ 76.22$
Multiples of Comparable Firms Valuation
Table 10
EPS 3.65
no-growth P/E 8.5
7-10 year earnings
growth rate 7.862
Value 88.42$
Benjamin Graham Formula
Table 11
9. 9
criteria which met 4 of the 5 criteria, another positive indicator of relative company
strength.
Investment Summary
Hold Recommendation
We give Graco a HOLD recommendation with a price target of $67.49 (Table 12) per
share based on our discounted cash flow valuation. By our judgment a buy
recommendation for a stock would require a return a potential return/loss of 15% to have
an appropriate amount of margin of safety to recommend a buy or sell. Since our price
target yields a potential loss of 11.45% for Graco it is inside our margin of safety and
warrants a hold recommendation.
Graco generates superior return on equity and capital due to its ability to operate
efficiently in niche markets.
Graco’s market position has allowed the firm to generate higher returns
historically than comparable firms. With few risks to their business model we
expect this will continue into the future
Feasible long-term growth strategy to generate sustainable growth in cash flows.
Graco’s four pronged approach to long-term growth includes new product
development, expanding geographically, entering new markets and making
acquisitions. These are solid fundamental approaches for growing the firm and,
given Graco’s market position, are very feasible.
Positioned to gain from cyclical growth in the short-term, with barriers to entry as
a long-term safety net.
Given the end markets Graco serves it is poised to gain from further recovery in
the domestic economy, while having less long-term risk given their strong
barriers to entry that not many other cyclical firms have.
Graco has many traits that make it a good business and attractive investment to
shareholders. By our methods of valuation these traits seem to be fairly reflected in its
current price, justifying our expectation of market performance and a hold
recommendation.
Recent Developments
1/2/2015: Graco announces four acquisitions in the Industrial segment including
High Pressure Equipment Company for $160 million, and three additional
purchases totaling $25 million. The company expects the deals to add $0.13 to
$0.15 to FY 2015 EPS.
10/8/2014: Graco to sell Liquid Finishing business assets for $590 million.
10/1/2014: Graco acquires U.K.-based Alco Valves Group for £72 million.
Earnings Forecast
We are forecasting EPS of $4.35 in 2015, growing to $4.84 by 2019 at a CAGR of 5.2%
over our forecast period. This forecast is driven by revenue growth assumptions which
we’ve outlined in the valuation section, gross and operating margins increasing at a rate
consistent with historic trends, the reduction of dividends after the sale of the Liquid
Finishing Business, and average annual growth historically. Our forecast is significantly
lower than 5 and 10 year average annual growth in earnings of 26.26% and 18.57%
respectively. We believe our forecast is more consistent with mid-cycle growth in
DCF 67.49$
Multiples of
Comparable Firms 66.00$
Graham Valuation 88.42$
Piotrosky's F-Score 6 of 9
Valuation Summary
Table 12
10. 10
earnings. Our forecast of 5.2% growth is lower than the average of analysts’ estimates of
9.3%.
Valuation Summary
Our primary form of valuation, which we used to calculate our price target of $67.49, was
a discounted cash flow model. We also the relative valuation method of multiples of
comparable firms to obtain a fair value estimate of $66, with a reasonable range between
$50 and $80 per share. Finally we incorporated Graham valuation methods as a way to
check if our valuation assumptions met value investing criteria.
Investment Risks
Risks to Operations
Graco’s business model is reliant on high margins derived from premium prices, because
of this they are highly sensitive to consumer demand. In this case, any lag in
technological advancement or mismatch of new product development and end user
needs poses a threat to Graco’s operations through decreasing margins and thus
operating efficiencies.
Risks to Growth Strategy
International growth has proven a key area of improvement for Graco in their growth
strategy; lower than expected market penetration into the region coupled with slowing
trends in the region stemming from areas like the Chinese mining market will prove
troublesome for Graco in the short to midterm. Also, recent and future acquisitions also
pose sizeable risk, as oil prices (Figure 8) have dropped to below 5 year lows and
Graco’s most recent acquisitions have targeted products in oil related markets, including
exploration.
Systematic Risk
A large systematic investment risk posed to Graco involves significant currency
fluctuations and a continued appreciation of the US dollar versus other foreign currencies
(Figure 9). While a large portion of revenues (57%) are derived in the Americas segment,
international revenues have significant impact on total revenues and net income.
Because management has stated that they do not intend to hedge against currency risk
in relation to income, this does provide some risk to our thesis.
Statistical Measures of Risk
For statistical risk measures we used value at risk and standard deviation as
indicators of risk. Our methodology included yearly data spanning back to the IPO of
the firm and different time periods to give a broad picture of statistical risk and
calculations for value at risk can be seen to the right As can be seen in Table 13
statistical risk over time has exceeded benchmarks like the S&P 500 (8.15% since
IPO); however, there is also a significant decrease in risk when considering a more
recent timeframe, which fits with the frame of Graco’s continued development of
operating efficiencies and relatively stable market share in niche markets.
Statistical Risk Measures
Standard
Deviation
Value at
Risk (5%
CI)
IPO 24.82% -20.070%
10
Year 24.86% -26.53%
5
Year 16.24% 1.24%
0
20
40
60
80
100
120
M-14 J-14 S-14 D-14 A-15
WTI Oil Prices
Figure 8
Figure 9
Table 13
12. 12
Appendices
Appendix A
Date
Announced Target Name Seller Name
Announced
Total Value
(mil.) Payment Type Deal Status
1/2/2015 High Pressure Equipment Co 160 Cash Pending
1/2/2015
GeoBlaster Equipment Sales
& Services Inc N/A Cash Completed
1/2/2015
Multimaq-Pistolas e
Equipamentos Para Pintura
Ltd N/A Cash Completed
1/2/2015
White Knight Fluid Handling
Inc N/A Cash Pending
10/8/2014 Liquid Finishing business Graco Inc 590 Cash Pending
10/1/2014 Alco Valves Ltd 116.55 Cash Completed
1/2/2014
Ecoquip Ltd,QED
Environmental Systems Inc N/A Undisclosed Completed
4/14/2011 Finishing Business Illinois Tool Works Inc 650 Cash Completed
10/2/2008
LubeSci Assets,Airlessco
Painting Assets
Lubrication Scientifics
Inc,Durotech Inc 20 Cash Completed
12/3/2007 Cohesant Technologies Inc 35 Cash Completed
7/11/2006 Lubriquip Inc IDEX Corp N/A Undisclosed Completed
9/23/2005 PBL Industries N/A Cash Completed
2/4/2005 Gusmer Corp PMC Global Inc 45 Cash Completed
2/4/2005 Gusmer Europe SL PMC Global Inc 20 Cash Completed
12/21/2004 Liquid Control Corp Inc N/A Cash Completed
3/31/2003 Sharpe Manufacturing Co N/A Undisclosed Completed
3/20/2001
Panatech Research &
Development Corp
Harbour Group
Investments LP N/A Undisclosed Completed
4/28/1999 Bollhoff Verfahrenstechnik N/A Undisclosed Completed
Sources:
Bloomberg,
Graco.com
13. 13
Appendix B
Graco Peer Group
Ticker Company Name Description
GGG Graco
Graco is a manufacturer of specialized materials applicators for a wide
variety of niche markets
IEX Idex Corp
Idex manufactures specialized pumps and pumping equipment for a variety of
markets in the industrials sector and others
FELE Franklin Electric Co.
Franklin designs and manufactures motors for specialized pumping
equipment as well as a variety of other industrial equipment including fans,
heating equipment, pool equipment, and other areas
SPW SPX Corp.
Provides technical components and complete systems for a variety of
markets, but specifically target data transfer and communications networks
ITT ITT Corp.
ITT is a manufacturer of diversified industrial products geared towards end
markets, which includes pumps and applicators as well as brake pads and
connectors
CR Crane Co.
Crane manufactures industrial products for a variety of product lines and
market segments including pumps, as well as vending machines, hydrocarbon
processing
XYL Xylem Inc.
Xylem designs and manufactures equipment and provides services for water
and wasterwater processes, from distribution to dispensing, and includes
pumping equipment along with valves, heat exchangers and others
NDSN Nordon Corp.
Nordson designs and manufactures complete systems that apply adhesives
and other abrasive products for industrial and consumer application
FLS Flowserve Corp.
Flowserve designs, manufactures, and distributes flow management
equipment
including pumps, valves and mechanical seals in various industries
PNR Pentair PLC
Pentair distributes and services products for customers in various segments
including water and other fluids, thermal management, and equipment
protection
CFX Colfax Corp.
Colfax manufactures a variety of fluid handling equipment which includes
pumps, fluid handling systems, and valves serving several markets but
specifically the rotary positive displacement pump segment
14. 14
Appendix C
Beta t-score p-value
3-year 1.312 9.708 0
5-year 1.472 19.986 0
10-year 1.303 25.592 0
Beta Time Series
15. 15
Appendix D
Source from Graco. Com and Bloomberg
Officers Position Affiliate and Description
Chairman
Lee R. Mitau Retired Executive Vice
President and General
Counsel, U.S. Bancorp
Chairman of the Board of Director at Graco Inc. and HB Fuller
Company
Board Member
William Grant Van
Dyke
Retired Chairman,
Donaldson Company
Inc.
Member of the Board of Directors at Graco and Polaris Industries Inc.
Martha A. M.
Morfit
President/CEO at River
Rock Partners Inc. and
CEO at Airborne
Health Inc.
Member of the Board of Directors at Shock Doctor Inc.,
Lululemon Athletica Inc., Life Time Fitness Inc., Intrawest Ulc.,
and Graco Inc.
William J. Carrol CEO at Hybra-Drive
Systems LLC.
Member of the Board of Directors at Graco Inc.
J. Kevin Gilligan Chairman/CEO at
Capella Education
Company
Chairman of the Board of Directors at Capella Education
Company
Member of the Board of Directors at United Subcontractors Inc.,
Capella University, and Graco Inc.
Jack W. Eugster Retired Chairman,
President/CEO at
Musicland Stores
Corporation
Chairman of the Board of Directors at Carleton College
Member of the Board of Directors at Trans-Alarm Inc., Life
Time Fitness Inc. Black Hills Coporation, and Graco Inc.
R. William Van
Sant
Senior Operating
Partner at Tenex
Capital Management
Chairman of the Board of Director at Quintec SA
Vice Chairman of the Board of Directors at HB Fuller
Member of the Board of Directors at Rush Corporation, Graco
Inc., and Amcast Industrial Corporation
Patrick J. McHale President/CEO at
Graco Inc
Member of the Board of Directors at North Memorial Health
Care and Graco Inc.
Eric P. Etchart Senior Vice President
of Business
Development at
Manitowoc Company
Inc.
Member of the Board of Directors at Graco Inc.
16. 16
Appendix E
Graco Inc Income Statement (GGG US) - Standardized
In Millions of USD except Per Share FY 2009 FY 2010 FY 2011 FY 2012 FY 2013
12 Months Ending 2009-12-25 2010-12-31 2011-12-30 2012-12-28 2013-12-27
Revenue 579.2 744.1 895.3 1,012.5 1,104.0
- Cost of Revenue 286.4 340.6 395.1 461.9 496.6
Gross Profit 292.8 403.4 500.2 550.5 607.5
+ Other Operating Revenue 0.0 0.0 0.0 0.0 0.0
- Operating Expenses 218.3 250.3 280.7 325.9 327.7
R&D Expenses 37.5 37.7 41.6 48.9 51.4
SG&A Expenses 180.8 212.6 239.1 276.9 276.3
Operating Income 74.5 153.1 219.5 224.7 279.8
- Interest Expense 4.9 4.2 9.1 19.3 18.1
- Foreign Exchange Losses (Gains) 0.0 0.0 0.0 0.0 0.0
- Net Non-Operating Losses (Gains) 0.9 0.4 0.7 -11.9 -27.2
Pretax Income 68.7 148.5 209.7 217.3 288.8
- Income Tax Expense 19.7 45.7 67.4 68.2 78.0
Income Before XO Items 49.0 102.8 142.3 149.1 210.8
- Extraordinary Loss Net of Tax 0.0 0.0 0.0 0.0 0.0
- Minority Interests 0.0 0.0 0.0 0.0 0.0
Net Income 49.0 102.8 142.3 149.1 210.8
- Total Cash Preferred Dividends 0.0 0.0 0.0 0.0 0.0
- Other Adjustments 0.0 0.0 0.0 0.0 0.0
Net Inc Avail to Common Shareholders 49.0 102.8 142.3 149.1 210.8
Basic EPS 0.82 1.71 2.36 2.47 3.44
Diluted EPS 0.81 1.69 2.32 2.42 3.36
Source: Bloomberg
17. 17
Graco Inc Balance Sheet Forecast (GGG US) - Standardized
In Millions of USD except Per Share FY 2009 FY 2010 FY 2011 FY 2012 FY 2013
Assets
+ Cash & Equivalents 5 10 303 458 442
+ Accounts & Notes Receivable 100.8 124.6 150.9 172.1 183.3
+ Inventories 58.7 91.6 105.3 121.5 133.8
+ Other Current Assets 24.1 26.6 23.6 25.4 33.5
Total Current Assets 189.0 252.4 583.0 777.0 792.6
+ Net Fixed Assets 139.1 134.2 138.2 151.5 151.7
+ Other Long-Term Assets 148.4 143.9 153.1 393.2 382.9
Total Long-Term Assets 287.4 278.1 291.3 544.7 534.6
Total Assets 476.4 530.5 874.3 1,321.7 1,327.2
Liabilities & Shareholders' Equity
+ Accounts Payable 18.0 19.7 27.4 28.9 34.3
+ Short-Term Borrowings 12.0 8.2 8.7 8.1 9.6
+ Other Short-Term Liabilities 73.8 91.9 95.2 114.6 125.0
Total Current Liabilities 103.8 119.8 131.3 151.7 168.9
+ Long-Term Borrowings 86.3 70.3 300.0 556.5 408.4
+ Other Long-Term Liabilities 76.7 76.4 120.3 159.5 115.6
Total Long-Term Liabilities 163.0 146.6 420.3 715.9 524.0
Total Liabilities 266.8 266.4 551.6 867.6 692.9
+ Total Preferred Equity 0.0 0.0 0.0 0.0 0.0
+ Minority Interest 0.0 0.0 0.0 0.0 0.0
+ Share Capital & APIC 250.3 272.1 301.8 348.6 408.1
+ Retained Earnings & Other Equity -40.6 -8.0 21.0 105.6 226.3
Total Equity 209.7 264.1 322.7 454.1 634.4
Total Liabilities & Equity 476.4 530.5 874.3 1,321.7 1,327.2
Source: Bloomberg
18. 18
Graco Inc Statement of Cash Flows Forecast (GGG US) - Standardized
In Millions of USD except Per Share FY 2009 FY 2010 FY 2011 FY 2012 FY 2013
Cash From Operating Activities
+ Net Income 49.0 102.8 142.3 149.1 210.8
+ Depreciation & Amortization 35.1 34.0 32.5 38.8 37.3
+ Other Non-Cash Adjustments 8.6 -0.1 16.8 -6.9 7.0
+ Changes in Non-Cash Capital 53.8 -35.6 -29.6 8.7 -12.1
Cash From Operations 146.5 101.1 162.0 189.7 243.1
Cash From Investing Activities
+ Disposal of Fixed Assets 0.8 0.3 0.4 0.0 1.6
+ Capital Expenditures -11.5 -16.6 -23.9 -18.2 -23.3
+ Increase in Investments 0.0 0.0 0.0 0.0 0.0
+ Decrease in Investments 0.0 0.0 0.0 0.0 0.0
+ Other Investing Activities -2.1 -2.4 -4.6 -676.3 -9.5
Cash From Investing Activities -12.8 -18.8 -28.0 -694.5 -31.2
Cash from Financing Activities
+ Dividends Paid -45.4 -48.1 -50.6 -54.3 -61.1
+ Change in Short-Term Borrowings -6.4 -3.2 0.5 -0.6 1.3
+ Increase in Long-Term Borrowings 78.0 140.5 402.2 649.3 419.9
+ Decrease In Long-Term Borrowings -171.7 -156.5 -172.4 -394.8 -568.1
+ Increase in Capital Stocks 6.9 14.8 24.4 34.4 50.0
+ Decrease in Capital Stocks -0.2 -24.2 -43.3 -1.4 -67.8
+ Other Financing Activities -1.6 -1.4 -1.3 0.1 2.7
Cash from Financing Activities -140.4 -78.2 159.5 232.8 -223.2
Net Changes in Cash -6.7 4.2 293.6 -272.0 -11.4
Source: Bloomberg
19. 19
Appendix F
Graco Inc Income Statement Forecast (GGG US) - Standardized
In Millions of USD except Per Share FY 2014E FY 2015E FY 2016E FY 2017E FY 2018E FY 2019E
12 Months Ending
Revenue 1,219.0 1,346.0 1,501.4 1,351.2 1,507.4 1,681.7
- Cost of Revenue 550.4 601.1 645.5 692.8 743.6 798.0
Gross Profit 668.6 744.9 855.9 658.4 763.8 883.7
+ Other Operating Revenue 0.0 0.0 0.0 0.0 0.0 0.0
- Operating Expenses 324.0 348.3 368.0 388.4 409.7 432.0
R&D Expenses 60.7 66.6 71.9 77.6 83.7 90.3
SG&A Expenses 263.4 281.7 296.1 310.8 326.0 341.6
Operating Income 344.6 396.6 487.9 270.1 354.1 451.7
- Interest Expense 17.5 17.5 17.5 17.5 17.5 17.5
- Foreign Exchange Losses (Gains) 0.0 0.0 0.0 0.0 0.0 0.0
- Net Non-Operating Losses (Gains) 0.0 0.0 0.0 0.0 0.0 0.0
Pretax Income 327.1 379.1 470.4 252.6 336.6 434.2
- Income Tax Expense 98.1 113.7 141.1 75.8 107.7 138.9
Income Before XO Items 229.0 265.3 329.3 176.8 228.9 295.2
- Extraordinary Loss Net of Tax 0.0 0.0 0.0 0.0 0.0 0.0
- Minority Interests 0.0 0.0 0.0 0.0 0.0 0.0
Net Income 229.0 265.3 329.3 176.8 228.9 295.2
- Total Cash Preferred Dividends 0.0 0.0 0.0 0.0 0.0 0.0
- Other Adjustments 0.0 0.0 0.0 0.0 0.0 0.0
Net Inc Avail to Common Shareholders 229.0 265.3 329.3 176.8 228.9 295.2
Basic EPS 3.75 4.35 5.40 2.90 3.75 4.84
Diluted EPS 3.72 4.31 5.35 2.87 3.72 4.80
25. 25
2014 2015 2016 2017 2018 2019 Terminal
226.05 228.92 234.00 192.83 190.91 194.74 2722.21
PV of FCF 3989.66
WACC 0.12325
Total Debt 418 Price 67.49$
Cash and Equiv. 442
Equity Value 4013.66
Shares Outst. 59.469
Present Value of Forecasted Cash Flows
26. 26
Appendix I
Parameter Standard
Estimate Error
Intercept 1 0.54413 0.45226 1.2 0.2306
Mkt_RF 1 1.03763 0.10104 10.27 <.0001
SMB 1 0.55122 0.13975 3.94 0.0001
HML 1 0.81645 0.14256 5.73 <.0001
Adjusted Market Beta 1.0094075
Data Source: Bloomberg, Kenneth R. French Data Library
Estimated market beta adjusted based on mean reverting property. .75+.25*raw beta
Parameter Estimates
Variable DF t Value Pr > |t|
27. 27
Appendix J
Yield Outstanding Amount (in Millions)
Series A 0.01912 75
Series B 0.03104 75
Series C 0.02511 75
Series D 0.03517 75
Average Interest rate (12/27/2013)
Unsecured revolving credit facility 0.0142 108.37
Notes payable to banks 0.0081 9.584
Yield Amount Weight
0.01912 75 0.17945 0.00343
0.03104 75 0.17945 0.00557
0.02511 75 0.17945 0.00451
0.03517 75 0.17945 0.00631
0.0142 108.37 0.25929 0.00368
0.0081 9.584 0.02293 0.00019
417.954
Weighted Average Yield 2.369%
current yield of bonds
Average Interest Rate on other forms of debt
Cost of Debt Calculation
28. 28
Appendix K
ERP Weight
ERP(US) 0.08298 0.539
ERP(EURO) 0.11207 0.256
ERP(CHINA) 0.08805 0.205
Weighted
Average Equity
Risk Premium 0.09147
E(RF) 0.01775
E(SMB) 0.02187
E(HML) 0.02334
Fama French Assumptions
29. 29
Appendix L
free cash flow in period 5 194.74
short-term growth rate 6.647%
long-term (mature) growth rate 3.0%
Years until Mature growth 15
WACC 0.12325
Terminal Value 2722.21
H-Model
32. 32
Appendix O
Benjamin Graham Enterprise Investor screening
Current ratio at least 1.5 Y
No negative earnings in last 5 years Y
Dividends currently being paid Y
Current earnings higher than 5 years ago Y
Stock price less than 120% of assets N
Positiv
e Net
Income
Positive
Operating
Cash Flow
Increasing
ROA
Quality
of
Earnings
Long
Term
Debt
vs.
Assets
Current
Ratio
Shares Out
Same or
Decreasing
Increasing
Gross
Margin
Increasing
Asset
Turnover
Piotroski
F-Score
1 1 1 1 1 0 0 1 0 6
33. 33
Appendix P
The model used to forecast Graco’s revenue is an Autoregressive Integrated Moving
Average Model (ARIMA) with 4th lag on autoregressive part and moving average
part. We decided to use ARIMA instead of Autoregressive Moving Average Model
(ARMA) because we found that Graco’s revenue is integrated of order 1 by a
statistical test called augmented Dickey-Fuller test. This test checks whether or not
data is stationary. Based on the ARIMA model, we forecasted Graco’s revenue for
five quarters and found that 2015 third quarter to be 324.93 million.
0
50
100
150
200
250
300
350
400
0 5 10 15 20 25 30 35 40 45 50
RevenueinMillions
Quearters
Revenue in Millions
Actual Forcasted
34. 34
Dependent Variable:
D(GRACO_REV)
Method: Least Squares
Date: 01/09/15 Time:
16:32
Sample (adjusted):
1991Q2 2014Q3
Included observations: 94
after adjustments
Convergence achieved
after 13 iterations
MA Backcast: 1990Q2
1991Q1
Variable Coefficie
nt
Std. Error t-
Statistic
Prob.
C 33.68234 278.7472 0.12083
5
0.904
1
AR(4) 0.996173 0.031665 31.4596
6
0
MA(4) -0.69509 0.073149 -
9.50237
0
R-squared 0.55046
9
Mean
dependent
var
2.501181
Adjusted R-squared 0.54058
9
S.D.
dependent
var
14.81445
S.E. of regression 10.0412
2
Akaike info
criterion
7.482668
Sum squared resid 9175.17 Schwarz
criterion
7.563837
Log likelihood -348.685 Hannan-
Quinn criter.
7.515455
F-statistic 55.7165
2
Durbin-
Watson stat
1.519079
Prob(F-statistic) 0
Inverted AR Roots 1 .00+1.00i -
.00-
1.00
i
-1
Inverted MA Roots 0.91 .00-.91i
.00+.9
1i
-0.91
35. 35
Appendix Q
In our technical analysis, we used a weekly chart to analyze price movements for
Graco. Since the week of March 13th 2009 Graco’s stock price has been in a strong
upward trend. Currently, price looks like it is in the range bound territory which is
confirmed by the flattening move of both 20 and 50 period simple moving averages.
Also, there is strong support around $66 per share which is verified by two bouncing
back movements and an upper resistance at $80 per share. Additionally, the relative
strength index lies between the 70 and 20 zone; therefore, there is a room for
potential upside movement.
36. 36
Disclosures:
Ownership and material conflicts of interest:
The author(s), or a member of their household, of this report does not hold a financial interest in the
securities of this company.
The author(s), or a member of their household, of this report does not know of the existence of any
conflicts of interest that might bias the content or publication of this report.
Receipt of compensation:
Compensation of the author(s) of this report is not based on investment banking revenue.
Position as an officer or director:
The author(s), or a member of their household, does not serve as an officer, director or advisory board
member of the subject company.
Market making:
The author(s) does not act as a market maker in the subject company’s securities.
Disclaimer:
The information set forth herein has been obtained or derived from sources generally available to the
public and believed by the author(s) to be reliable, but the author(s) does not make any representation or
warranty, express or implied, as to its accuracy or completeness. The information is not intended to be used
as the basis of any investment decisions by any person or entity. This information does not constitute
investment advice, nor is it an offer or a solicitation of an offer to buy or sell any security. This report should
not be considered to be a recommendation by any individual affiliated with North Dakota State University,
CFA Society of Minnesota, CFA Institute or the CFA Institute Research Challenge with regard to this
company’s stock.
CFA Institute Research Challenge