Download to read offline
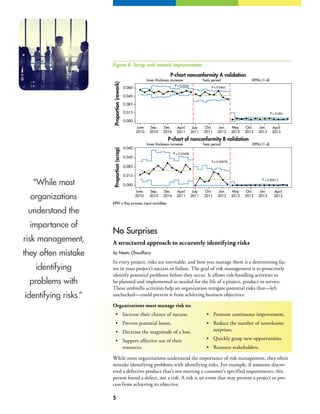


This document summarizes how Six Sigma was used to reduce rework and nonconformities at a Bridgestone tire manufacturing facility. The project addressed two specific nonconformities, A and B, that were occurring on the same product. Prior to the project, the rate of nonconformities was 3.2%. Through applying Six Sigma tools including define, measure, analyze, design and validate phases, the team identified key process inputs, conducted a design of experiments, and ultimately reduced nonconformity A to 0.4% and eliminated nonconformity B completely. The new specifications also reduced material costs by 5%.


![Unemployment_in_the_European_Union[1]](https://cdn.slidesharecdn.com/ss_thumbnails/79d3a8da-6a3c-47bd-94a5-380fa56dbba7-150825185631-lva1-app6892-thumbnail.jpg?width=640&height=640&fit=bounds)


