Download to read offline

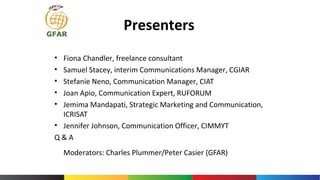

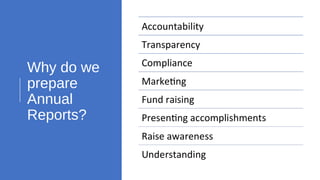
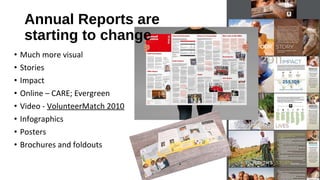
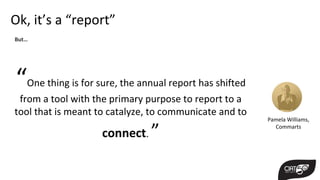
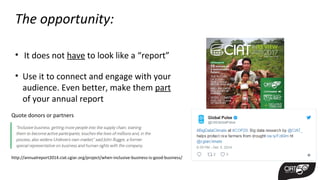
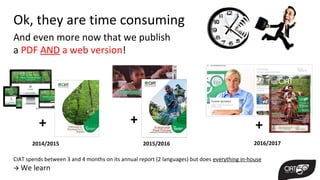


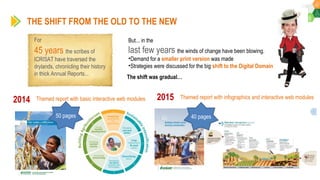
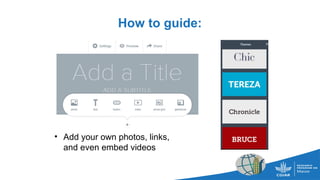

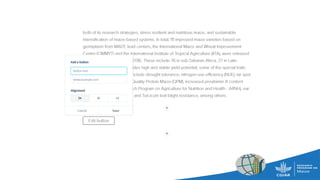
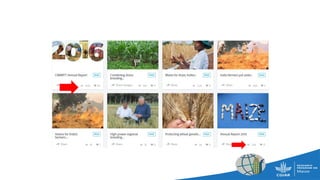
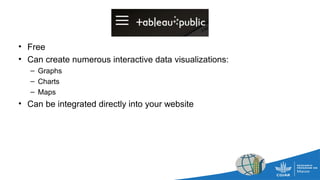


The document outlines a webinar discussing innovative approaches to creating annual reports, highlighting the shift from traditional reporting methods to more engaging formats such as infographics, interactive web modules, and digital media. Presenters from various organizations emphasize the importance of transparency, stakeholder involvement, and the use of technology to make annual reports more visually appealing and accessible. The focus is on turning annual reports from strictly informational tools into opportunities for communication and connection with diverse audiences.


![LITE 2016 – Creating Insightful Reports [Gilles Bell]](https://cdn.slidesharecdn.com/ss_thumbnails/3-161012113300-thumbnail.jpg?width=640&height=640&fit=bounds)


