Download to read offline

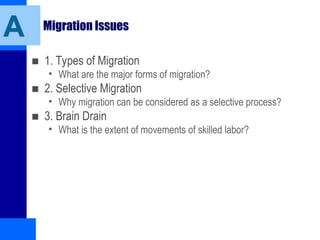
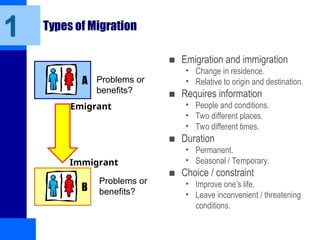
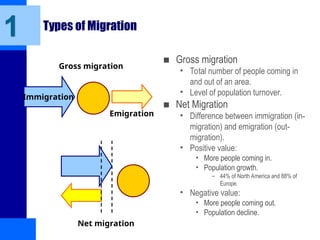
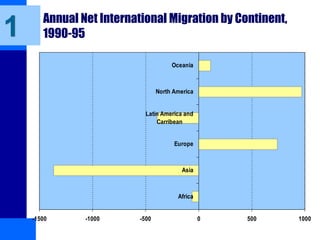
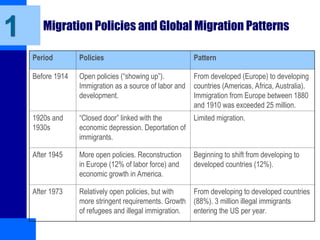
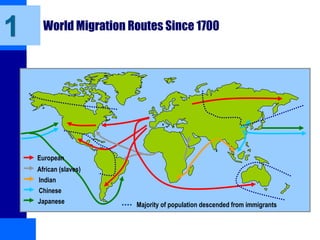
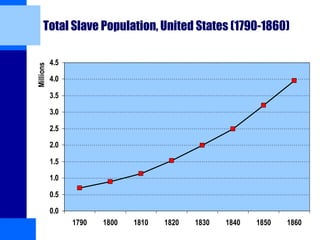
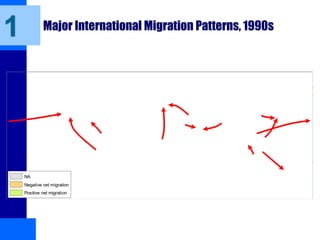
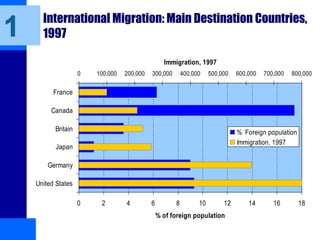
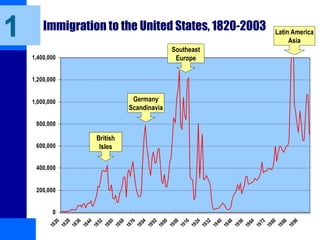
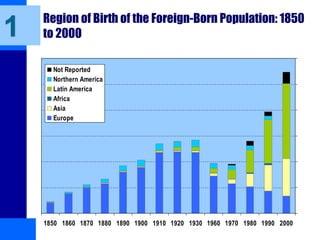
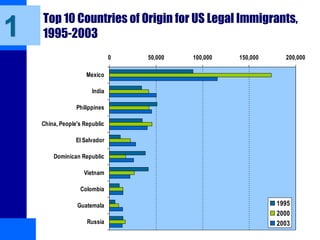
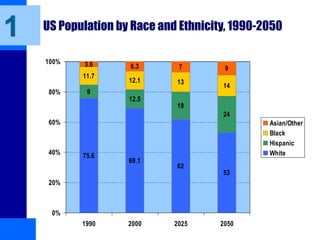
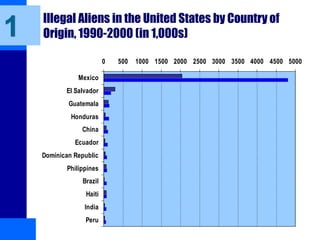
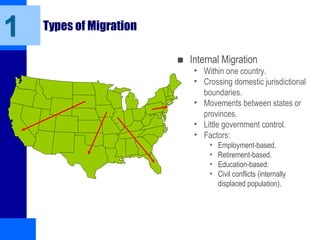
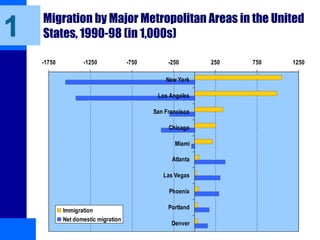


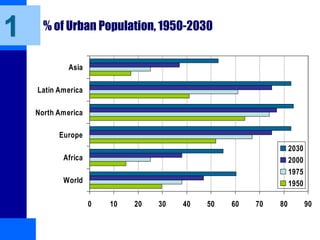
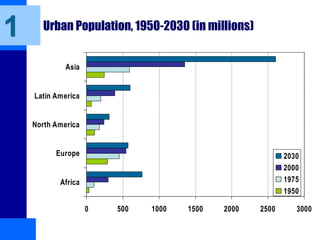
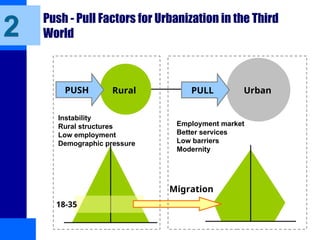
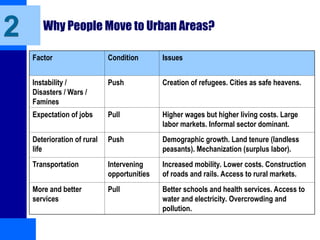
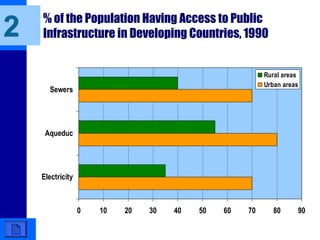
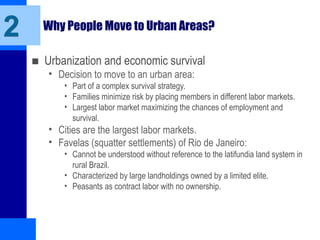

The document discusses migration and urbanization, covering various types of migration, including emigration, immigration, and internal movements, as well as selective migration, brain drain, and migration theories. It examines the push-pull factors affecting migration decisions, the impact of policies, and demographic trends across different continents. Additionally, it highlights the economic implications of labor mobility and remittances, and explores the characteristics of migrants based on age, sex, and education.