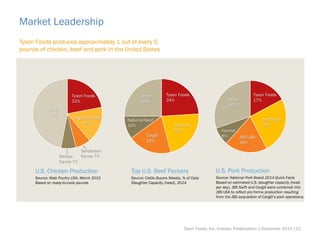
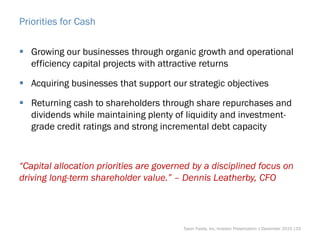
December 2015
Forward-Looking Statements
Certain information contained in this presentation may constitute forward-looking statements, such as statements relating to
expected performance. These forward-looking statements are subject to a number of factors and uncertainties which could
cause our actual results and experiences to differ materially from the anticipated results and expectations expressed in such
forward-looking statements. We wish to caution readers not to place undue reliance on any forward-looking statements, which
speak only as of the date made. Among the factors that may cause actual results and experiences to differ from anticipated
results and expectations expressed in such forward-looking statements are the following: (i) the effect of, or changes in, general
economic conditions; (ii) fluctuations in the cost and availability of inputs and raw materials, such as live cattle, live swine, feed
grains (including corn and soybean meal) and energy; (iii) market conditions for finished products, including competition from
other global and domestic food processors, supply and pricing of competing products and alternative proteins and demand for
alternative proteins; (iv) successful rationalization of existing facilities and operating efficiencies of the facilities; (v) risks
associated with our commodity purchasing activities; (vi) access to foreign markets together with foreign economic conditions,
including currency fluctuations, import/export restrictions and foreign politics; (vii) outbreak of a livestock disease (such as avian
influenza (AI) or bovine spongiform encephalopathy (BSE)), which could have an adverse effect on livestock we own, the
availability of livestock we purchase, consumer perception of certain protein products or our ability to access certain domestic
and foreign markets; (viii) changes in availability and relative costs of labor and contract growers and our ability to maintain good
relationships with employees, labor unions, contract growers and independent producers providing us livestock; (ix) issues
related to food safety, including costs resulting from product recalls, regulatory compliance and any related claims or litigation;
(x) changes in consumer preference and diets and our ability to identify and react to consumer trends; (xi) significant marketing
plan changes by large customers or loss of one or more large customers; (xii) adverse results from litigation; (xiii) impacts on our
operations caused by factors and forces beyond our control, such as natural disasters, fire, bioterrorism, pandemic or extreme
weather; (xiv) risks associated with leverage, including cost increases due to rising interest rates or changes in debt ratings or
outlook; (xv) compliance with and changes to regulations and laws (both domestic and foreign), including changes in accounting
standards, tax laws, environmental laws, agricultural laws and occupational, health and safety laws; (xvi) our ability to make
effective acquisitions or joint ventures and successfully integrate newly acquired businesses into existing operations; (xvii)
failures or security breaches of our information technology systems; (xviii) effectiveness of advertising and marketing programs;
and (xix) those factors listed under Item 1A. “Risk Factors” included in our Annual Report filed on Form 10-K for the period ended
October 3, 2015.
Tyson Foods, Inc. Investor Presentation | December 2015 |2
Highlights
One of the largest food companies in the world
Advantaged brands in advantaged product categories
Multi-protein, multi-channel, all day parts, all meal occasions
#1 or #2 brands in 13 categories
#2 in U.S. frozen food with products in growing categories
Strong cash flow generation
Estimating annual synergies from Hillshire Brands acquisition
of more than $500 million in FY16 and more than $700
million in FY17
Achieved $322 million in synergies in FY15
Tyson Foods, Inc. Investor Presentation | December 2015 |3
Tyson Foods, Inc. Investor Presentation | December 2015 |4
Tyson Foods, Inc. Investor Presentation | December 2015 |5
Tyson Foods, Inc. Investor Presentation | December 2015 |6
Tyson Foods, Inc. Investor Presentation | December 2015 |7
Tyson Foods, Inc. Investor Presentation | December 2015 |8
Tyson Foods, Inc. Investor Presentation | December 2015 |9
Tyson Foods, Inc. Investor Presentation | December 2015 |10
Tyson Foods, Inc. Investor Presentation | December 2015 |11
Tyson Foods is #8 in Total U.S. CPG Retail Sales
Among branded food companies > $5B
Source: IRI Total U.S. Multi-Outlet Sales, 52 weeks ending 11/1/2015
$25.4
$21.9
$16.4
$13.5
$9.0 $8.5
$7.8 $7.8
$6.3 $6.2
$5.6 $5.6 $5.4
Sales in Billions
Tyson Foods, Inc. Investor Presentation | December 2015 |12
Tyson Foods is #2 in Frozen Food
Leads frozen poultry and breakfast foods
Source: IRI U.S. Multi-Outlet frozen category sales, 52 weeks ending 11/1/2015
$7.1
$3.6
$3.2
$2.0 $2.0
$1.8 $1.8
$1.3 $1.2
Sales in Billions
Tyson Foods, Inc. Investor Presentation | December 2015 |13
Multiple Areas to Grow in Large Categories
Tyson Foods, Inc. Investor Presentation | December 2015 |14
87%
76%
70%
62% 61%
55%
38%
31% 29%
7%
26% 26%
33%
23%
Lunchmeat Hot Dogs Uncooked Bacon Breakfast Sausage Smoked Sausage
Frozen Cooked
Prepared Chicken
Frozen Protein
Breakfast
Category HH Penetration Brand HH Penetration
Source: IRI
a) National Consumer Panel for 52 weeks ending 11/1/15
b) Total US Multi-Outlet for 52 weeks ending 11/1/15
Size of Category
Dollar Growth
(2-yr CAGR)
$6.7Bn $2.6Bn $3.6Bn $2.0Bn $2.0Bn $2.6Bn $1.6Bn
+3.7% +1.8% +4.9% +5.8% +7.2% -0.6% +3.3%
Leading Brand Shares in Key Categories
Sources: IRI, Total US Multi-Outlet, 52 weeks ending 11/1/15
*Nielsen Perishables Group, Total U.S. Fresh, 52 weeks ending 09/26/15
Market Share in Leading Categories
Brand Category Share Position
Fresh Chicken* #1
Frozen Cooked Chicken #1
Frozen Uncooked Chicken #1
Frozen Uncooked
Cornish Chicken
#1
Recipe Meats (Refrigerated
Grilled & Ready Strips)
#3
Stack Pack Bacon #1
Branded Bacon #3
Frozen Branded Waffles #2
Market Share in Leading Categories
Brand Category Share Position
Breakfast Sausage #1
Frozen Protein Breakfast #1
Smoked Sausage #1
Branded Lunchmeat #2
Hot Dogs #1
Corn Dogs #1
Super Premium Sausage #1
Tyson Foods, Inc. Investor Presentation | December 2015 |15
Brand Portfolio Participates Across Meal Occasions
Tyson Foods, Inc. Investor Presentation | December 2015 |16
Reframe from Product to Brand
Tyson Foods, Inc. Investor Presentation | December 2015 |17
Products
Tyson Foods, Inc. Investor Presentation | December 2015 |18
New Platforms
Hillshire™ Snacking
Grilled Chicken Bites
Small Plates
Ball Park® Beef Jerky
Tyson Foods, Inc. Investor Presentation | December 2015 |19
Targeting Best-in-Class Innovation Vitality
Tyson Foods, Inc. Investor Presentation | December 2015 |20
% of sales dollars from products created in the previous three years
FY2014 FY2015 Goal
13-15%
11.9% 12.1%
Hillshire Brands
Tyson Retail Brands
Tyson Foods, Inc. Investor Presentation | December 2015 |21
Market Leadership
Tyson Foods produces approximately 1 out of every 5
pounds of chicken, beef and pork in the United States
U.S. Chicken Production
Source: Watt Poultry USA, March 2015
Based on ready-to-cook pounds
Top U.S. Beef Packers
Source: Cattle Buyers Weekly, % of Daily
Slaughter Capacity (head), 2014
U.S. Pork Production
Source: National Pork Board 2014 Quick Facts
Based on estimated U.S. slaughter capacity (head
per day). JBS Swift and Cargill were combined into
JBS USA to reflect pro forma production resulting
from the JBS acquisition of Cargill’s pork operations.
Tyson Foods
22%
Pilgrim’s Pride
17%
Sanderson
Farms 7%Perdue
Farms 7%
Other
47%
Tyson Foods, Inc. Investor Presentation | December 2015 |22
JBS USA
19%
Hormel
8%
Other
30%
Tyson Foods
17%
Smithfield
26%
Tyson Foods
24%
JBS USA
22%
Cargill
19%
National Beef
10%
Other
25%
FY15
$40.6 Billion in Adjusted
Sales*
Up 9% over FY14
5.5% Total Company
Adjusted Return on Sales*
$2.25 Billion in Adjusted
Operating Income*
Up 37% over FY14
$2.6 Billion in
Operating Cash Flow
$3.15 Adjusted EPS*
Up 7% over FY14
*Represents a non-GAAP financial measure. Adjusted sales, operating income, adjusted return on sales
and adjusted EPS are explained and reconciled to comparable GAAP measures in the Appendix.
Tyson Foods, Inc. Investor Presentation | December 2015 |23
FY15 Adjusted Sales* – $40.6 Billion
Sales by Segment Sales by Distribution Channel
Tyson Foods, Inc. Investor Presentation | December 2015 |24
Chicken
27%
Beef
41%
Prepared
Foods
19%
Pork
11%
Other
2%
Other
4%
Consumer
Products
52%
Food
Service
31%
International
13%
*Represents a non-GAAP financial measure, which is explained and reconciled to a comparable GAAP measure in the Appendix.
Tyson Foods FY15 International Sales
FY15 International Sales
$4.6 Billion*
* Based on 52 weeks. Includes all exports and as well as in-country production in China and India. In-country production sales in Mexico and Brazil are excluded as we
sold these operations in FY15.
Tyson Foods, Inc. Investor Presentation | December 2015 |25
South
Korea
8%
Canada
6%
Other
31%
China &
Hong Kong
22%
Japan
15%
Mexico
13%
Taiwan
5%
Tyson Foods FY15 International Sales
FY15 International Chicken Sales*
$1.1 Billion**
* Based on 52 weeks.
** Includes exports and all in-country production in China and India. In-
country production sales in Mexico and Brazil are excluded as we sold these
operations in FY15.
FY15 International Beef Sales*
$2.4 Billion
Tyson Foods, Inc. Investor Presentation | December 2015 |26
China &
Hong Kong
27%
Brazil 7%
India 6%
Mexico
5%UAE
4%
Other
41%
Taiwan
3%
Puerto
Rico
3%
Russia
2%
Angola
2%
Other
13% China &
Hong Kong
26%
Japan
14%
Mexico
13%
South
Korea
13%
Taiwan 7%
Italy 6%
Canada
4%
Vietnam
4%
Tyson Foods FY15 International Sales
FY15 International Pork Sales*
$938 Million
FY15 International Prepared Foods Sales*
$126 Million
Tyson Foods, Inc. Investor Presentation | December 2015 |27
Japan
35%
Mexico
23%
Canada
14%
Other
13%
China & H.K.
9%
Canada
48%
Mexico
19%
Puerto Rico
6%
Japan 4%
Other
23%S. Korea
6%
* Based on 52 weeks.
Adjusted EPS* Growth
*Represents a non-GAAP financial measure. Adjusted EPS is explained and reconciled to a comparable GAAP measure in the Appendix.
** Projected EPS guidance as of 11/23/15
Tyson Foods, Inc. Investor Presentation | December 2015 |28
FY12 FY13 FY14 FY15 FY16 proj.
$2.94
$1.97
$2.26
$3.15
$3.50-3.65**
Tyson Foods Financial Trends
**Represents a non-GAAP financial measure.
EBITDA is explained and reconciled in the Appendix.
Sales (Bn) EBITDA** (MM)
Tyson Foods, Inc. Investor Presentation | December 2015 |29
$32.0
$33.1
$34.4
$37.6
$40.6*
FY11 FY12 FY13 FY14 FY15
$1,767 $1,731 $1,818 $1,897
$2,906
FY11 FY12 FY13 FY14 FY15
*Adjusted sales represents a non-GAAP financial measure,
which is explained and reconciled in the Appendix.
Net Debt/EBITDA*
FY10-13 = ~1×
FY 2014 Adjusted Pro Forma Basis = ~3×
FY 2015 Adjusted Basis = ~2.0x
*Net Debt and EBITDA are non-GAAP financial measures. EBITDA is explained and reconciled to a comparable GAAP measure in the Appendix. Net Debt to EBITDA
represents the ratio of our debt, net of cash and short-term investments, to EBITDA. Net Debt to EBITDA is presented as a supplemental financial measurement in the
evaluation of our business.
Tyson Foods, Inc. Investor Presentation | December 2015 |30
FY2016 Outlook
Adjusted EPS* of $3.50-3.65**
Approximately 11-16% growth over FY15
Sales of ~$41B
Growing current businesses to offset impact of
divestitures
Synergy expectations of more than
$500 million
Prepared Foods Segment margins near
the low end of the 10-12% range
Chicken Segment margins exceeding 10%
Pork Segment in its normalized range
of 6-8% margins
Beef Segment should approximate the low
end of the newly revised normalized range
of 1.5-3.0%
*Represents a non-GAAP financial measure.
** Projected adjusted EPS guidance as of November 23, 2015
Tyson Foods, Inc. Investor Presentation | December 2015 |31
Synergies
FY15 – $322 million realized
FY16 – expecting more than $500 million
FY17 – expecting more than $700 million
Synergy Categories:
 Prepared Foods Improvements
 Procurement
 Manufacturing & Logistics
 Organizational & Fiduciary
Tyson Foods, Inc. Investor Presentation | December 2015 |32
Priorities for Cash
 Growing our businesses through organic growth and operational
efficiency capital projects with attractive returns
 Acquiring businesses that support our strategic objectives
 Returning cash to shareholders through share repurchases and
dividends while maintaining plenty of liquidity and investment-
grade credit ratings and strong incremental debt capacity
“Capital allocation priorities are governed by a disciplined focus on
driving long-term shareholder value.” – Dennis Leatherby, CFO
Tyson Foods, Inc. Investor Presentation | December 2015 |33
Debt Maturity Profile
Debt Maturity Skyline – as of 10.3.15
Fiscal Year Maturities
($ in millions)
Tyson Foods, Inc. Investor Presentation | December 2015 |34
• Term loans are pre-payable at par.
• Excludes $140MM Tangible Equity Units amortizing note, $18MM TFI senior note due 2028, and $59MM other
miscellaneous debt (e.g. capital leases, foreign debt, and discount on senior notes).
• $1.25 billion revolving credit facility matures FY19; outstanding balance as of 10-3-15 was $0.
0
250
500
750
1,000
1,250
1,500
1,750
'16 '17 '18 '19 '20 '21 '22 '23 '24 '33 '34 '44
TFI Bonds Hillshire Bonds Term Loans
Pre-Payable
Pre-Payable
Why TSN?
Consistent growth
Higher, more stable earnings over time
Advantaged brands in advantaged categories
Innovation and insights
Synergies
Depth and breadth of portfolio to reach consumers at all
day parts, all meal occasions, at home and away from home
Built for Growth
Tyson Foods, Inc. Investor Presentation | December 2015 |35
Appendix
Adjusted EPS Reconciliation
Tyson Foods, Inc. Investor Presentation | December 2015 |37
Unaudited
EPS EPS EPS EPS EPS
Reported net income per share attributable to Tyson 2.95$ 2.37$ 2.31$ 1.68$ 1.98$
Less:
Recognition of previously unrecognized tax benefit (0.06) (0.15) - - -
Insurance proceeds (net of costs) related to a legacy Hillshire Brands
plant fire
(0.02) - - - -
Gain on sale of equity securities (0.03) - - - -
Gain on sale of Mexico operation (0.24) - - - -
Impact of additional week (0.06) - - - -
Gain from currency translation adjustment - - (0.05) - -
Gain on sale of equity method investment - - - - (0.03)
Reversal of reserves for foreign uncertain tax positions - - - - (0.05)
Add:
China Impairment 0.41 - - - -
Merger and integration costs 0.09 - - - -
Prepared Foods network optimization charges 0.09 - - - -
Dension plant closure 0.02 - - - -
Loss related to early extinguishment of debt - - - 0.29 -
Brazil impairment/Mexico undistributed earnings tax - 0.16 - - -
Hillshire Brands acquisition, integration and costs associated with our
Prepared Foods improvement plan
- 0.37 - - -
Hillshire Brands post-closing results, purchase price accounting and costs
related to a legacy Hillshire Brands plant fire
- 0.07 - - -
Hillshire Brands acquisition financing incremental interest costs and share
dilution
- 0.12 - - -
Adjusted net income per share attributable to Tyson 3.15$ 2.94$ 2.26$ 1.97$ 1.90$
12 Months Ended
October 3, 2015 September 27, 2014 September 28, 2013 September 29, 2012 October 1, 2011
Adjusted net income from continuing operations per share attributable to Tyson (adjusted EPS) is presented as a supplementary financial measurement in the evaluation of our business. We believe
the presentation of adjusted EPS helps investors assess our financial performance from period to period and enhance understanding of our financial performance; however, adjusted EPS may not be
comparable to those of other companies in our industry, which limits the usefulness as comparative measures. Adjusted EPS is not a measure required by or calculated in accordance with GAAP and
should not be considered as a substitute for any measure of financial performance reported in accordance with GAAP. Investors should rely primarily on our GAAP results and use non-GAAP financial
measures only supplementally in making investment decisions.
EBITDA Reconciliations
Tyson Foods, Inc. Investor Presentation | December 2015 |38
$ In millions
Unaudited
(a) Includes income tax expense of discontinued operation.
(b) Excludes the amortization of debt discount expense of $10 million, $10 million, $28 million, $39 million and $44 million for fiscal 2015, 2014, 2013, 2012 and 2011, respectively, as it is
included in Interest expense.
EBITDA represents net income, net of interest, income tax and depreciation and amortization. We believe the presentation of this financial measure helps investors to assess our operating
performance from period to period, including our ability to generate earnings sufficient to service our debt, and enhances understanding of our financial performance and highlights operational trends.
This measure is widely used by investors and rating agencies in the valuation, comparison, rating and investment recommendations of companies; however, the measurement of EBITDA may not be
comparable to those of other companies, which limits their usefulness as comparative measures. EBITDA is not a measure required by or calculated in accordance with generally accepted accounting
principles (GAAP) and should not be considered as a substitute for net income or any other measure of financial performance reported in accordance with GAAP or as a measure of operating cash flow
or liquidity. EBITDA is a useful tool for assessing, but is not a reliable indicator of, our ability to generate cash to service our debt obligations because certain of the items added to net income to
determine EBITDA involve outlays of cash. As a result, actual cash available to service our debt obligations will be different from EBITDA. Investors should rely primarily on our GAAP results and use
non-GAAP financial measures only supplementally in making investment decisions.
2015 2014 2013 2012 2011
Net income 1,224$ 856$ 778$ 576$ 733$
Less: Interest income (9) (7) (7) (12) (11)
Add: Interest expense 293 132 145 356 242
Add: Income tax expense (a) 697 396 411 351 341
Add: Depreciation 609 494 474 443 433
Add: Amortization (b) 92 26 17 17 29
EBITDA 2,906$ 1,897$ 1,818$ 1,731$ 1,767$
12 Months Ended
Adjusted Sales, Adjusted Operating Income (Loss), Adjusted
Operating Margin Reconciliations
Tyson Foods, Inc. Investor Presentation | December 2015 |39
$ In millions
Unaudited
(a) The estimated impact of the additional week in the 12 months of fiscal 2015 was calculated by dividing unadjusted sales for the fourth quarter of fiscal 2015 by 14 weeks.
(b) Impact of additional week was calculated by using the fourth quarter of fiscal 2015 adjusted operating income (prior to the additional week impact) divided by 14 weeks.
Chicken Beef Pork
Prepared
Foods Other
Intersegment
Sales Total
Reported sales 11,390$ 17,236$ 5,262$ 7,822$ 879$ (1,216)$ 41,373$
Less: Estimated impact of additional week (a) (216) (315) (93) (143) (8) 25 (750)
Adjusted sales 11,174$ 16,921$ 5,169$ 7,679$ 871$ (1,191)$ 40,623$
Reported operating income (loss) 1,366$ (66)$ 380$ 588$ (99)$ -$ 2,169$
Add: China impairment - - - - 169 - 169
Add: Merger and integration costs - - - 10 47 - 57
Add: Prepared Foods network optimization charges - - - 59 - - 59
Add: Denison plant closure - 12 - - - - 12
Less: Insurance proceeds (net of costs) related to a legacy Hillshire
Brands plant fire - - - (8) - - (8)
Less: Gain on sale of the Mexico operation - - - - (161) - (161)
Adjusted operating income prior to adjustment for additional week 1,366 (54) 380 649 (44) - 2,297
Less: Estimated impact of additional week (b) (26) 1 (7) (13) 1 - (44)
Adjusted operating income (loss) 1,340$ (53)$ 373$ 636$ (43)$ -$ 2,253$
Adjusted operating margin % 12.0% -0.3% 7.2% 8.3% n/a n/a 5.5%
(for the 12 months ended October 3, 2015)
Adjusted Sales, Adjusted Operating Income (Loss) and Adjusted Operating Margin
Adjusted sales, adjusted operating income and adjusted operating margin are presented as supplementary financial measurements in the evaluation of our business. We believe the presentation of
adjusted sales, adjusted operating income and adjusted operating margin helps investors assess our financial performance from period to period and enhances understanding of our financial
performance; however, adjusted sales, adjusted operating income and adjusted operating margin may not be comparable to those of other companies in our industry, which limits the usefulness as
comparative measures. Adjusted sales, adjusted operating income and adjusted operating margin are not measures required by or calculated in accordance with GAAP and should not be considered
as substitutes for any measures of financial performance reported in accordance with GAAP. Investors should rely primarily on our GAAP results and use non-GAAP financial measures only
supplementally in making investment decisions.

Tsn investor presentation december 2015

  • 1.
  • 2.
    Forward-Looking Statements Certain informationcontained in this presentation may constitute forward-looking statements, such as statements relating to expected performance. These forward-looking statements are subject to a number of factors and uncertainties which could cause our actual results and experiences to differ materially from the anticipated results and expectations expressed in such forward-looking statements. We wish to caution readers not to place undue reliance on any forward-looking statements, which speak only as of the date made. Among the factors that may cause actual results and experiences to differ from anticipated results and expectations expressed in such forward-looking statements are the following: (i) the effect of, or changes in, general economic conditions; (ii) fluctuations in the cost and availability of inputs and raw materials, such as live cattle, live swine, feed grains (including corn and soybean meal) and energy; (iii) market conditions for finished products, including competition from other global and domestic food processors, supply and pricing of competing products and alternative proteins and demand for alternative proteins; (iv) successful rationalization of existing facilities and operating efficiencies of the facilities; (v) risks associated with our commodity purchasing activities; (vi) access to foreign markets together with foreign economic conditions, including currency fluctuations, import/export restrictions and foreign politics; (vii) outbreak of a livestock disease (such as avian influenza (AI) or bovine spongiform encephalopathy (BSE)), which could have an adverse effect on livestock we own, the availability of livestock we purchase, consumer perception of certain protein products or our ability to access certain domestic and foreign markets; (viii) changes in availability and relative costs of labor and contract growers and our ability to maintain good relationships with employees, labor unions, contract growers and independent producers providing us livestock; (ix) issues related to food safety, including costs resulting from product recalls, regulatory compliance and any related claims or litigation; (x) changes in consumer preference and diets and our ability to identify and react to consumer trends; (xi) significant marketing plan changes by large customers or loss of one or more large customers; (xii) adverse results from litigation; (xiii) impacts on our operations caused by factors and forces beyond our control, such as natural disasters, fire, bioterrorism, pandemic or extreme weather; (xiv) risks associated with leverage, including cost increases due to rising interest rates or changes in debt ratings or outlook; (xv) compliance with and changes to regulations and laws (both domestic and foreign), including changes in accounting standards, tax laws, environmental laws, agricultural laws and occupational, health and safety laws; (xvi) our ability to make effective acquisitions or joint ventures and successfully integrate newly acquired businesses into existing operations; (xvii) failures or security breaches of our information technology systems; (xviii) effectiveness of advertising and marketing programs; and (xix) those factors listed under Item 1A. “Risk Factors” included in our Annual Report filed on Form 10-K for the period ended October 3, 2015. Tyson Foods, Inc. Investor Presentation | December 2015 |2
  • 3.
    Highlights One of thelargest food companies in the world Advantaged brands in advantaged product categories Multi-protein, multi-channel, all day parts, all meal occasions #1 or #2 brands in 13 categories #2 in U.S. frozen food with products in growing categories Strong cash flow generation Estimating annual synergies from Hillshire Brands acquisition of more than $500 million in FY16 and more than $700 million in FY17 Achieved $322 million in synergies in FY15 Tyson Foods, Inc. Investor Presentation | December 2015 |3
  • 4.
    Tyson Foods, Inc.Investor Presentation | December 2015 |4
  • 5.
    Tyson Foods, Inc.Investor Presentation | December 2015 |5
  • 6.
    Tyson Foods, Inc.Investor Presentation | December 2015 |6
  • 7.
    Tyson Foods, Inc.Investor Presentation | December 2015 |7
  • 8.
    Tyson Foods, Inc.Investor Presentation | December 2015 |8
  • 9.
    Tyson Foods, Inc.Investor Presentation | December 2015 |9
  • 10.
    Tyson Foods, Inc.Investor Presentation | December 2015 |10
  • 11.
    Tyson Foods, Inc.Investor Presentation | December 2015 |11
  • 12.
    Tyson Foods is#8 in Total U.S. CPG Retail Sales Among branded food companies > $5B Source: IRI Total U.S. Multi-Outlet Sales, 52 weeks ending 11/1/2015 $25.4 $21.9 $16.4 $13.5 $9.0 $8.5 $7.8 $7.8 $6.3 $6.2 $5.6 $5.6 $5.4 Sales in Billions Tyson Foods, Inc. Investor Presentation | December 2015 |12
  • 13.
    Tyson Foods is#2 in Frozen Food Leads frozen poultry and breakfast foods Source: IRI U.S. Multi-Outlet frozen category sales, 52 weeks ending 11/1/2015 $7.1 $3.6 $3.2 $2.0 $2.0 $1.8 $1.8 $1.3 $1.2 Sales in Billions Tyson Foods, Inc. Investor Presentation | December 2015 |13
  • 14.
    Multiple Areas toGrow in Large Categories Tyson Foods, Inc. Investor Presentation | December 2015 |14 87% 76% 70% 62% 61% 55% 38% 31% 29% 7% 26% 26% 33% 23% Lunchmeat Hot Dogs Uncooked Bacon Breakfast Sausage Smoked Sausage Frozen Cooked Prepared Chicken Frozen Protein Breakfast Category HH Penetration Brand HH Penetration Source: IRI a) National Consumer Panel for 52 weeks ending 11/1/15 b) Total US Multi-Outlet for 52 weeks ending 11/1/15 Size of Category Dollar Growth (2-yr CAGR) $6.7Bn $2.6Bn $3.6Bn $2.0Bn $2.0Bn $2.6Bn $1.6Bn +3.7% +1.8% +4.9% +5.8% +7.2% -0.6% +3.3%
  • 15.
    Leading Brand Sharesin Key Categories Sources: IRI, Total US Multi-Outlet, 52 weeks ending 11/1/15 *Nielsen Perishables Group, Total U.S. Fresh, 52 weeks ending 09/26/15 Market Share in Leading Categories Brand Category Share Position Fresh Chicken* #1 Frozen Cooked Chicken #1 Frozen Uncooked Chicken #1 Frozen Uncooked Cornish Chicken #1 Recipe Meats (Refrigerated Grilled & Ready Strips) #3 Stack Pack Bacon #1 Branded Bacon #3 Frozen Branded Waffles #2 Market Share in Leading Categories Brand Category Share Position Breakfast Sausage #1 Frozen Protein Breakfast #1 Smoked Sausage #1 Branded Lunchmeat #2 Hot Dogs #1 Corn Dogs #1 Super Premium Sausage #1 Tyson Foods, Inc. Investor Presentation | December 2015 |15
  • 16.
    Brand Portfolio ParticipatesAcross Meal Occasions Tyson Foods, Inc. Investor Presentation | December 2015 |16
  • 17.
    Reframe from Productto Brand Tyson Foods, Inc. Investor Presentation | December 2015 |17
  • 18.
    Products Tyson Foods, Inc.Investor Presentation | December 2015 |18
  • 19.
    New Platforms Hillshire™ Snacking GrilledChicken Bites Small Plates Ball Park® Beef Jerky Tyson Foods, Inc. Investor Presentation | December 2015 |19
  • 20.
    Targeting Best-in-Class InnovationVitality Tyson Foods, Inc. Investor Presentation | December 2015 |20 % of sales dollars from products created in the previous three years FY2014 FY2015 Goal 13-15% 11.9% 12.1% Hillshire Brands Tyson Retail Brands
  • 21.
    Tyson Foods, Inc.Investor Presentation | December 2015 |21
  • 22.
    Market Leadership Tyson Foodsproduces approximately 1 out of every 5 pounds of chicken, beef and pork in the United States U.S. Chicken Production Source: Watt Poultry USA, March 2015 Based on ready-to-cook pounds Top U.S. Beef Packers Source: Cattle Buyers Weekly, % of Daily Slaughter Capacity (head), 2014 U.S. Pork Production Source: National Pork Board 2014 Quick Facts Based on estimated U.S. slaughter capacity (head per day). JBS Swift and Cargill were combined into JBS USA to reflect pro forma production resulting from the JBS acquisition of Cargill’s pork operations. Tyson Foods 22% Pilgrim’s Pride 17% Sanderson Farms 7%Perdue Farms 7% Other 47% Tyson Foods, Inc. Investor Presentation | December 2015 |22 JBS USA 19% Hormel 8% Other 30% Tyson Foods 17% Smithfield 26% Tyson Foods 24% JBS USA 22% Cargill 19% National Beef 10% Other 25%
  • 23.
    FY15 $40.6 Billion inAdjusted Sales* Up 9% over FY14 5.5% Total Company Adjusted Return on Sales* $2.25 Billion in Adjusted Operating Income* Up 37% over FY14 $2.6 Billion in Operating Cash Flow $3.15 Adjusted EPS* Up 7% over FY14 *Represents a non-GAAP financial measure. Adjusted sales, operating income, adjusted return on sales and adjusted EPS are explained and reconciled to comparable GAAP measures in the Appendix. Tyson Foods, Inc. Investor Presentation | December 2015 |23
  • 24.
    FY15 Adjusted Sales*– $40.6 Billion Sales by Segment Sales by Distribution Channel Tyson Foods, Inc. Investor Presentation | December 2015 |24 Chicken 27% Beef 41% Prepared Foods 19% Pork 11% Other 2% Other 4% Consumer Products 52% Food Service 31% International 13% *Represents a non-GAAP financial measure, which is explained and reconciled to a comparable GAAP measure in the Appendix.
  • 25.
    Tyson Foods FY15International Sales FY15 International Sales $4.6 Billion* * Based on 52 weeks. Includes all exports and as well as in-country production in China and India. In-country production sales in Mexico and Brazil are excluded as we sold these operations in FY15. Tyson Foods, Inc. Investor Presentation | December 2015 |25 South Korea 8% Canada 6% Other 31% China & Hong Kong 22% Japan 15% Mexico 13% Taiwan 5%
  • 26.
    Tyson Foods FY15International Sales FY15 International Chicken Sales* $1.1 Billion** * Based on 52 weeks. ** Includes exports and all in-country production in China and India. In- country production sales in Mexico and Brazil are excluded as we sold these operations in FY15. FY15 International Beef Sales* $2.4 Billion Tyson Foods, Inc. Investor Presentation | December 2015 |26 China & Hong Kong 27% Brazil 7% India 6% Mexico 5%UAE 4% Other 41% Taiwan 3% Puerto Rico 3% Russia 2% Angola 2% Other 13% China & Hong Kong 26% Japan 14% Mexico 13% South Korea 13% Taiwan 7% Italy 6% Canada 4% Vietnam 4%
  • 27.
    Tyson Foods FY15International Sales FY15 International Pork Sales* $938 Million FY15 International Prepared Foods Sales* $126 Million Tyson Foods, Inc. Investor Presentation | December 2015 |27 Japan 35% Mexico 23% Canada 14% Other 13% China & H.K. 9% Canada 48% Mexico 19% Puerto Rico 6% Japan 4% Other 23%S. Korea 6% * Based on 52 weeks.
  • 28.
    Adjusted EPS* Growth *Representsa non-GAAP financial measure. Adjusted EPS is explained and reconciled to a comparable GAAP measure in the Appendix. ** Projected EPS guidance as of 11/23/15 Tyson Foods, Inc. Investor Presentation | December 2015 |28 FY12 FY13 FY14 FY15 FY16 proj. $2.94 $1.97 $2.26 $3.15 $3.50-3.65**
  • 29.
    Tyson Foods FinancialTrends **Represents a non-GAAP financial measure. EBITDA is explained and reconciled in the Appendix. Sales (Bn) EBITDA** (MM) Tyson Foods, Inc. Investor Presentation | December 2015 |29 $32.0 $33.1 $34.4 $37.6 $40.6* FY11 FY12 FY13 FY14 FY15 $1,767 $1,731 $1,818 $1,897 $2,906 FY11 FY12 FY13 FY14 FY15 *Adjusted sales represents a non-GAAP financial measure, which is explained and reconciled in the Appendix.
  • 30.
    Net Debt/EBITDA* FY10-13 =~1× FY 2014 Adjusted Pro Forma Basis = ~3× FY 2015 Adjusted Basis = ~2.0x *Net Debt and EBITDA are non-GAAP financial measures. EBITDA is explained and reconciled to a comparable GAAP measure in the Appendix. Net Debt to EBITDA represents the ratio of our debt, net of cash and short-term investments, to EBITDA. Net Debt to EBITDA is presented as a supplemental financial measurement in the evaluation of our business. Tyson Foods, Inc. Investor Presentation | December 2015 |30
  • 31.
    FY2016 Outlook Adjusted EPS*of $3.50-3.65** Approximately 11-16% growth over FY15 Sales of ~$41B Growing current businesses to offset impact of divestitures Synergy expectations of more than $500 million Prepared Foods Segment margins near the low end of the 10-12% range Chicken Segment margins exceeding 10% Pork Segment in its normalized range of 6-8% margins Beef Segment should approximate the low end of the newly revised normalized range of 1.5-3.0% *Represents a non-GAAP financial measure. ** Projected adjusted EPS guidance as of November 23, 2015 Tyson Foods, Inc. Investor Presentation | December 2015 |31
  • 32.
    Synergies FY15 – $322million realized FY16 – expecting more than $500 million FY17 – expecting more than $700 million Synergy Categories:  Prepared Foods Improvements  Procurement  Manufacturing & Logistics  Organizational & Fiduciary Tyson Foods, Inc. Investor Presentation | December 2015 |32
  • 33.
    Priorities for Cash Growing our businesses through organic growth and operational efficiency capital projects with attractive returns  Acquiring businesses that support our strategic objectives  Returning cash to shareholders through share repurchases and dividends while maintaining plenty of liquidity and investment- grade credit ratings and strong incremental debt capacity “Capital allocation priorities are governed by a disciplined focus on driving long-term shareholder value.” – Dennis Leatherby, CFO Tyson Foods, Inc. Investor Presentation | December 2015 |33
  • 34.
    Debt Maturity Profile DebtMaturity Skyline – as of 10.3.15 Fiscal Year Maturities ($ in millions) Tyson Foods, Inc. Investor Presentation | December 2015 |34 • Term loans are pre-payable at par. • Excludes $140MM Tangible Equity Units amortizing note, $18MM TFI senior note due 2028, and $59MM other miscellaneous debt (e.g. capital leases, foreign debt, and discount on senior notes). • $1.25 billion revolving credit facility matures FY19; outstanding balance as of 10-3-15 was $0. 0 250 500 750 1,000 1,250 1,500 1,750 '16 '17 '18 '19 '20 '21 '22 '23 '24 '33 '34 '44 TFI Bonds Hillshire Bonds Term Loans Pre-Payable Pre-Payable
  • 35.
    Why TSN? Consistent growth Higher,more stable earnings over time Advantaged brands in advantaged categories Innovation and insights Synergies Depth and breadth of portfolio to reach consumers at all day parts, all meal occasions, at home and away from home Built for Growth Tyson Foods, Inc. Investor Presentation | December 2015 |35
  • 36.
  • 37.
    Adjusted EPS Reconciliation TysonFoods, Inc. Investor Presentation | December 2015 |37 Unaudited EPS EPS EPS EPS EPS Reported net income per share attributable to Tyson 2.95$ 2.37$ 2.31$ 1.68$ 1.98$ Less: Recognition of previously unrecognized tax benefit (0.06) (0.15) - - - Insurance proceeds (net of costs) related to a legacy Hillshire Brands plant fire (0.02) - - - - Gain on sale of equity securities (0.03) - - - - Gain on sale of Mexico operation (0.24) - - - - Impact of additional week (0.06) - - - - Gain from currency translation adjustment - - (0.05) - - Gain on sale of equity method investment - - - - (0.03) Reversal of reserves for foreign uncertain tax positions - - - - (0.05) Add: China Impairment 0.41 - - - - Merger and integration costs 0.09 - - - - Prepared Foods network optimization charges 0.09 - - - - Dension plant closure 0.02 - - - - Loss related to early extinguishment of debt - - - 0.29 - Brazil impairment/Mexico undistributed earnings tax - 0.16 - - - Hillshire Brands acquisition, integration and costs associated with our Prepared Foods improvement plan - 0.37 - - - Hillshire Brands post-closing results, purchase price accounting and costs related to a legacy Hillshire Brands plant fire - 0.07 - - - Hillshire Brands acquisition financing incremental interest costs and share dilution - 0.12 - - - Adjusted net income per share attributable to Tyson 3.15$ 2.94$ 2.26$ 1.97$ 1.90$ 12 Months Ended October 3, 2015 September 27, 2014 September 28, 2013 September 29, 2012 October 1, 2011 Adjusted net income from continuing operations per share attributable to Tyson (adjusted EPS) is presented as a supplementary financial measurement in the evaluation of our business. We believe the presentation of adjusted EPS helps investors assess our financial performance from period to period and enhance understanding of our financial performance; however, adjusted EPS may not be comparable to those of other companies in our industry, which limits the usefulness as comparative measures. Adjusted EPS is not a measure required by or calculated in accordance with GAAP and should not be considered as a substitute for any measure of financial performance reported in accordance with GAAP. Investors should rely primarily on our GAAP results and use non-GAAP financial measures only supplementally in making investment decisions.
  • 38.
    EBITDA Reconciliations Tyson Foods,Inc. Investor Presentation | December 2015 |38 $ In millions Unaudited (a) Includes income tax expense of discontinued operation. (b) Excludes the amortization of debt discount expense of $10 million, $10 million, $28 million, $39 million and $44 million for fiscal 2015, 2014, 2013, 2012 and 2011, respectively, as it is included in Interest expense. EBITDA represents net income, net of interest, income tax and depreciation and amortization. We believe the presentation of this financial measure helps investors to assess our operating performance from period to period, including our ability to generate earnings sufficient to service our debt, and enhances understanding of our financial performance and highlights operational trends. This measure is widely used by investors and rating agencies in the valuation, comparison, rating and investment recommendations of companies; however, the measurement of EBITDA may not be comparable to those of other companies, which limits their usefulness as comparative measures. EBITDA is not a measure required by or calculated in accordance with generally accepted accounting principles (GAAP) and should not be considered as a substitute for net income or any other measure of financial performance reported in accordance with GAAP or as a measure of operating cash flow or liquidity. EBITDA is a useful tool for assessing, but is not a reliable indicator of, our ability to generate cash to service our debt obligations because certain of the items added to net income to determine EBITDA involve outlays of cash. As a result, actual cash available to service our debt obligations will be different from EBITDA. Investors should rely primarily on our GAAP results and use non-GAAP financial measures only supplementally in making investment decisions. 2015 2014 2013 2012 2011 Net income 1,224$ 856$ 778$ 576$ 733$ Less: Interest income (9) (7) (7) (12) (11) Add: Interest expense 293 132 145 356 242 Add: Income tax expense (a) 697 396 411 351 341 Add: Depreciation 609 494 474 443 433 Add: Amortization (b) 92 26 17 17 29 EBITDA 2,906$ 1,897$ 1,818$ 1,731$ 1,767$ 12 Months Ended
  • 39.
    Adjusted Sales, AdjustedOperating Income (Loss), Adjusted Operating Margin Reconciliations Tyson Foods, Inc. Investor Presentation | December 2015 |39 $ In millions Unaudited (a) The estimated impact of the additional week in the 12 months of fiscal 2015 was calculated by dividing unadjusted sales for the fourth quarter of fiscal 2015 by 14 weeks. (b) Impact of additional week was calculated by using the fourth quarter of fiscal 2015 adjusted operating income (prior to the additional week impact) divided by 14 weeks. Chicken Beef Pork Prepared Foods Other Intersegment Sales Total Reported sales 11,390$ 17,236$ 5,262$ 7,822$ 879$ (1,216)$ 41,373$ Less: Estimated impact of additional week (a) (216) (315) (93) (143) (8) 25 (750) Adjusted sales 11,174$ 16,921$ 5,169$ 7,679$ 871$ (1,191)$ 40,623$ Reported operating income (loss) 1,366$ (66)$ 380$ 588$ (99)$ -$ 2,169$ Add: China impairment - - - - 169 - 169 Add: Merger and integration costs - - - 10 47 - 57 Add: Prepared Foods network optimization charges - - - 59 - - 59 Add: Denison plant closure - 12 - - - - 12 Less: Insurance proceeds (net of costs) related to a legacy Hillshire Brands plant fire - - - (8) - - (8) Less: Gain on sale of the Mexico operation - - - - (161) - (161) Adjusted operating income prior to adjustment for additional week 1,366 (54) 380 649 (44) - 2,297 Less: Estimated impact of additional week (b) (26) 1 (7) (13) 1 - (44) Adjusted operating income (loss) 1,340$ (53)$ 373$ 636$ (43)$ -$ 2,253$ Adjusted operating margin % 12.0% -0.3% 7.2% 8.3% n/a n/a 5.5% (for the 12 months ended October 3, 2015) Adjusted Sales, Adjusted Operating Income (Loss) and Adjusted Operating Margin Adjusted sales, adjusted operating income and adjusted operating margin are presented as supplementary financial measurements in the evaluation of our business. We believe the presentation of adjusted sales, adjusted operating income and adjusted operating margin helps investors assess our financial performance from period to period and enhances understanding of our financial performance; however, adjusted sales, adjusted operating income and adjusted operating margin may not be comparable to those of other companies in our industry, which limits the usefulness as comparative measures. Adjusted sales, adjusted operating income and adjusted operating margin are not measures required by or calculated in accordance with GAAP and should not be considered as substitutes for any measures of financial performance reported in accordance with GAAP. Investors should rely primarily on our GAAP results and use non-GAAP financial measures only supplementally in making investment decisions.