![Conclusion
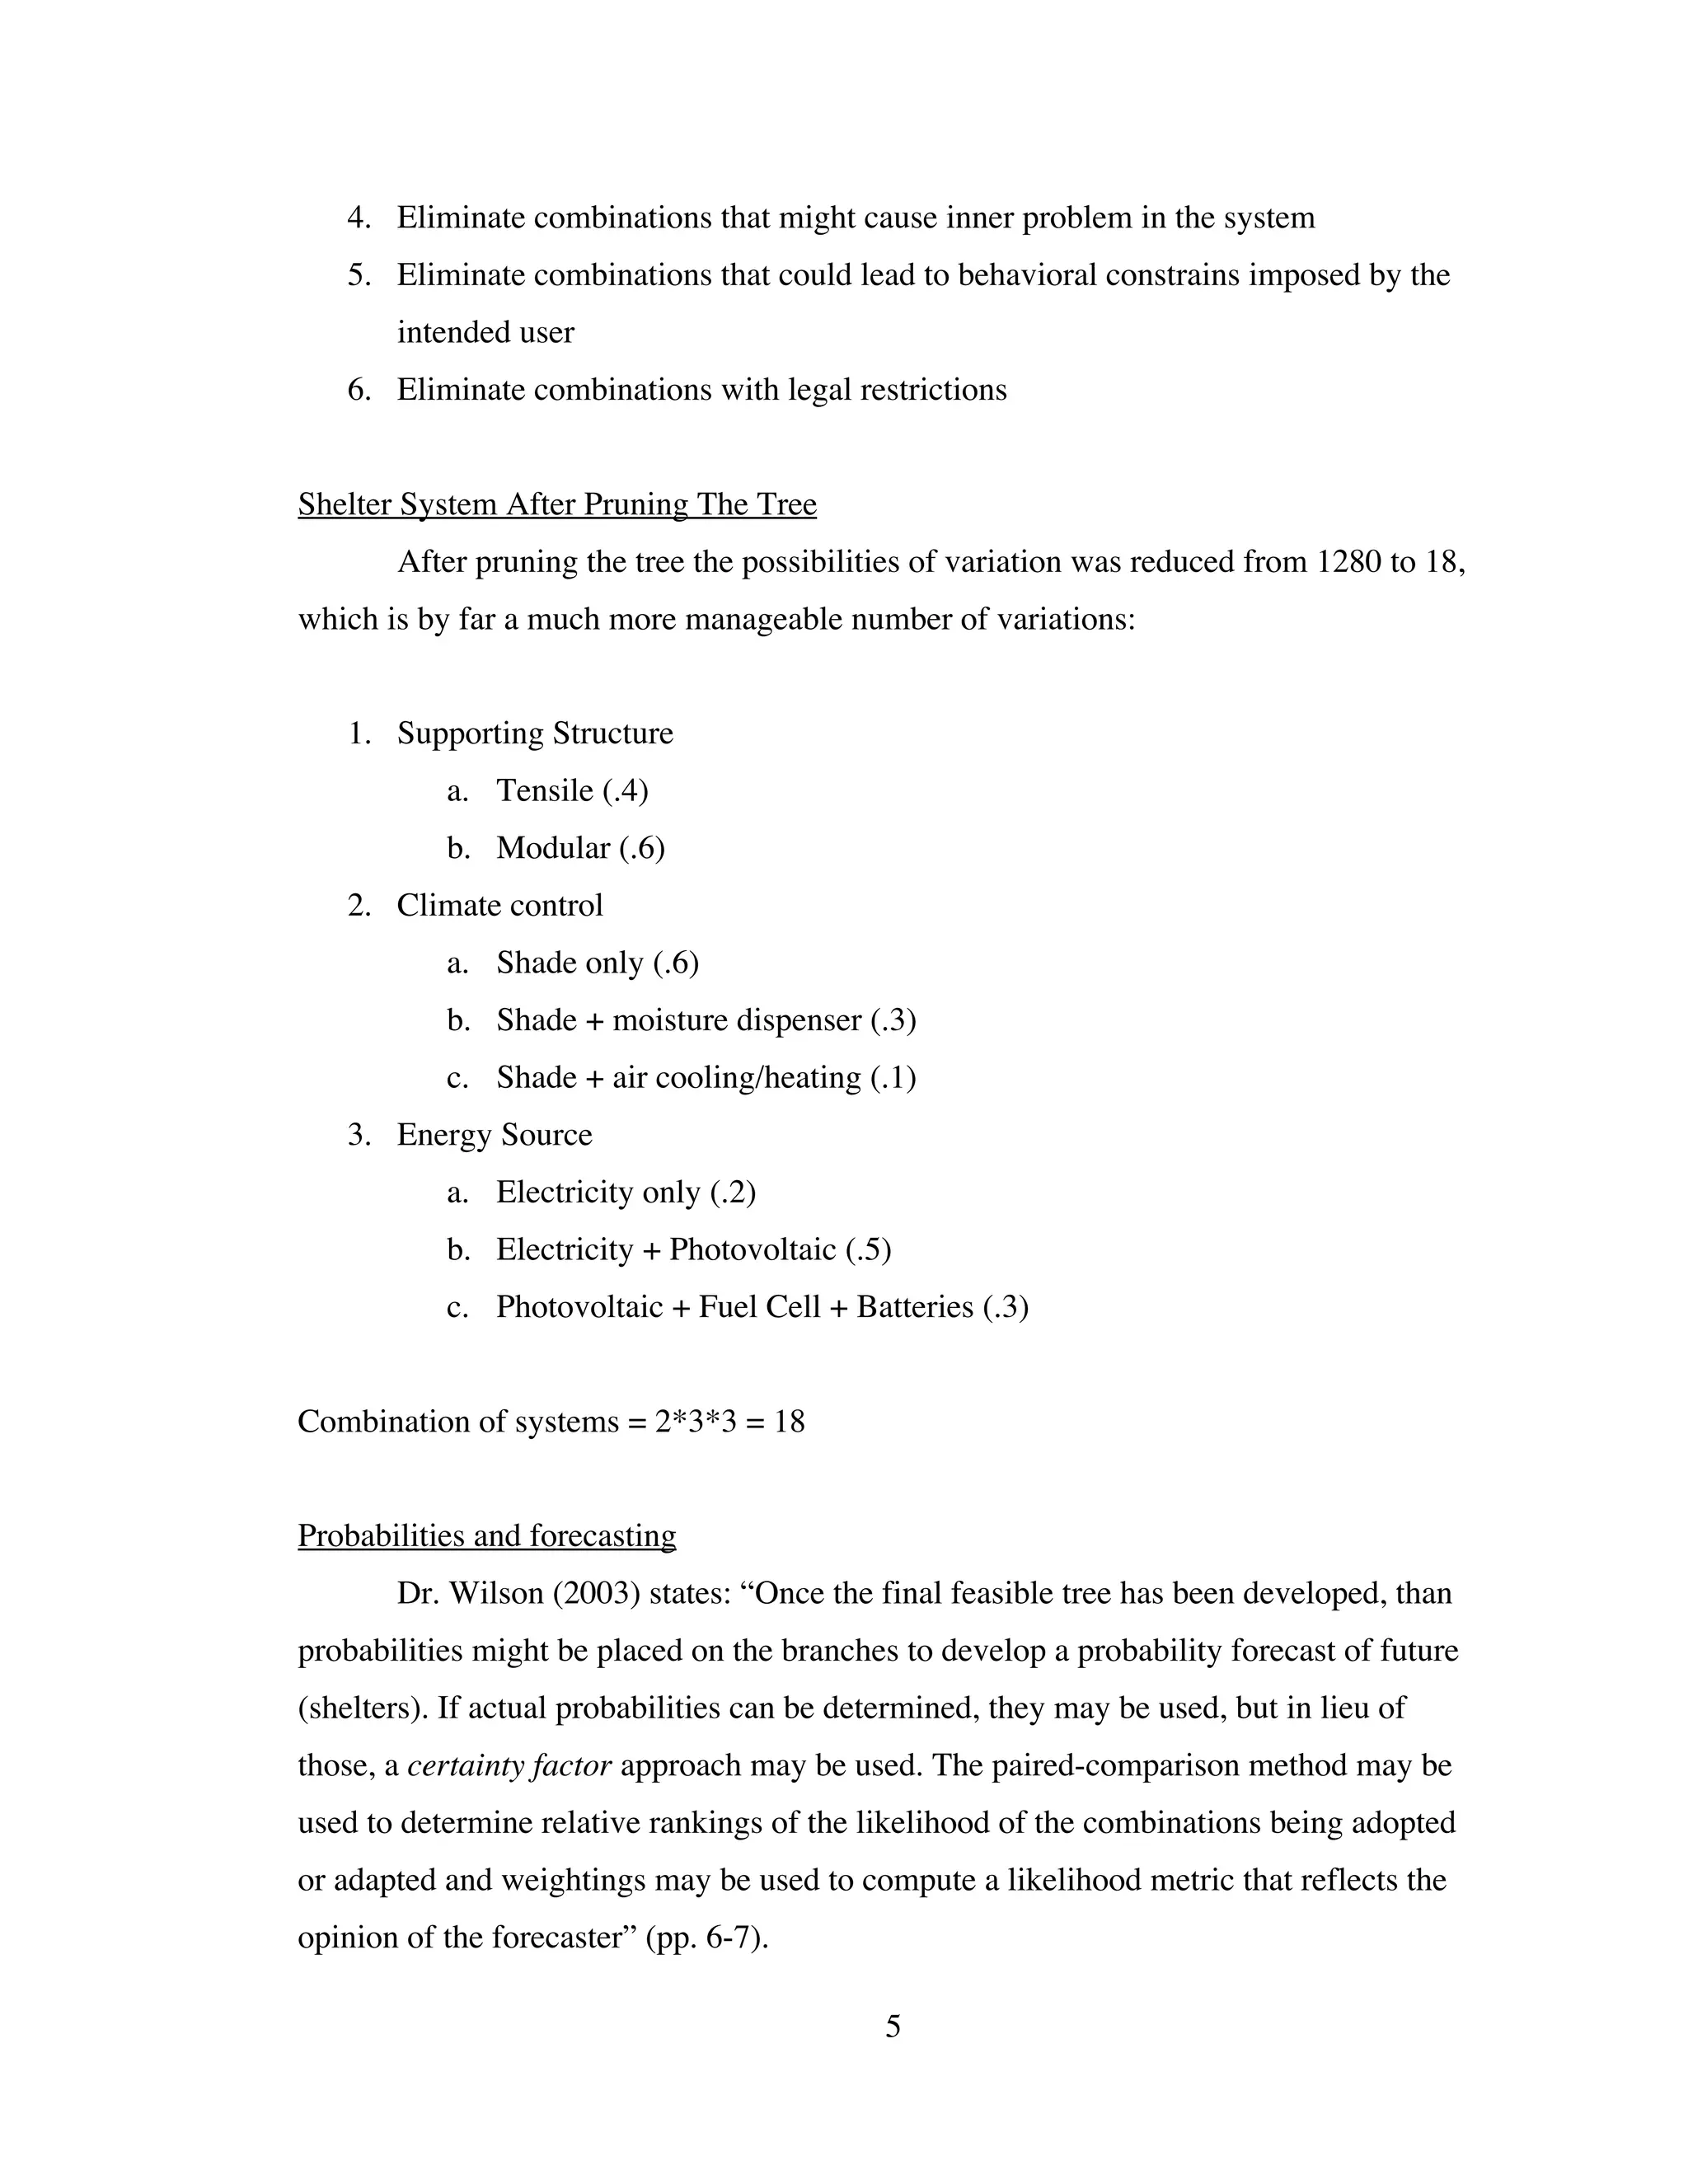
The shelter combinations, for cities located in desert regions, in descending order of
likelihood are:
• Modular supporting structure, shade+moist, electricity+PV (.4356)
• Modular supporting structure, shade+moist, PV+fuel cells+batteries (.2178)
• Modular supporting structure, shade only, electricity+PV (.2178)
• Modular supporting structure, shade only, PV+fuel cells+PV (.1089)
References
JC Decaux [Online] www.jcdecaux.com/anglais/metiers/mobilierurbain/focus/index.htm
Wilson D. (2003). Generating Functional Variations of the Bicycle. College of
Technology and Applied Sciences. Arizona State University.
8](https://image.slidesharecdn.com/forecasting4-111215070543-phpapp02/75/Generating-Multiple-Variations-of-the-Shelter-8-2048.jpg)

The document describes a methodology for generating functional variations of bus stop shelters. It identifies 5 major systems of shelters: roof, supporting structure, climate control, energy source, and graphic communication. It then decomposes each system and generates potential variations. This results in 1280 total possible combinations. The combinations are then "pruned" to eliminate impossible, harmful, impractical, or constrained options. This reduces the possibilities to 18 manageable variations. A likelihood metric is then applied to the variations to probabilistically forecast the most likely future shelter systems.


![Vibe Coding vs. Spec-Driven Development [Free Meetup]](https://cdn.slidesharecdn.com/ss_thumbnails/vibecodingvsspecdrivendevelopment-251209105622-43f455e7-thumbnail.jpg?width=640&height=640&fit=bounds)


