SlideShare a Scribd company logo
1 of 8
Download to read offline
Eleventh International IBPSA Conference
                                                                                                 Glasgow, Scotland
                                                                                                   July 27-30, 2009


  CITYSIM: COMPREHENSIVE MICRO-SIMULATION OF RESOURCE FLOWS
                FOR SUSTAINABLE URBAN PLANNING

   Darren Robinson1, Haldi, F.1, Kämpf, J.1, Leroux, P.1, Perez, D.1, Rasheed, A.1, Wilke, U1
1
  Solar Energy and Building Physics Laboratory (LESO-PB), Ecole Polytechnique Fédérale de
                     Lausanne (EPFL), CH-1015 Lausanne, Switzerland


                                                            - Definition of site location and associated climate
ABSTRACT                                                      data.
In this paper we describe new software “CitySim”            - Choice and adjustment of default datasets for the
that has been conceived to support the more                   types and age categories of buildings to be studied.
sustainable planning of urban settlements. This first
                                                            - Definition of 3D form of buildings; definition of
version focuses on simulating buildings’ energy
                                                              energy supply and storage systems to be modelled;
flows, but work is also under way to model energy
                                                              refinement of building and systems attributes.
embodied in materials as well as the flows of water
and waste and inter-relationships between these             - Parsing of data in XML format from the GUI to the
flows; likewise their dependence on the urban                 C++ solver for simulation of hourly resource
climate. We discuss this as well as progress that has         flows; analysis of results streamed back to the
been made to optimise urban resource flows using              GUI.
evolutionary algorithms. But this is only part of the       The scale of analysis may vary from a
picture. It is also important to take into consideration    neighbourhood of just a few buildings, though a
the transportation of goods and people between              district of several hundred to an entire city of tens of
buildings. To this end we also discuss work that is         thousand. But in each case the core modelling
underway to couple CitySim with a micro-simulation          capability and the data needs of these models is
model of urban transportation: MATSim.                      similar. In the following we describe this modelling
                                                            capability and how this is being extended to facilitate
INTRODUCTION                                                thoroughly comprehensive simulations of urban
It is estimated that over half of the global population     resource flows and how these might be optimised.
is now living in urban settlements (UN, 2004), in
which three quarters of global resources are                CITYSIM: CORE MODELS
consumed (Girardet, 1999). Energy derived from              For the purposes of urban scale simulation, it is
fossil fuels is key amongst these resources, so that        important to achieve a good compromise between
urban settlements are responsible for the majority of       modelling accuracy, computational overheads and
greenhouse gas emissions. It is thus important that         data availability. In all cases these have been the
existing urban settlements are adapted and that             criteria applied in the selection of an appropriate
proposed settlements are designed to minimise their         modelling methodology.
net resource consumption. Software for simulating           Thermal Model
and optimising urban resource flows will play an
essential role in this process. In this paper we            From the above criteria it was decided to develop a
describe progress that is being made in one such            model based on analogy with an electrical circuit;
initiative: the development of CitySim. We also             more specifically based on a resistor-capacitor
describe work that is underway to add further               network. In this case a conducting wall can be
functionality to CitySim and to couple CitySim with         represented by one or more temperature nodes
a microscopic transport simulation model MATSim             (Lefebvre, 1997). The heat flow between a wall and
to resolve for all key urban resource flows.                the outside air can be represented by an electric
                                                            current through a resistor linking the two
Achieving this would provide an invaluable platform         corresponding nodes and the wall’s inertia can be
for the testing of planning interventions to improve        represented by a capacitance linked at that node.
urban sustainability.
                                                            In our model (Kämpf and Robinson, 2007), which is
CITYSIM STRUCTURE                                           a refinement of that due to Nielsen (2005), an
In common with its predecessor SUNtool (Robinson            external air temperature node Text is connected with
et al, 2007) the use of CitySim’s Java-based GUI to         an outside surface temperature node Tos via an
simulate and optimise building-related resource flows       external film conductance Ke, which varies according
proceeds according to four key steps:                       to wind speed and direction (Figure 1). Tos, which
                                                            also experiences heat fluxes due to shortwave and


                                                      - 1083 -
longwave exchange, is connected to a wall node Tw                           Where for the ith zone C1 and C2 are internal (air and
of capacitance Cw via a conductance defined by the                          the wall separating zones i and j) and wall (external
external part of the wall. In fact this node resembles a                    and separating) capacitances. D, E, F and G
mirror plane, so that we have similar connections to                        correspond to combined conductances for external
an internal air node Ta of capacitance Ci via an                            and separating walls.
internal surface node Tis. Tis may also experience                          Predictions from this simplified model compare well
shortwave flux due to transmitted solar radiation and                       with those of ESP-r (Clarke, 2001) for a range of
a longwave flux due to radiant heat gains from                              monozone and multizone scenarios.
internal sources (people and appliances) and Ta may
                                                                            Radiation models
experience convective gains due to absorbed
shortwave radiation, internal casual gains and heating                      In common with CitySim’s predecessor “SUNtool”,
/ cooling systems. Finally, our internal air node may                       the Simplified Radiosity Algorithm (SRA) of
be connected with our external air temperature node                         Robinson and Stone (2004) is used to solve for the
via a variable resistance due to infiltration and                           shortwave irradiance incident on the surfaces
ventilation.                                                                defining our urban scene. For some set of p sky
                                                                            patches, each of which subtends a solid angle Φ (Sr)
                                                                            and has radiance R (Wm-2Sr-1) then, given the mean
                                                                            angle of incidence ξ (radians) between the patch and
                                                                            our receiving plane of slope β together with the
                                                                            proportion of the patch that can be seen σ (0 ≤ σ ≤ 1),
Figure1: Monozone form of the CitySim thermal                               the direct sky irradiance (Wm-2):
model.
                                                                             I dβ = ∑i =1 (RΦσ cos ξ )i
                                                                                      p
                                                                                                                             …(3)
For a whole building with many subspaces, the air
nodes of each zone are linked via the separating wall                       For this the well known discretisation scheme due to
conductance. Interzonal airflow can also be handled                         Tregenza (1993) is used to divide the sky vault into
through this conductance. To account for the                                145 patches of similar solid angle and the Perez all
corresponding inertia the capacitance of the                                weather model (Perez, 1993) is used to calculate the
separating wall is subdivided and allocated to the                          radiance at the centroid of each of these patches. The
neighbouring zone’s capacitance (Figure 2).                                 direct beam irradiance I bβ is calculated from the
                                                                            beam normal irradiance Ibn which is incident at an
                                                                            angle ξ to our surface of which some fraction ψ is
                                                                            visible from the sun, so that:
                                                                            I bβ = I bnψ cos ξ                          …(4)
                                                                            Now the direct sky and beam irradiance contributes
                                                                            to a given surface’s radiance R which in turn
                                                                            influences the irradiance incident at other surfaces
                                                                            visible to it, so increasing their radiance and vice
                                                                            versa. To solve for this a similar equation to that used
                                                                            for the sky contribution gives the reflected diffuse
                                                                            irradiance. In this case two discretised vaults are
                                                                            used, one for above and one for below the horizontal
                                                                            plane, so that:
Figure 2: Interzonal connection between zones
represented by the two-node thermal model
                                                                                       2p
                                                                                            (
                                                                             I ρβ = ∑i =1 R * Φω cos ξ    )
                                                                                                          i
                                                                                                                             …(5)
In general, an n-node model may be represented by                           where ω is the proportion of the patch which is
the following differential equation:                                        obstructed by urban (reflecting) surfaces and R* is
     r                 r        r
 C ⋅ T ′(t ) = A(t ) ⋅ T (t ) + u (t )          …(1)                        the radiance of the surface which dominates the
             r                                                              obstruction to this patch (in other words, that which
Where T (t ) represents the temperature vector at the                       contributes the most to ω). As noted earlier, R*
               r
n-nodes T ′(t ) denotes its derivative with respect to
                                                                            depends on reflected diffuse irradiance as well as on
                 r                                                          the direct sky and beam irradiances. For this a set of
time and u (t ) represents the source terms of each                         simultaneous equations relating the beam and diffuse
node. C is the positive diagonal thermal capacity                           sky components to each surface’s irradiance, which
matrix and A(t)is the symmetric heat transfer matrix.                       itself effects the reflected irradiance incident at other
In the particular case of our two-node multi-zone                           surfaces, may be formulated as a matrix and solved
model eq(1) can be expressed as follows:                                    either iteratively or by matrix inversion (Robinson
                r                  r            r                           and Stone, 2004).
⎛ C1    0 ⎞ ⎛ Ta′ (t ) ⎞ ⎛ D E ⎞ ⎛ Ta′ (t ) ⎞ ⎛ u a (t ) ⎞
                                                  ′          ...(2)
⎜          ⎟⋅⎜ r       ⎟=⎜     ⎟⋅⎜ r        ⎟+⎜r         ⎟
⎜0
⎝      C 2 ⎟ ⎜ Tw (t )⎟ ⎜ F G ⎟ ⎜ Tw (t )⎟ ⎜ u w (t )⎟
           ⎠ ⎝    ′ ⎠ ⎝        ⎠ ⎝   ′ ⎠ ⎝ ′ ⎠                              The principle complication in the above algorithm
                                                                            lies in determining the necessary view factors. For


                                                                      - 1084 -
obstruction view factors, views encapsulating the                     changing state, so that the transition absent to present
hemisphere are rendered from each surface centroid,                   is found from:
with every surface having a unique colour. Each                                     μ −1
pixel is then translated into angular coordinates to                   T01 (t ) =        ⋅ P(t ) + P(t + 1)             …(7)
                                                                                    μ +1
identify the corresponding patch as well as the angle
of incidence. For sky view factors then, Φ σ cos ξ is                 And that of present to present from:
treated as a single quantity obtained by numerical                             1 − P(t )         P(t + 1) 1 − P(t )
                                                                       T11 =             ⋅ T01 +         =          ⋅
integration of cos ξ ⋅ d Φ across each sky patch.                                P(t )            P(t )     P(t )       …(8)
Likewise for Φ ω cos ξ , for which the dominant                        ⎡ μ −1                    ⎤ P(t + 1)
                                                                       ⎢ μ + 1 ⋅ P(t ) + P(t + 1)⎥ + P(t )
occluding surface is identified as that which provides                 ⎣                         ⎦
the greatest contribution. A similar process is                       The remaining transitions are simply: T10 = 1 − T11 and
repeated for solar visibility fractions for each surface,
for which a constant size scene is rendered from the                  T00 = 1 − T01 . In addition to this we also need to
sun position.                                                         consider long absences, for example due to illnesses
In addition to using the above view information to                    or vacations. For this we use a daily profile of the
calculate incident shortwave irradiance, this may also                probability of starting a long absence and a further
be used to calculate longwave irradiance; given the                   profile for the cumulative probability of the duration
corresponding surface and sky temperatures (see                       of this absence. This takes precedence over the short
Robinson and Stone 2005). Eq (3-5) may also be                        time step transitions in presence, described above.
solved using luminance / illuminance as an input to                   For further details, we refer the reader to Page et al,
model the external luminous environment. Additional                   (2007a).
renderings may be then computed to determine the                      Although this occupancy model has been integrated
view information necessary to calculate the direct                    with CitySim, it is currently disabled. Rather, and as
and reflected contributions to internal illuminance (at               an intermediate step, use is currently made of
known points) as well as the incoming luminous flux                   deterministic rules / profiles describing occupants’
for internal reflection calculations (Robinson and                    presence and behaviour. In the near future however,
Stone, 2005; 2006).                                                   the possibility will be provided to switch between
Behavioural models                                                    deterministic representations and stochastic models.
                                                                      For this we will also use the models of: Haldi and
One of the key sources of uncertainty in building /                   Robinson (2009a, b) for window openings and the
urban simulation relates to occupants’ behaviour,                     corresponding ventilation exchanges; Haldi and
which is inherently stochastic in nature. Key types of                Robinson (2009c) for interactions with blinds and the
behaviour and their main impacts on urban energy                      impacts on solar radiation and daylight transmission;
flows are as follows:                                                 Page et al (2007b) for electrical appliances use and
Presence: metabolic heat gains and pollutants.                        their associated power consumption and heat gain
Windows: infiltration rates.                                          production. In the first instance the simplified model
Blinds: illuminance and transmitted irradiance.                       of Page (2007) will be used for solid waste
                                                                      production.
Lights: heat gains and electrical power demand.
                                                                      For interactions with lights we will initially use the
Electrical appliances: heat gains and electrical power                same models as those integrated with Lightswitch-
demand.                                                               2002 (Reinhart et al, 2004). In particular, the
Waste: production of combustible and recyclable                       probability of switching on lights at arrival as a
solids.                                                               function of minimum internal workplane illuminance
The central behavioural characteristic relates to                     (Ei,min) will be predicted by the expression due to
occupants’ presence, which of course determines                       Hunt (1979). Switching on lights at intermediate
whether they are available to exercise any other form                 times is also predicted as a function of Ei,min, but by
of influence on resource flows. Based on the                          the expression of Reinhart and Voss (2003) whereas
hypotheses that all occupants act independently and                   switching off at departure will be modelled as a
that their actions at time t+1 depend only upon the                   function of expected duration of absence (Pigg et al,
immediate past (t), we model transitions in                           1996). Note that interactions with blinds will be
occupants’ presence (present to absent (T10) or                       resolved before those with lights.
present (T11) and vice versa) based on the Markov                     Plant and equipment models
condition that:                                                       This category of model includes both heating,
P (X t +1 = i X t = j , X t −1 = k ,..., X t − N = l )                ventilating and cooling (HVAC) systems and energy
                                                         …(6)
= P (X t +1 = i X t = j ) =: Tij (t )                                 conversion systems (ECS).
                                                                      The HVAC model is based on the psychrometry of
For this we take as input a profile of the probability                humid air, considering an ideal mixture of two
of presence at each time t and a mobility parameter μ                 perfect gases: air and vapour. It computes the
– the ratio of the probability of changing state to not               psychrometric state (temperature and moisture


                                                                - 1085 -
content and hence the enthalpy h) of the air at each
ith stage in its supply (e.g. outside, heat recovered,
cooled and de-humidified, re-heated, supply). Given
                                   &
the required mass flow rate m (which may be
defined by the energy to be delivered or the room
fresh air requirement) the total delivered sensible and
latent loads for all stages in the heating and/or
cooling of air q can then be calculated:
q = ∑i mi Δh i
       n
       &                                        …(9)
The family of ECS models comprise a range of
technologies that provide/store heat and/or electricity
to buildings. These include a thermal storage tank
model for hot/cold fluids, boilers, heat pumps,
cogeneration systems, combined cogeneration and
heat pump systems, solar thermal collectors,
photovoltaic cells and finally wind turbines. These
ECS models are in general based on performance
curve regression equations whereas a simplified
thermal model simulates the sensible / latent heat
storage (so that phase change materials are also
accounted for).
If the ECS models have insufficient capacity to
satisfy the HVAC demands then the supply state is            Figure 3: Conceptual structure of CitySim
adjusted and the predicted room thermal state is
corrected (using the thermal model).                         CITYSIM: EXAMPLE APPLICATION OF
Integration                                                  CORE MODELS
The conceptual structure of CitySim is presented in          We have applied CitySim’s core models to a group of
Figure 3 below. The GUI produces an XML file                 buildings in the district of Matthäus in Basel
which contains a geometric description of our urban          (Switzerland). For this, we used a 3D model provided
scene together with numerous attributes that relate to       by the city’s Cadastral Office, and completed the
each of the models influencing urban resource flows.         physical description of the buildings by means of the
This XML file also contains pointers to a climate file       national census data for the year 2000 and results
as well as to the appropriate entries in databases           from a recent visual field survey of the district.
relating to building constructions, occupatants’             Figure 4 shows a projected view of the group of
behaviour and plant and equipment characteristics as         buildings simulated, in which we have represented
well as the fuels combusted. This data is parsed to the      for one particular day and hour in the year the surface
CitySim solver, which creates instances of the               averaged irradiance at its centroid by coloured points.
objects describing our scene. Each of the models are         The colour map used represents the intensity in
then called in turn and are parsed the necessary data.       irradiance, from red to blue, calculated by the SRA
Shown in black are each of the functions that have           model.
been developed within CitySim and shown in grey
are those that are either under development or are
planned to be developed in the near future. These are
described in the remaining sections of this paper.


                                                             Figure 4: A projection of the group of buildings
                                                             simulated in Matthäus district, Basel, Switzerland.
                                                             Using the buildings’ construction date, renovation
                                                             status and with the help of renovation specialists
                                                             (EPIQR Rénovation), we attributed the physical
                                                             characteristics relating to the walls, roofs and


                                                       - 1086 -
windows. See Kämpf and Robinson (2009) for a                                                                                database would be of use for embodied energy
fuller description of this scene and the means for its                                                                      content). However, one way of maximising the re-use
attribution.                                                                                                                of this effort would be the use of an on-line open data
By way of example, figure 5 shows the averaged                                                                              respository – providing open access to users’ data.
internal building temperature and the ideal heating                                                                         Further resource flows
and cooling demands for a selected building in the                                                                          The appliance model which is currently under
group, throughout the year on an hourly basis. The                                                                          development for integration within CitySim has thus
temperature set-points were chosen to be 21°C for                                                                           far been calibrated exclusively to model electrical
heating and 26°C for cooling.                                                                                               appliances. It does not currently model water
                                                        Zone averaged internal temperature (celsius)
                                                                                                         80
                                                                                                                            consumption from appliances that consume
                                                                                Heating needs (kW)
                        25                                                      Cooling needs (kW)       70                 exclusively water or both water and electricity.
                                                                                                         60                 It is thus planned to develop a simplified model of
                        20
                                                                                                         50
                                                                                                                            water flows, including:
                                                                                                                            - The consumption of water in buildings,
Temperature (celsius)


                                                                                                         40
                                                                                                                               distinguishing the quality of water required to


                                                                                                               Power (kW)
                        15
                                                                                                         30
                                                                                                                               support the activity concerned as well as the
                                                                                                         20                    quality of output waste water.
                        10

                                                                                                         10                 - Evapotranspiration from vegetated surfaces and the
                                                                                                         0
                                                                                                                               associated consumption of water for irrigation.
                        5

                                                                                                         -10
                                                                                                                            - Harvesting and storage of rainwater and recycling
                                                                                                                               of consumed water.
                        0                                                                                -20
                             0   1000   2000   3000    4000       5000
                                                      Hour in the year
                                                                            6000       7000       8000
                                                                                                                            - Supply of water from recycled, harvested and
                                                                                                                               mains sources.
Figure 5: Internal volume-averaged temperature and
heating and cooling demands for one of a group of                                                                           Modelling of surface water drainage is currently
buildings.                                                                                                                  considered to be beyond the scope of CitySim.
                                                                                                                            As part of this water processing module the
CITYSIM: FURTHER MODULES                                                                                                    anaerobic digestion of human waste will also be
In parallel with the above work in developing the                                                                           modelled in a simplified way. Combustible biogas
core solver for CitySim, we have also been active in                                                                        and solid waste (predicted using the simplified solid
developing a range of complementary modelling                                                                               waste model mentioned under ‘core models’) will
capabilities to enhance CitySim’s scope. These as                                                                           then be available for input to the ECS models.
well as some planned models (on which work will                                                                             In the longer term, as we increase our scale of
start shortly) are described below, to give a flavour of                                                                    analysis as well as the diversity of building types that
what CitySim’s capabilities are expected to be in the                                                                       are modelled, it will be of special interest to model
near future.                                                                                                                possible synergetic exchanges of energy and matter
Further object attribution                                                                                                  between buildings or the activities accommodated
The energy flows during the operation of an urban                                                                           within them. In this way it will be possible to test
development are just part of the story. It is also of                                                                       hypotheses inspired by industrial ecology regarding
interest to consider the embodied energy content of                                                                         ways of minimising net urban resource use, through
materials, to facilitate life cycle energy analysis.                                                                        improved circularity in their flows.
Related to this is an issue of primordial importance to                                                                     Consider the industrial park on the outskirts of the
the urban designer and developer – that of cost (both                                                                       town of Kalundborg in Denmark for example.
capital and running). Realistically speaking, this                                                                          Amongst the numerous synergetic exchanges, the
typically outranks environmental performance as a                                                                           waste heat produced by the power station meets the
fitness function to optimise. Work is thus underway                                                                         space heating and hot water demands of the town’s
to add these additional attributes (cost and embodied                                                                       buildings and a fish-farm as well as the process heat
energy) to the properties of the objects that comprise                                                                      needs of a bioplant and an oil refinery. The bioplant
a CitySim urban scene. This is straightforward. Less                                                                        produces yeast for pig farmers as well as
straightforward is the compilation of databases that                                                                        fermentation sludge for local farmers. Gypsum from
are rich enough to describe the attributes of the most                                                                      the power station’s flue gas desulphurisation plant is
commonly used construction / servicing products for                                                                         a key raw material of a plasterboard
potentially any users’ location, including the costs of                                                                     manufacturer…and so on. The reduction in resource
their acquisition and the local labour involved in their                                                                    imports and exports are considerable. These
utilisation (construction labour). Likewise, the time-                                                                      principles are readily applicable to urban
varying local energy purchase and feed-in tariffs.                                                                          developments, which tend to accommodate rich sets
Clearly much of the onus here will need to be placed                                                                        of energy and matter flows.
upon the user (although the ETHZ EcoInvent


                                                                                                               - 1087 -
Since the processes involved may be represented in         not only the buildings from which it is composed but
an aggregate way (as is typical with mass flow             also the scales which are bigger than the city itself.
analysis), representing the potential exchanges need       This new modelling capability, which is described in
should not be difficult; provided of course that the       Rasheed et al (2009), may be run as a pre-process to
necessary data is available.                               modify the climatic inputs to CitySim.
Urban climate modelling                                    Evolutionary algorithms
Compared with rural settings, in the urban context         For a new urban development, even with a relatively
more shortwave radiation is absorbed, less longwave        limited number of variables (geometry, type of use,
radiation is emitted and the mean wind speed is            occupancy and constructional characteristics, plant
lower, so that the mean air temperature is higher.         and energy supply technologies), the number of
This urban heat island is exacerbated by                   permutations is very large. The probability of
anthropogenic heat sources and the relative lack of        identifying an optimal configuration of these
evapotranspiration due to vegetated surfaces. Due to       variables by manual trial and error or simple
inertial differences, urban and rural temperature          parametric studies is thus correspondingly small.
profiles also tend to be out of phase, so that whilst      Moreover the response function computed by
the mean urban temperature is higher, afternoon            CitySim may exhibit a non-linear, multi-modal and
temperatures may be lower, particularly in summer.         discontinuous behaviour. Therefore heuristic
These urban-rural temperature differences can have         methods such as Evolutionary Algorithms are needed
significant implications for predicted resource            to overcome possible local optima, keeping in mind
demands and so needs to be account for in our              that we can never be sure of finding the global
simulations.                                               optimum in a finite time frame.
Although the influencing mechanisms are reasonably         Following from a review of available evolutionary
well understood, predicting the urban climate is           algorithms (EAs), we have developed a hybrid of two
complicated by the scales involved: from buildings         algorithms (Covariance Matrix Adaptation –
within the urban canopy (the size of a few meters) to      Evolutionary Strategy [CMA-ES] and Hybrid
large topographical features such as nearby water          Differential Evolution [HDE]) which offers improved
bodies or mountains (the size of a few kilometres).        robustness over its individual counterparts for a
These scales cannot be satisfactorily resolved in a        larger range of optimisation problems (Kämpf and
computationally tractable way using a single model.        Robinson, 2009a,b).
Our solution to this problem has been to couple
                                                           After having applied this new algorithm to a range of
different models which each address different spatial
                                                           solar radiation optimisation problems, we have
scales.
                                                           recently coupled this with CitySim and deployed it to
Firstly, freely available results from a global (macro)    explore ways of optimising the energy performance
model are input to a meso-model at a slightly larger       of part of a district of the City of Basel in
scale than that of our city. This meso-model is then       Switzerland, called Matthäus (see Kämpf and
run as a pre-process to interpolate the macro-scale        Robinson, 2009c). Work will shortly start on the
results at progressively finer scales until the            integration of an interactive tool within CitySim with
boundary conditions surrounding our city are               which users will be able to select parameters to
resolved at a compatible scale. The meso-model may         optimise, together with the constrained range of
then be run in the normal way. In the rural context        values they may take and the criteria with which
this may simply involve associating topography and         overall fitness is to be judged.
average land use data with each cell, the former
                                                           Uncertainty analysis
affecting temperature as pressure changes with height
the     latter   affecting    temperature     due    to    Finally, it is likely that the uncertainty in some of the
evapo(transpir)ation from water bodies or vegetated        inputs to urban models, particularly in relation to the
surfaces. In the urban context however, it is              conceptual design of new developments, may have a
important to account for the energy and momentum           significant impact on performance predictions and
exchanges between our built surfaces and the               the conclusions reached from these predictions.
adjacent air, which implies some representation of         To be able to accommodate these uncertainties in
3D geometry. For this we use a new urban canopy            urban scale predictions, we intend to borrow
model in which the velocity, temperature and scalar        techniques developed for the simulation of individual
profiles are parameterised as functions of built           buildings (e.g. De Witt (2001) and Macdonald
densities, street orientation and the dimensions of        (2002)). A facility should then be provided within the
urban geometric typologies. These quantities are then      interface to define the uncertainties of the parameters
used to estimate the sources and sinks of the              to which predictions are found to be particularly
momentum and energy equations.                             sensitive, and to select these parameters for
Thus, a completely coupled macro, meso and urban           simulation purposes.
canopy model can be used to predict the temperature,
wind and pressure field in a city taking into account


                                                     - 1088 -
MULTI- AGENT TRANSPORT                                         ones are discarded and those that are retained are
SIMULATION (MATSIM)                                            used to create the next generation. This process
                                                               continues for a defined number of iterations until a
Resources in urban settlements are consumed                    daily plan of near optimal utility has been identified
principally by buildings and the activities                    for each agent. This corresponds to the way in which
accommodated with them and by the transport of                 humans learn from experience what is the most
goods and people to and between them. To account               efficient time to leave one destination for another and
for this transport related energy use, we use the              according to what route. For example we may choose
Multi-Agent Transport Simulation Toolkit MATSim-               to leave home rather early in the morning to arrive at
T (1990).                                                      work quickly and also leave earlier to avoid heavy
MATSim-T simulates the sub-hourly transport of                 afternoon traffic.
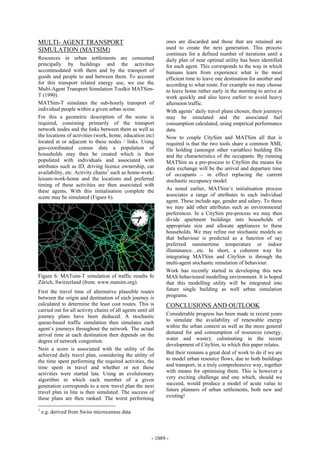
individual people within a given urban scene.                  With agents’ daily travel plans chosen, their journeys
For this a geometric description of the scene is               may be simulated and the associated fuel
required, consisting primarily of the transport                consumption calculated, using empirical performance
network nodes and the links between them as well as            data.
the locations of activities (work, home, education etc)        Now to couple CitySim and MATSim all that is
located at or adjacent to these nodes / links. Using           required is that the two tools share a common XML
geo-coordinated census data a population of                    file holding (amongst other variables) building IDs
households may then be created which is then                   and the characteristics of the occupants. By running
populated with individuals and associated with                 MATSim as a pre-process to CitySim the means for
attributes such as ID, driving licence ownership, car          data exchange will be the arrival and departure time
availability, etc. Activity chains1 such as home-work-         of occupants – in effect replacing the current
leisure-work-home and the locations and preferred              stochastic occupancy model.
timing of these activities are then associated with
these agents. With this initialisation complete the            As noted earlier, MATSim’s initialisation process
scene may be simulated (Figure 6).                             associates a range of attributes to each individual
                                                               agent. These include age, gender and salary. To these
                                                               we may add other attributes such as environmental
                                                               preferences. In a CitySim pre-process we may then
                                                               divide apartment buildings into households of
                                                               appropriate size and allocate appliances to these
                                                               households. We may refine our stochastic models so
                                                               that behaviour is predicted as a function of say
                                                               preferred summertime temperature or indoor
                                                               illuminance…etc. In short, a coherent way for
                                                               integrating MATSim and CitySim is through the
                                                               multi-agent stochastic simulation of behaviour.
                                                               Work has recently started in developing this new
Figure 6: MATsim-T simulation of traffic results fo            MAS behavioural modelling environment. It is hoped
Zürich, Switzerland (from: www.matsim.org).                    that this modelling utility will be integrated into
First the travel time of alternative plausible routes          future single building as well urban simulation
between the origin and destination of each journey is          programs.
calculated to determine the least cost routes. This is         CONCLUSIONS AND OUTLOOK
carried out for all activity chains of all agents until all
journey plans have been deduced. A stochastic                  Considerable progress has been made in recent years
queue-based traffic simulation then simulates each             to simulate the availability of renewable energy
agent’s journeys throughout the network. The actual            within the urban context as well as the more general
arrival time at each destination then depends on the           demand for and consumption of resources (energy,
degree of network congestion.                                  water and waste); culminating in the recent
                                                               development of CitySim, to which this paper relates.
Next a score is associated with the utility of the
achieved daily travel plan, considering the utility of         But their remains a great deal of work to do if we are
the time spent performing the required activities, the         to model urban resource flows, due to both buildings
time spent in travel and whether or not these                  and transport, in a truly comprehensive way, together
activities were started late. Using an evolutionary            with means for optimising them. This is however a
algorithm in which each member of a given                      very exciting challenge and one which, should we
generation corresponds to a new travel plan the next           succeed, would produce a model of acute value to
travel plan in line is then simulated. The success of          future planners of urban settlements, both new and
these plans are then ranked. The worst performing              existing!

1
    e.g. derived from Swiss microcensus data


                                                         - 1089 -
ACKNOWLEDGEMENT                                           Page, J. (2007), Simulating occupant presence and
                                                          behaviour in buildings, Unpublished PhD Thesis,
Financial support received for this work from the
                                                          EPFL.
European Commission as part of the CONCERTO II
Project HOLISTIC is gratefully acknowledged.              Page, J., Robinson, D., Morel, N., Scartezzini, J.-L.
                                                          (2007a), A generalised stochastic model for the
REFERENCES                                                prediction of occupant presence, Energy and
Clarke, J.A. (2001), Energy Simulation in Building        Buildings, 40(2) p83-98.
Design, Butterworth-Heinemann: Oxford.                    Page, J., Robinson, D., Morel, N., Scartezzini, J.-l.
de Wit, M.S. (2001), Uncertainty in prediction of         (2007b), Stochastic simulation of occupant presence
thermal comfort in buildings, PhD Thesis, Delft           and behaviour in buildings, Proc. Tenth Int. IBPSA
University of Technology, Delft.                          Conf: Building Simulation 2007, Beijing, China.
Girardet, H. (1999), Creating sustainable cities,         Perez, R., Seals, R., Michalsky, J. (1993), All-
Schumacher Briefing 2, Green Books.                       weather model for sky luminance distribution––
                                                          preliminary configuration and validation. Solar
Haldi, F. Robinson, D. (2009a), A comprehensive
                                                          Energy 50 (3), 235–243.
stochastic model of window opening behaviour,
Building and Environment, in press                        Pigg, S., Eilers, M., Reed, J. (1996), Behavioural
(doi:10.1016/j.buildenv.2009.03.025).                     aspects of lighting and occupancy sensors in privates
                                                          offices: a case study of a university office building.
Haldi, F. Robinson, D. (2009b), A comprehensive
                                                          In: Proc. ACEEE Summer Study on Energy
stochastic model of window usage: theory and
                                                          Efficiency in Buildings 8, pp. 8.161–8.171.
validation, ibid.
                                                          Rasheed, A. Robinson, D. (2009), Multiscale
Haldi and Robinson (2009c) , A comprehensive
                                                          modelling of the urban climate, ibid.
stochastic model of blind usage: theory and
validation, ibid.                                         Reinhart, C. F. (2004), Lightswitch-2002: a model
                                                          for manual and automated control of electric lighting
Hunt, D.R.G. (1979), The use of artificial lighting in
                                                          and blinds, Solar Energy, 77(1), p15–28.
relation to daylight levels and occupancy. Building
and Environment (14), 21–33.                              Reinhart, C.F. and Voss, K. (2003), Monitoring
                                                          manual control of electric lighting and blinds.
Kämpf, J., Robinson, D. (2007), A simplified thermal
                                                          Lighting Research & Technology 35(3), p243–260.
model to support analysis of urban resource flows,
Energy and Buildings 39(4), p445-453.                     Robinson, D., Stone, A. (2004), Solar radiation
                                                          modelling in the urban context, Solar Energy, (77)3,
Kämpf, J., Robinson, D. (2009a), A hybrid CMA-ES
                                                          p295-309.
and DE optimisation algorithm with application to
solar energy potential, Applied Soft Computing 2(9)       Robinson, D., Stone, A. (2005), A simplified
p738-745.                                                 radiosity algorithm for general urban radiation
                                                          exchange, Building Services Engineering Research
Kämpf, J., Robinson, D., Optimisation of building
                                                          and Technology, 26(4), p271-284.
form for solar energy utilisation using constrained
evolutionary algorithms, Energy and Buildings             Robinson, D., Stone, A. (2006), Internal illumination
(submitted)                                               prediction based on a simplified radiosity algorithm,
                                                          Solar Energy, 80(3), p260-267.
Kämpf, J., Robinson, D. (2009c) Optimisation of
urban energy demand using an evolutionary                 Robinson, D., Campbell, N., Gaiser, W., Kabel, K.,
algorithm, ibid.                                          Le-Mouele, A., Morel, N., Page, J., Stankovic, S.,
                                                          Stone, A. (2007), SUNtool – a new modelling
MATSim-T, 1990, www.matsim.org/
                                                          paradigm for simulating and optimising urban
Nielsen, T. R. (2005), Simple tool to evaluate energy     sustainability, Solar Energy, 81(9), p1196-1211
demand and indoor environment in the early stages
                                                          Tregenza, P., Sharples, S. (1993), Daylighting
of building design. Solar Energy 78 (1), pp. 73-83.
                                                          algorithms. ETSU S 1350-1993, UK.
Lefebvre, G., Bransier, J., Neveu, A. (1987),
                                                          United Nations (2004). Department of Economic and
Simulation du comportement thermique d’un local
                                                          Social Affairs / Population Division. World
par des methodes numeriques d’ordre reduit, Revue
                                                          Urbanization Prospects: The 2003 Revision. New
Generale de Thermique 26(302) 106–114.
                                                          York: United Nations, p.3.
Macdonald, I.A. (2002), Quantifying the Effects of
Uncertainty in Building Simulation. Ph.D. Thesis,
ESRU, University of Strathclyde.
Nielsen, T.R. (2005), Simple tool to evaluate energy
demand and indoor environment in the early stages
of building design, Solar Energy 78 (1), p73–83.


                                                    - 1090 -

More Related Content

What's hot

Radiation Q bounds for small electric dipoles over a conducting ground plane
Radiation Q bounds for small electric dipoles over a conducting ground planeRadiation Q bounds for small electric dipoles over a conducting ground plane
Radiation Q bounds for small electric dipoles over a conducting ground planeYong Heui Cho
 
Simple generation of orbital angular momentum modes with azimuthally deformed...
Simple generation of orbital angular momentum modes with azimuthally deformed...Simple generation of orbital angular momentum modes with azimuthally deformed...
Simple generation of orbital angular momentum modes with azimuthally deformed...Yong Heui Cho
 
Weak Lensing from GEMS
Weak Lensing from GEMSWeak Lensing from GEMS
Weak Lensing from GEMSwebhostingguy
 
Cloud vertical distribution in extratropical cyclones
Cloud vertical distribution in extratropical cyclonesCloud vertical distribution in extratropical cyclones
Cloud vertical distribution in extratropical cyclonesbillkov
 
Effects of Uncertainty in Cloud Microphysics on Passive Microwave Rainfall Me...
Effects of Uncertainty in Cloud Microphysics on Passive Microwave Rainfall Me...Effects of Uncertainty in Cloud Microphysics on Passive Microwave Rainfall Me...
Effects of Uncertainty in Cloud Microphysics on Passive Microwave Rainfall Me...grssieee
 
4_Presentation.DE+EnVA.20110727.ppt
4_Presentation.DE+EnVA.20110727.ppt4_Presentation.DE+EnVA.20110727.ppt
4_Presentation.DE+EnVA.20110727.pptgrssieee
 
Modelling of 3D gelogical structures
Modelling of 3D gelogical structuresModelling of 3D gelogical structures
Modelling of 3D gelogical structuresZawar Khan
 
Seismic data processing 14, stacking&migration2
Seismic data processing 14, stacking&migration2Seismic data processing 14, stacking&migration2
Seismic data processing 14, stacking&migration2Amin khalil
 
TH1.T04.2_MULTI-FREQUENCY MICROWAVE EMISSION OF THE EAST ANTARCTIC PLATEAU_IG...
TH1.T04.2_MULTI-FREQUENCY MICROWAVE EMISSION OF THE EAST ANTARCTIC PLATEAU_IG...TH1.T04.2_MULTI-FREQUENCY MICROWAVE EMISSION OF THE EAST ANTARCTIC PLATEAU_IG...
TH1.T04.2_MULTI-FREQUENCY MICROWAVE EMISSION OF THE EAST ANTARCTIC PLATEAU_IG...grssieee
 

What's hot (11)

Radiation Q bounds for small electric dipoles over a conducting ground plane
Radiation Q bounds for small electric dipoles over a conducting ground planeRadiation Q bounds for small electric dipoles over a conducting ground plane
Radiation Q bounds for small electric dipoles over a conducting ground plane
 
Simple generation of orbital angular momentum modes with azimuthally deformed...
Simple generation of orbital angular momentum modes with azimuthally deformed...Simple generation of orbital angular momentum modes with azimuthally deformed...
Simple generation of orbital angular momentum modes with azimuthally deformed...
 
Weak Lensing from GEMS
Weak Lensing from GEMSWeak Lensing from GEMS
Weak Lensing from GEMS
 
Cloud vertical distribution in extratropical cyclones
Cloud vertical distribution in extratropical cyclonesCloud vertical distribution in extratropical cyclones
Cloud vertical distribution in extratropical cyclones
 
1.1444077
1.14440771.1444077
1.1444077
 
int3.3
int3.3int3.3
int3.3
 
Effects of Uncertainty in Cloud Microphysics on Passive Microwave Rainfall Me...
Effects of Uncertainty in Cloud Microphysics on Passive Microwave Rainfall Me...Effects of Uncertainty in Cloud Microphysics on Passive Microwave Rainfall Me...
Effects of Uncertainty in Cloud Microphysics on Passive Microwave Rainfall Me...
 
4_Presentation.DE+EnVA.20110727.ppt
4_Presentation.DE+EnVA.20110727.ppt4_Presentation.DE+EnVA.20110727.ppt
4_Presentation.DE+EnVA.20110727.ppt
 
Modelling of 3D gelogical structures
Modelling of 3D gelogical structuresModelling of 3D gelogical structures
Modelling of 3D gelogical structures
 
Seismic data processing 14, stacking&migration2
Seismic data processing 14, stacking&migration2Seismic data processing 14, stacking&migration2
Seismic data processing 14, stacking&migration2
 
TH1.T04.2_MULTI-FREQUENCY MICROWAVE EMISSION OF THE EAST ANTARCTIC PLATEAU_IG...
TH1.T04.2_MULTI-FREQUENCY MICROWAVE EMISSION OF THE EAST ANTARCTIC PLATEAU_IG...TH1.T04.2_MULTI-FREQUENCY MICROWAVE EMISSION OF THE EAST ANTARCTIC PLATEAU_IG...
TH1.T04.2_MULTI-FREQUENCY MICROWAVE EMISSION OF THE EAST ANTARCTIC PLATEAU_IG...
 

Similar to Citysim

Cwe2010 paper 172
Cwe2010 paper 172Cwe2010 paper 172
Cwe2010 paper 172epfl
 
Narayan Shrestha [ACCURACY OF X-BAND LOCAL AREA WEATHER RADAR (LAWR) OF LEUVE...
Narayan Shrestha [ACCURACY OF X-BAND LOCAL AREA WEATHER RADAR (LAWR) OF LEUVE...Narayan Shrestha [ACCURACY OF X-BAND LOCAL AREA WEATHER RADAR (LAWR) OF LEUVE...
Narayan Shrestha [ACCURACY OF X-BAND LOCAL AREA WEATHER RADAR (LAWR) OF LEUVE...Narayan Shrestha
 
Seismic Modeling ASEG 082001 Andrew Long
Seismic Modeling ASEG 082001 Andrew LongSeismic Modeling ASEG 082001 Andrew Long
Seismic Modeling ASEG 082001 Andrew LongAndrew Long
 
Phd Thesis
Phd ThesisPhd Thesis
Phd Thesisepfl
 
ECEN+5264 TERM PAPER_Mithul Thanu
ECEN+5264 TERM PAPER_Mithul ThanuECEN+5264 TERM PAPER_Mithul Thanu
ECEN+5264 TERM PAPER_Mithul ThanuMithul Thanu
 
45 investigation paper id 0008 edit septian
45 investigation paper id 0008 edit septian45 investigation paper id 0008 edit septian
45 investigation paper id 0008 edit septianIAESIJEECS
 
MULTISCALE MODELLING OF URBAN CLIMATE
MULTISCALE MODELLING OF URBAN CLIMATE MULTISCALE MODELLING OF URBAN CLIMATE
MULTISCALE MODELLING OF URBAN CLIMATE epfl
 
Field Strength Predicting Outdoor Models
Field Strength Predicting Outdoor ModelsField Strength Predicting Outdoor Models
Field Strength Predicting Outdoor ModelsIRJET Journal
 
Numerical simulation of wind flow over complex terrain (yangon city)
Numerical simulation of wind flow over complex terrain (yangon city)Numerical simulation of wind flow over complex terrain (yangon city)
Numerical simulation of wind flow over complex terrain (yangon city)Zin Soul
 
Three modeling of soil erosion by water
Three modeling of soil erosion by waterThree modeling of soil erosion by water
Three modeling of soil erosion by waterIAEME Publication
 
CME2011 Presentation Schiretz & Kouzani
CME2011  Presentation Schiretz & KouzaniCME2011  Presentation Schiretz & Kouzani
CME2011 Presentation Schiretz & KouzaniHelmut Schiretz
 
James Fenwick - Engineering Design 4 IEEE Paper (RMIT)
James Fenwick - Engineering Design 4 IEEE Paper (RMIT)James Fenwick - Engineering Design 4 IEEE Paper (RMIT)
James Fenwick - Engineering Design 4 IEEE Paper (RMIT)James Fenwick
 
E03702038045
E03702038045E03702038045
E03702038045theijes
 
Testing the global grid of master events for waveform cross correlation with ...
Testing the global grid of master events for waveform cross correlation with ...Testing the global grid of master events for waveform cross correlation with ...
Testing the global grid of master events for waveform cross correlation with ...Ivan Kitov
 
Satellite Communication.ppt
Satellite Communication.pptSatellite Communication.ppt
Satellite Communication.pptDeepaksenthil4
 
Satellite communication 3
Satellite communication   3Satellite communication   3
Satellite communication 3sardarwaleed3
 
1907.04789_2.pdf
1907.04789_2.pdf1907.04789_2.pdf
1907.04789_2.pdfdtvt2006
 

Similar to Citysim (20)

Cwe2010 paper 172
Cwe2010 paper 172Cwe2010 paper 172
Cwe2010 paper 172
 
Narayan Shrestha [ACCURACY OF X-BAND LOCAL AREA WEATHER RADAR (LAWR) OF LEUVE...
Narayan Shrestha [ACCURACY OF X-BAND LOCAL AREA WEATHER RADAR (LAWR) OF LEUVE...Narayan Shrestha [ACCURACY OF X-BAND LOCAL AREA WEATHER RADAR (LAWR) OF LEUVE...
Narayan Shrestha [ACCURACY OF X-BAND LOCAL AREA WEATHER RADAR (LAWR) OF LEUVE...
 
Seismic Modeling ASEG 082001 Andrew Long
Seismic Modeling ASEG 082001 Andrew LongSeismic Modeling ASEG 082001 Andrew Long
Seismic Modeling ASEG 082001 Andrew Long
 
Phd Thesis
Phd ThesisPhd Thesis
Phd Thesis
 
ECEN+5264 TERM PAPER_Mithul Thanu
ECEN+5264 TERM PAPER_Mithul ThanuECEN+5264 TERM PAPER_Mithul Thanu
ECEN+5264 TERM PAPER_Mithul Thanu
 
Assessment of Different Shading Design Scenario on the Daylight Availability ...
Assessment of Different Shading Design Scenario on the Daylight Availability ...Assessment of Different Shading Design Scenario on the Daylight Availability ...
Assessment of Different Shading Design Scenario on the Daylight Availability ...
 
45 investigation paper id 0008 edit septian
45 investigation paper id 0008 edit septian45 investigation paper id 0008 edit septian
45 investigation paper id 0008 edit septian
 
MULTISCALE MODELLING OF URBAN CLIMATE
MULTISCALE MODELLING OF URBAN CLIMATE MULTISCALE MODELLING OF URBAN CLIMATE
MULTISCALE MODELLING OF URBAN CLIMATE
 
kim2015.pdf
kim2015.pdfkim2015.pdf
kim2015.pdf
 
Field Strength Predicting Outdoor Models
Field Strength Predicting Outdoor ModelsField Strength Predicting Outdoor Models
Field Strength Predicting Outdoor Models
 
Numerical simulation of wind flow over complex terrain (yangon city)
Numerical simulation of wind flow over complex terrain (yangon city)Numerical simulation of wind flow over complex terrain (yangon city)
Numerical simulation of wind flow over complex terrain (yangon city)
 
J26048056
J26048056J26048056
J26048056
 
Three modeling of soil erosion by water
Three modeling of soil erosion by waterThree modeling of soil erosion by water
Three modeling of soil erosion by water
 
CME2011 Presentation Schiretz & Kouzani
CME2011  Presentation Schiretz & KouzaniCME2011  Presentation Schiretz & Kouzani
CME2011 Presentation Schiretz & Kouzani
 
James Fenwick - Engineering Design 4 IEEE Paper (RMIT)
James Fenwick - Engineering Design 4 IEEE Paper (RMIT)James Fenwick - Engineering Design 4 IEEE Paper (RMIT)
James Fenwick - Engineering Design 4 IEEE Paper (RMIT)
 
E03702038045
E03702038045E03702038045
E03702038045
 
Testing the global grid of master events for waveform cross correlation with ...
Testing the global grid of master events for waveform cross correlation with ...Testing the global grid of master events for waveform cross correlation with ...
Testing the global grid of master events for waveform cross correlation with ...
 
Satellite Communication.ppt
Satellite Communication.pptSatellite Communication.ppt
Satellite Communication.ppt
 
Satellite communication 3
Satellite communication   3Satellite communication   3
Satellite communication 3
 
1907.04789_2.pdf
1907.04789_2.pdf1907.04789_2.pdf
1907.04789_2.pdf
 

Recently uploaded

Human Factors of XR: Using Human Factors to Design XR Systems
Human Factors of XR: Using Human Factors to Design XR SystemsHuman Factors of XR: Using Human Factors to Design XR Systems
Human Factors of XR: Using Human Factors to Design XR SystemsMark Billinghurst
 
Understanding the Laravel MVC Architecture
Understanding the Laravel MVC ArchitectureUnderstanding the Laravel MVC Architecture
Understanding the Laravel MVC ArchitecturePixlogix Infotech
 
Slack Application Development 101 Slides
Slack Application Development 101 SlidesSlack Application Development 101 Slides
Slack Application Development 101 Slidespraypatel2
 
Transcript: #StandardsGoals for 2024: What’s new for BISAC - Tech Forum 2024
Transcript: #StandardsGoals for 2024: What’s new for BISAC - Tech Forum 2024Transcript: #StandardsGoals for 2024: What’s new for BISAC - Tech Forum 2024
Transcript: #StandardsGoals for 2024: What’s new for BISAC - Tech Forum 2024BookNet Canada
 
SIEMENS: RAPUNZEL – A Tale About Knowledge Graph
SIEMENS: RAPUNZEL – A Tale About Knowledge GraphSIEMENS: RAPUNZEL – A Tale About Knowledge Graph
SIEMENS: RAPUNZEL – A Tale About Knowledge GraphNeo4j
 
Azure Monitor & Application Insight to monitor Infrastructure & Application
Azure Monitor & Application Insight to monitor Infrastructure & ApplicationAzure Monitor & Application Insight to monitor Infrastructure & Application
Azure Monitor & Application Insight to monitor Infrastructure & ApplicationAndikSusilo4
 
Tech-Forward - Achieving Business Readiness For Copilot in Microsoft 365
Tech-Forward - Achieving Business Readiness For Copilot in Microsoft 365Tech-Forward - Achieving Business Readiness For Copilot in Microsoft 365
Tech-Forward - Achieving Business Readiness For Copilot in Microsoft 3652toLead Limited
 
Breaking the Kubernetes Kill Chain: Host Path Mount
Breaking the Kubernetes Kill Chain: Host Path MountBreaking the Kubernetes Kill Chain: Host Path Mount
Breaking the Kubernetes Kill Chain: Host Path MountPuma Security, LLC
 
08448380779 Call Girls In Civil Lines Women Seeking Men
08448380779 Call Girls In Civil Lines Women Seeking Men08448380779 Call Girls In Civil Lines Women Seeking Men
08448380779 Call Girls In Civil Lines Women Seeking MenDelhi Call girls
 
Maximizing Board Effectiveness 2024 Webinar.pptx
Maximizing Board Effectiveness 2024 Webinar.pptxMaximizing Board Effectiveness 2024 Webinar.pptx
Maximizing Board Effectiveness 2024 Webinar.pptxOnBoard
 
My Hashitalk Indonesia April 2024 Presentation
My Hashitalk Indonesia April 2024 PresentationMy Hashitalk Indonesia April 2024 Presentation
My Hashitalk Indonesia April 2024 PresentationRidwan Fadjar
 
Presentation on how to chat with PDF using ChatGPT code interpreter
Presentation on how to chat with PDF using ChatGPT code interpreterPresentation on how to chat with PDF using ChatGPT code interpreter
Presentation on how to chat with PDF using ChatGPT code interpreternaman860154
 
Hyderabad Call Girls Khairatabad ✨ 7001305949 ✨ Cheap Price Your Budget
Hyderabad Call Girls Khairatabad ✨ 7001305949 ✨ Cheap Price Your BudgetHyderabad Call Girls Khairatabad ✨ 7001305949 ✨ Cheap Price Your Budget
Hyderabad Call Girls Khairatabad ✨ 7001305949 ✨ Cheap Price Your BudgetEnjoy Anytime
 
WhatsApp 9892124323 ✓Call Girls In Kalyan ( Mumbai ) secure service
WhatsApp 9892124323 ✓Call Girls In Kalyan ( Mumbai ) secure serviceWhatsApp 9892124323 ✓Call Girls In Kalyan ( Mumbai ) secure service
WhatsApp 9892124323 ✓Call Girls In Kalyan ( Mumbai ) secure servicePooja Nehwal
 
SQL Database Design For Developers at php[tek] 2024
SQL Database Design For Developers at php[tek] 2024SQL Database Design For Developers at php[tek] 2024
SQL Database Design For Developers at php[tek] 2024Scott Keck-Warren
 
Neo4j - How KGs are shaping the future of Generative AI at AWS Summit London ...
Neo4j - How KGs are shaping the future of Generative AI at AWS Summit London ...Neo4j - How KGs are shaping the future of Generative AI at AWS Summit London ...
Neo4j - How KGs are shaping the future of Generative AI at AWS Summit London ...Neo4j
 
Beyond Boundaries: Leveraging No-Code Solutions for Industry Innovation
Beyond Boundaries: Leveraging No-Code Solutions for Industry InnovationBeyond Boundaries: Leveraging No-Code Solutions for Industry Innovation
Beyond Boundaries: Leveraging No-Code Solutions for Industry InnovationSafe Software
 
Unblocking The Main Thread Solving ANRs and Frozen Frames
Unblocking The Main Thread Solving ANRs and Frozen FramesUnblocking The Main Thread Solving ANRs and Frozen Frames
Unblocking The Main Thread Solving ANRs and Frozen FramesSinan KOZAK
 

Recently uploaded (20)

Human Factors of XR: Using Human Factors to Design XR Systems
Human Factors of XR: Using Human Factors to Design XR SystemsHuman Factors of XR: Using Human Factors to Design XR Systems
Human Factors of XR: Using Human Factors to Design XR Systems
 
Understanding the Laravel MVC Architecture
Understanding the Laravel MVC ArchitectureUnderstanding the Laravel MVC Architecture
Understanding the Laravel MVC Architecture
 
Slack Application Development 101 Slides
Slack Application Development 101 SlidesSlack Application Development 101 Slides
Slack Application Development 101 Slides
 
Transcript: #StandardsGoals for 2024: What’s new for BISAC - Tech Forum 2024
Transcript: #StandardsGoals for 2024: What’s new for BISAC - Tech Forum 2024Transcript: #StandardsGoals for 2024: What’s new for BISAC - Tech Forum 2024
Transcript: #StandardsGoals for 2024: What’s new for BISAC - Tech Forum 2024
 
SIEMENS: RAPUNZEL – A Tale About Knowledge Graph
SIEMENS: RAPUNZEL – A Tale About Knowledge GraphSIEMENS: RAPUNZEL – A Tale About Knowledge Graph
SIEMENS: RAPUNZEL – A Tale About Knowledge Graph
 
E-Vehicle_Hacking_by_Parul Sharma_null_owasp.pptx
E-Vehicle_Hacking_by_Parul Sharma_null_owasp.pptxE-Vehicle_Hacking_by_Parul Sharma_null_owasp.pptx
E-Vehicle_Hacking_by_Parul Sharma_null_owasp.pptx
 
Azure Monitor & Application Insight to monitor Infrastructure & Application
Azure Monitor & Application Insight to monitor Infrastructure & ApplicationAzure Monitor & Application Insight to monitor Infrastructure & Application
Azure Monitor & Application Insight to monitor Infrastructure & Application
 
Tech-Forward - Achieving Business Readiness For Copilot in Microsoft 365
Tech-Forward - Achieving Business Readiness For Copilot in Microsoft 365Tech-Forward - Achieving Business Readiness For Copilot in Microsoft 365
Tech-Forward - Achieving Business Readiness For Copilot in Microsoft 365
 
Breaking the Kubernetes Kill Chain: Host Path Mount
Breaking the Kubernetes Kill Chain: Host Path MountBreaking the Kubernetes Kill Chain: Host Path Mount
Breaking the Kubernetes Kill Chain: Host Path Mount
 
08448380779 Call Girls In Civil Lines Women Seeking Men
08448380779 Call Girls In Civil Lines Women Seeking Men08448380779 Call Girls In Civil Lines Women Seeking Men
08448380779 Call Girls In Civil Lines Women Seeking Men
 
Maximizing Board Effectiveness 2024 Webinar.pptx
Maximizing Board Effectiveness 2024 Webinar.pptxMaximizing Board Effectiveness 2024 Webinar.pptx
Maximizing Board Effectiveness 2024 Webinar.pptx
 
The transition to renewables in India.pdf
The transition to renewables in India.pdfThe transition to renewables in India.pdf
The transition to renewables in India.pdf
 
My Hashitalk Indonesia April 2024 Presentation
My Hashitalk Indonesia April 2024 PresentationMy Hashitalk Indonesia April 2024 Presentation
My Hashitalk Indonesia April 2024 Presentation
 
Presentation on how to chat with PDF using ChatGPT code interpreter
Presentation on how to chat with PDF using ChatGPT code interpreterPresentation on how to chat with PDF using ChatGPT code interpreter
Presentation on how to chat with PDF using ChatGPT code interpreter
 
Hyderabad Call Girls Khairatabad ✨ 7001305949 ✨ Cheap Price Your Budget
Hyderabad Call Girls Khairatabad ✨ 7001305949 ✨ Cheap Price Your BudgetHyderabad Call Girls Khairatabad ✨ 7001305949 ✨ Cheap Price Your Budget
Hyderabad Call Girls Khairatabad ✨ 7001305949 ✨ Cheap Price Your Budget
 
WhatsApp 9892124323 ✓Call Girls In Kalyan ( Mumbai ) secure service
WhatsApp 9892124323 ✓Call Girls In Kalyan ( Mumbai ) secure serviceWhatsApp 9892124323 ✓Call Girls In Kalyan ( Mumbai ) secure service
WhatsApp 9892124323 ✓Call Girls In Kalyan ( Mumbai ) secure service
 
SQL Database Design For Developers at php[tek] 2024
SQL Database Design For Developers at php[tek] 2024SQL Database Design For Developers at php[tek] 2024
SQL Database Design For Developers at php[tek] 2024
 
Neo4j - How KGs are shaping the future of Generative AI at AWS Summit London ...
Neo4j - How KGs are shaping the future of Generative AI at AWS Summit London ...Neo4j - How KGs are shaping the future of Generative AI at AWS Summit London ...
Neo4j - How KGs are shaping the future of Generative AI at AWS Summit London ...
 
Beyond Boundaries: Leveraging No-Code Solutions for Industry Innovation
Beyond Boundaries: Leveraging No-Code Solutions for Industry InnovationBeyond Boundaries: Leveraging No-Code Solutions for Industry Innovation
Beyond Boundaries: Leveraging No-Code Solutions for Industry Innovation
 
Unblocking The Main Thread Solving ANRs and Frozen Frames
Unblocking The Main Thread Solving ANRs and Frozen FramesUnblocking The Main Thread Solving ANRs and Frozen Frames
Unblocking The Main Thread Solving ANRs and Frozen Frames
 

Citysim

  • 1. Eleventh International IBPSA Conference Glasgow, Scotland July 27-30, 2009 CITYSIM: COMPREHENSIVE MICRO-SIMULATION OF RESOURCE FLOWS FOR SUSTAINABLE URBAN PLANNING Darren Robinson1, Haldi, F.1, Kämpf, J.1, Leroux, P.1, Perez, D.1, Rasheed, A.1, Wilke, U1 1 Solar Energy and Building Physics Laboratory (LESO-PB), Ecole Polytechnique Fédérale de Lausanne (EPFL), CH-1015 Lausanne, Switzerland - Definition of site location and associated climate ABSTRACT data. In this paper we describe new software “CitySim” - Choice and adjustment of default datasets for the that has been conceived to support the more types and age categories of buildings to be studied. sustainable planning of urban settlements. This first - Definition of 3D form of buildings; definition of version focuses on simulating buildings’ energy energy supply and storage systems to be modelled; flows, but work is also under way to model energy refinement of building and systems attributes. embodied in materials as well as the flows of water and waste and inter-relationships between these - Parsing of data in XML format from the GUI to the flows; likewise their dependence on the urban C++ solver for simulation of hourly resource climate. We discuss this as well as progress that has flows; analysis of results streamed back to the been made to optimise urban resource flows using GUI. evolutionary algorithms. But this is only part of the The scale of analysis may vary from a picture. It is also important to take into consideration neighbourhood of just a few buildings, though a the transportation of goods and people between district of several hundred to an entire city of tens of buildings. To this end we also discuss work that is thousand. But in each case the core modelling underway to couple CitySim with a micro-simulation capability and the data needs of these models is model of urban transportation: MATSim. similar. In the following we describe this modelling capability and how this is being extended to facilitate INTRODUCTION thoroughly comprehensive simulations of urban It is estimated that over half of the global population resource flows and how these might be optimised. is now living in urban settlements (UN, 2004), in which three quarters of global resources are CITYSIM: CORE MODELS consumed (Girardet, 1999). Energy derived from For the purposes of urban scale simulation, it is fossil fuels is key amongst these resources, so that important to achieve a good compromise between urban settlements are responsible for the majority of modelling accuracy, computational overheads and greenhouse gas emissions. It is thus important that data availability. In all cases these have been the existing urban settlements are adapted and that criteria applied in the selection of an appropriate proposed settlements are designed to minimise their modelling methodology. net resource consumption. Software for simulating Thermal Model and optimising urban resource flows will play an essential role in this process. In this paper we From the above criteria it was decided to develop a describe progress that is being made in one such model based on analogy with an electrical circuit; initiative: the development of CitySim. We also more specifically based on a resistor-capacitor describe work that is underway to add further network. In this case a conducting wall can be functionality to CitySim and to couple CitySim with represented by one or more temperature nodes a microscopic transport simulation model MATSim (Lefebvre, 1997). The heat flow between a wall and to resolve for all key urban resource flows. the outside air can be represented by an electric current through a resistor linking the two Achieving this would provide an invaluable platform corresponding nodes and the wall’s inertia can be for the testing of planning interventions to improve represented by a capacitance linked at that node. urban sustainability. In our model (Kämpf and Robinson, 2007), which is CITYSIM STRUCTURE a refinement of that due to Nielsen (2005), an In common with its predecessor SUNtool (Robinson external air temperature node Text is connected with et al, 2007) the use of CitySim’s Java-based GUI to an outside surface temperature node Tos via an simulate and optimise building-related resource flows external film conductance Ke, which varies according proceeds according to four key steps: to wind speed and direction (Figure 1). Tos, which also experiences heat fluxes due to shortwave and - 1083 -
  • 2. longwave exchange, is connected to a wall node Tw Where for the ith zone C1 and C2 are internal (air and of capacitance Cw via a conductance defined by the the wall separating zones i and j) and wall (external external part of the wall. In fact this node resembles a and separating) capacitances. D, E, F and G mirror plane, so that we have similar connections to correspond to combined conductances for external an internal air node Ta of capacitance Ci via an and separating walls. internal surface node Tis. Tis may also experience Predictions from this simplified model compare well shortwave flux due to transmitted solar radiation and with those of ESP-r (Clarke, 2001) for a range of a longwave flux due to radiant heat gains from monozone and multizone scenarios. internal sources (people and appliances) and Ta may Radiation models experience convective gains due to absorbed shortwave radiation, internal casual gains and heating In common with CitySim’s predecessor “SUNtool”, / cooling systems. Finally, our internal air node may the Simplified Radiosity Algorithm (SRA) of be connected with our external air temperature node Robinson and Stone (2004) is used to solve for the via a variable resistance due to infiltration and shortwave irradiance incident on the surfaces ventilation. defining our urban scene. For some set of p sky patches, each of which subtends a solid angle Φ (Sr) and has radiance R (Wm-2Sr-1) then, given the mean angle of incidence ξ (radians) between the patch and our receiving plane of slope β together with the proportion of the patch that can be seen σ (0 ≤ σ ≤ 1), Figure1: Monozone form of the CitySim thermal the direct sky irradiance (Wm-2): model. I dβ = ∑i =1 (RΦσ cos ξ )i p …(3) For a whole building with many subspaces, the air nodes of each zone are linked via the separating wall For this the well known discretisation scheme due to conductance. Interzonal airflow can also be handled Tregenza (1993) is used to divide the sky vault into through this conductance. To account for the 145 patches of similar solid angle and the Perez all corresponding inertia the capacitance of the weather model (Perez, 1993) is used to calculate the separating wall is subdivided and allocated to the radiance at the centroid of each of these patches. The neighbouring zone’s capacitance (Figure 2). direct beam irradiance I bβ is calculated from the beam normal irradiance Ibn which is incident at an angle ξ to our surface of which some fraction ψ is visible from the sun, so that: I bβ = I bnψ cos ξ …(4) Now the direct sky and beam irradiance contributes to a given surface’s radiance R which in turn influences the irradiance incident at other surfaces visible to it, so increasing their radiance and vice versa. To solve for this a similar equation to that used for the sky contribution gives the reflected diffuse irradiance. In this case two discretised vaults are used, one for above and one for below the horizontal plane, so that: Figure 2: Interzonal connection between zones represented by the two-node thermal model 2p ( I ρβ = ∑i =1 R * Φω cos ξ ) i …(5) In general, an n-node model may be represented by where ω is the proportion of the patch which is the following differential equation: obstructed by urban (reflecting) surfaces and R* is r r r C ⋅ T ′(t ) = A(t ) ⋅ T (t ) + u (t ) …(1) the radiance of the surface which dominates the r obstruction to this patch (in other words, that which Where T (t ) represents the temperature vector at the contributes the most to ω). As noted earlier, R* r n-nodes T ′(t ) denotes its derivative with respect to depends on reflected diffuse irradiance as well as on r the direct sky and beam irradiances. For this a set of time and u (t ) represents the source terms of each simultaneous equations relating the beam and diffuse node. C is the positive diagonal thermal capacity sky components to each surface’s irradiance, which matrix and A(t)is the symmetric heat transfer matrix. itself effects the reflected irradiance incident at other In the particular case of our two-node multi-zone surfaces, may be formulated as a matrix and solved model eq(1) can be expressed as follows: either iteratively or by matrix inversion (Robinson r r r and Stone, 2004). ⎛ C1 0 ⎞ ⎛ Ta′ (t ) ⎞ ⎛ D E ⎞ ⎛ Ta′ (t ) ⎞ ⎛ u a (t ) ⎞ ′ ...(2) ⎜ ⎟⋅⎜ r ⎟=⎜ ⎟⋅⎜ r ⎟+⎜r ⎟ ⎜0 ⎝ C 2 ⎟ ⎜ Tw (t )⎟ ⎜ F G ⎟ ⎜ Tw (t )⎟ ⎜ u w (t )⎟ ⎠ ⎝ ′ ⎠ ⎝ ⎠ ⎝ ′ ⎠ ⎝ ′ ⎠ The principle complication in the above algorithm lies in determining the necessary view factors. For - 1084 -
  • 3. obstruction view factors, views encapsulating the changing state, so that the transition absent to present hemisphere are rendered from each surface centroid, is found from: with every surface having a unique colour. Each μ −1 pixel is then translated into angular coordinates to T01 (t ) = ⋅ P(t ) + P(t + 1) …(7) μ +1 identify the corresponding patch as well as the angle of incidence. For sky view factors then, Φ σ cos ξ is And that of present to present from: treated as a single quantity obtained by numerical 1 − P(t ) P(t + 1) 1 − P(t ) T11 = ⋅ T01 + = ⋅ integration of cos ξ ⋅ d Φ across each sky patch. P(t ) P(t ) P(t ) …(8) Likewise for Φ ω cos ξ , for which the dominant ⎡ μ −1 ⎤ P(t + 1) ⎢ μ + 1 ⋅ P(t ) + P(t + 1)⎥ + P(t ) occluding surface is identified as that which provides ⎣ ⎦ the greatest contribution. A similar process is The remaining transitions are simply: T10 = 1 − T11 and repeated for solar visibility fractions for each surface, for which a constant size scene is rendered from the T00 = 1 − T01 . In addition to this we also need to sun position. consider long absences, for example due to illnesses In addition to using the above view information to or vacations. For this we use a daily profile of the calculate incident shortwave irradiance, this may also probability of starting a long absence and a further be used to calculate longwave irradiance; given the profile for the cumulative probability of the duration corresponding surface and sky temperatures (see of this absence. This takes precedence over the short Robinson and Stone 2005). Eq (3-5) may also be time step transitions in presence, described above. solved using luminance / illuminance as an input to For further details, we refer the reader to Page et al, model the external luminous environment. Additional (2007a). renderings may be then computed to determine the Although this occupancy model has been integrated view information necessary to calculate the direct with CitySim, it is currently disabled. Rather, and as and reflected contributions to internal illuminance (at an intermediate step, use is currently made of known points) as well as the incoming luminous flux deterministic rules / profiles describing occupants’ for internal reflection calculations (Robinson and presence and behaviour. In the near future however, Stone, 2005; 2006). the possibility will be provided to switch between Behavioural models deterministic representations and stochastic models. For this we will also use the models of: Haldi and One of the key sources of uncertainty in building / Robinson (2009a, b) for window openings and the urban simulation relates to occupants’ behaviour, corresponding ventilation exchanges; Haldi and which is inherently stochastic in nature. Key types of Robinson (2009c) for interactions with blinds and the behaviour and their main impacts on urban energy impacts on solar radiation and daylight transmission; flows are as follows: Page et al (2007b) for electrical appliances use and Presence: metabolic heat gains and pollutants. their associated power consumption and heat gain Windows: infiltration rates. production. In the first instance the simplified model Blinds: illuminance and transmitted irradiance. of Page (2007) will be used for solid waste production. Lights: heat gains and electrical power demand. For interactions with lights we will initially use the Electrical appliances: heat gains and electrical power same models as those integrated with Lightswitch- demand. 2002 (Reinhart et al, 2004). In particular, the Waste: production of combustible and recyclable probability of switching on lights at arrival as a solids. function of minimum internal workplane illuminance The central behavioural characteristic relates to (Ei,min) will be predicted by the expression due to occupants’ presence, which of course determines Hunt (1979). Switching on lights at intermediate whether they are available to exercise any other form times is also predicted as a function of Ei,min, but by of influence on resource flows. Based on the the expression of Reinhart and Voss (2003) whereas hypotheses that all occupants act independently and switching off at departure will be modelled as a that their actions at time t+1 depend only upon the function of expected duration of absence (Pigg et al, immediate past (t), we model transitions in 1996). Note that interactions with blinds will be occupants’ presence (present to absent (T10) or resolved before those with lights. present (T11) and vice versa) based on the Markov Plant and equipment models condition that: This category of model includes both heating, P (X t +1 = i X t = j , X t −1 = k ,..., X t − N = l ) ventilating and cooling (HVAC) systems and energy …(6) = P (X t +1 = i X t = j ) =: Tij (t ) conversion systems (ECS). The HVAC model is based on the psychrometry of For this we take as input a profile of the probability humid air, considering an ideal mixture of two of presence at each time t and a mobility parameter μ perfect gases: air and vapour. It computes the – the ratio of the probability of changing state to not psychrometric state (temperature and moisture - 1085 -
  • 4. content and hence the enthalpy h) of the air at each ith stage in its supply (e.g. outside, heat recovered, cooled and de-humidified, re-heated, supply). Given & the required mass flow rate m (which may be defined by the energy to be delivered or the room fresh air requirement) the total delivered sensible and latent loads for all stages in the heating and/or cooling of air q can then be calculated: q = ∑i mi Δh i n & …(9) The family of ECS models comprise a range of technologies that provide/store heat and/or electricity to buildings. These include a thermal storage tank model for hot/cold fluids, boilers, heat pumps, cogeneration systems, combined cogeneration and heat pump systems, solar thermal collectors, photovoltaic cells and finally wind turbines. These ECS models are in general based on performance curve regression equations whereas a simplified thermal model simulates the sensible / latent heat storage (so that phase change materials are also accounted for). If the ECS models have insufficient capacity to satisfy the HVAC demands then the supply state is Figure 3: Conceptual structure of CitySim adjusted and the predicted room thermal state is corrected (using the thermal model). CITYSIM: EXAMPLE APPLICATION OF Integration CORE MODELS The conceptual structure of CitySim is presented in We have applied CitySim’s core models to a group of Figure 3 below. The GUI produces an XML file buildings in the district of Matthäus in Basel which contains a geometric description of our urban (Switzerland). For this, we used a 3D model provided scene together with numerous attributes that relate to by the city’s Cadastral Office, and completed the each of the models influencing urban resource flows. physical description of the buildings by means of the This XML file also contains pointers to a climate file national census data for the year 2000 and results as well as to the appropriate entries in databases from a recent visual field survey of the district. relating to building constructions, occupatants’ Figure 4 shows a projected view of the group of behaviour and plant and equipment characteristics as buildings simulated, in which we have represented well as the fuels combusted. This data is parsed to the for one particular day and hour in the year the surface CitySim solver, which creates instances of the averaged irradiance at its centroid by coloured points. objects describing our scene. Each of the models are The colour map used represents the intensity in then called in turn and are parsed the necessary data. irradiance, from red to blue, calculated by the SRA Shown in black are each of the functions that have model. been developed within CitySim and shown in grey are those that are either under development or are planned to be developed in the near future. These are described in the remaining sections of this paper. Figure 4: A projection of the group of buildings simulated in Matthäus district, Basel, Switzerland. Using the buildings’ construction date, renovation status and with the help of renovation specialists (EPIQR Rénovation), we attributed the physical characteristics relating to the walls, roofs and - 1086 -
  • 5. windows. See Kämpf and Robinson (2009) for a database would be of use for embodied energy fuller description of this scene and the means for its content). However, one way of maximising the re-use attribution. of this effort would be the use of an on-line open data By way of example, figure 5 shows the averaged respository – providing open access to users’ data. internal building temperature and the ideal heating Further resource flows and cooling demands for a selected building in the The appliance model which is currently under group, throughout the year on an hourly basis. The development for integration within CitySim has thus temperature set-points were chosen to be 21°C for far been calibrated exclusively to model electrical heating and 26°C for cooling. appliances. It does not currently model water Zone averaged internal temperature (celsius) 80 consumption from appliances that consume Heating needs (kW) 25 Cooling needs (kW) 70 exclusively water or both water and electricity. 60 It is thus planned to develop a simplified model of 20 50 water flows, including: - The consumption of water in buildings, Temperature (celsius) 40 distinguishing the quality of water required to Power (kW) 15 30 support the activity concerned as well as the 20 quality of output waste water. 10 10 - Evapotranspiration from vegetated surfaces and the 0 associated consumption of water for irrigation. 5 -10 - Harvesting and storage of rainwater and recycling of consumed water. 0 -20 0 1000 2000 3000 4000 5000 Hour in the year 6000 7000 8000 - Supply of water from recycled, harvested and mains sources. Figure 5: Internal volume-averaged temperature and heating and cooling demands for one of a group of Modelling of surface water drainage is currently buildings. considered to be beyond the scope of CitySim. As part of this water processing module the CITYSIM: FURTHER MODULES anaerobic digestion of human waste will also be In parallel with the above work in developing the modelled in a simplified way. Combustible biogas core solver for CitySim, we have also been active in and solid waste (predicted using the simplified solid developing a range of complementary modelling waste model mentioned under ‘core models’) will capabilities to enhance CitySim’s scope. These as then be available for input to the ECS models. well as some planned models (on which work will In the longer term, as we increase our scale of start shortly) are described below, to give a flavour of analysis as well as the diversity of building types that what CitySim’s capabilities are expected to be in the are modelled, it will be of special interest to model near future. possible synergetic exchanges of energy and matter Further object attribution between buildings or the activities accommodated The energy flows during the operation of an urban within them. In this way it will be possible to test development are just part of the story. It is also of hypotheses inspired by industrial ecology regarding interest to consider the embodied energy content of ways of minimising net urban resource use, through materials, to facilitate life cycle energy analysis. improved circularity in their flows. Related to this is an issue of primordial importance to Consider the industrial park on the outskirts of the the urban designer and developer – that of cost (both town of Kalundborg in Denmark for example. capital and running). Realistically speaking, this Amongst the numerous synergetic exchanges, the typically outranks environmental performance as a waste heat produced by the power station meets the fitness function to optimise. Work is thus underway space heating and hot water demands of the town’s to add these additional attributes (cost and embodied buildings and a fish-farm as well as the process heat energy) to the properties of the objects that comprise needs of a bioplant and an oil refinery. The bioplant a CitySim urban scene. This is straightforward. Less produces yeast for pig farmers as well as straightforward is the compilation of databases that fermentation sludge for local farmers. Gypsum from are rich enough to describe the attributes of the most the power station’s flue gas desulphurisation plant is commonly used construction / servicing products for a key raw material of a plasterboard potentially any users’ location, including the costs of manufacturer…and so on. The reduction in resource their acquisition and the local labour involved in their imports and exports are considerable. These utilisation (construction labour). Likewise, the time- principles are readily applicable to urban varying local energy purchase and feed-in tariffs. developments, which tend to accommodate rich sets Clearly much of the onus here will need to be placed of energy and matter flows. upon the user (although the ETHZ EcoInvent - 1087 -
  • 6. Since the processes involved may be represented in not only the buildings from which it is composed but an aggregate way (as is typical with mass flow also the scales which are bigger than the city itself. analysis), representing the potential exchanges need This new modelling capability, which is described in should not be difficult; provided of course that the Rasheed et al (2009), may be run as a pre-process to necessary data is available. modify the climatic inputs to CitySim. Urban climate modelling Evolutionary algorithms Compared with rural settings, in the urban context For a new urban development, even with a relatively more shortwave radiation is absorbed, less longwave limited number of variables (geometry, type of use, radiation is emitted and the mean wind speed is occupancy and constructional characteristics, plant lower, so that the mean air temperature is higher. and energy supply technologies), the number of This urban heat island is exacerbated by permutations is very large. The probability of anthropogenic heat sources and the relative lack of identifying an optimal configuration of these evapotranspiration due to vegetated surfaces. Due to variables by manual trial and error or simple inertial differences, urban and rural temperature parametric studies is thus correspondingly small. profiles also tend to be out of phase, so that whilst Moreover the response function computed by the mean urban temperature is higher, afternoon CitySim may exhibit a non-linear, multi-modal and temperatures may be lower, particularly in summer. discontinuous behaviour. Therefore heuristic These urban-rural temperature differences can have methods such as Evolutionary Algorithms are needed significant implications for predicted resource to overcome possible local optima, keeping in mind demands and so needs to be account for in our that we can never be sure of finding the global simulations. optimum in a finite time frame. Although the influencing mechanisms are reasonably Following from a review of available evolutionary well understood, predicting the urban climate is algorithms (EAs), we have developed a hybrid of two complicated by the scales involved: from buildings algorithms (Covariance Matrix Adaptation – within the urban canopy (the size of a few meters) to Evolutionary Strategy [CMA-ES] and Hybrid large topographical features such as nearby water Differential Evolution [HDE]) which offers improved bodies or mountains (the size of a few kilometres). robustness over its individual counterparts for a These scales cannot be satisfactorily resolved in a larger range of optimisation problems (Kämpf and computationally tractable way using a single model. Robinson, 2009a,b). Our solution to this problem has been to couple After having applied this new algorithm to a range of different models which each address different spatial solar radiation optimisation problems, we have scales. recently coupled this with CitySim and deployed it to Firstly, freely available results from a global (macro) explore ways of optimising the energy performance model are input to a meso-model at a slightly larger of part of a district of the City of Basel in scale than that of our city. This meso-model is then Switzerland, called Matthäus (see Kämpf and run as a pre-process to interpolate the macro-scale Robinson, 2009c). Work will shortly start on the results at progressively finer scales until the integration of an interactive tool within CitySim with boundary conditions surrounding our city are which users will be able to select parameters to resolved at a compatible scale. The meso-model may optimise, together with the constrained range of then be run in the normal way. In the rural context values they may take and the criteria with which this may simply involve associating topography and overall fitness is to be judged. average land use data with each cell, the former Uncertainty analysis affecting temperature as pressure changes with height the latter affecting temperature due to Finally, it is likely that the uncertainty in some of the evapo(transpir)ation from water bodies or vegetated inputs to urban models, particularly in relation to the surfaces. In the urban context however, it is conceptual design of new developments, may have a important to account for the energy and momentum significant impact on performance predictions and exchanges between our built surfaces and the the conclusions reached from these predictions. adjacent air, which implies some representation of To be able to accommodate these uncertainties in 3D geometry. For this we use a new urban canopy urban scale predictions, we intend to borrow model in which the velocity, temperature and scalar techniques developed for the simulation of individual profiles are parameterised as functions of built buildings (e.g. De Witt (2001) and Macdonald densities, street orientation and the dimensions of (2002)). A facility should then be provided within the urban geometric typologies. These quantities are then interface to define the uncertainties of the parameters used to estimate the sources and sinks of the to which predictions are found to be particularly momentum and energy equations. sensitive, and to select these parameters for Thus, a completely coupled macro, meso and urban simulation purposes. canopy model can be used to predict the temperature, wind and pressure field in a city taking into account - 1088 -
  • 7. MULTI- AGENT TRANSPORT ones are discarded and those that are retained are SIMULATION (MATSIM) used to create the next generation. This process continues for a defined number of iterations until a Resources in urban settlements are consumed daily plan of near optimal utility has been identified principally by buildings and the activities for each agent. This corresponds to the way in which accommodated with them and by the transport of humans learn from experience what is the most goods and people to and between them. To account efficient time to leave one destination for another and for this transport related energy use, we use the according to what route. For example we may choose Multi-Agent Transport Simulation Toolkit MATSim- to leave home rather early in the morning to arrive at T (1990). work quickly and also leave earlier to avoid heavy MATSim-T simulates the sub-hourly transport of afternoon traffic. individual people within a given urban scene. With agents’ daily travel plans chosen, their journeys For this a geometric description of the scene is may be simulated and the associated fuel required, consisting primarily of the transport consumption calculated, using empirical performance network nodes and the links between them as well as data. the locations of activities (work, home, education etc) Now to couple CitySim and MATSim all that is located at or adjacent to these nodes / links. Using required is that the two tools share a common XML geo-coordinated census data a population of file holding (amongst other variables) building IDs households may then be created which is then and the characteristics of the occupants. By running populated with individuals and associated with MATSim as a pre-process to CitySim the means for attributes such as ID, driving licence ownership, car data exchange will be the arrival and departure time availability, etc. Activity chains1 such as home-work- of occupants – in effect replacing the current leisure-work-home and the locations and preferred stochastic occupancy model. timing of these activities are then associated with these agents. With this initialisation complete the As noted earlier, MATSim’s initialisation process scene may be simulated (Figure 6). associates a range of attributes to each individual agent. These include age, gender and salary. To these we may add other attributes such as environmental preferences. In a CitySim pre-process we may then divide apartment buildings into households of appropriate size and allocate appliances to these households. We may refine our stochastic models so that behaviour is predicted as a function of say preferred summertime temperature or indoor illuminance…etc. In short, a coherent way for integrating MATSim and CitySim is through the multi-agent stochastic simulation of behaviour. Work has recently started in developing this new Figure 6: MATsim-T simulation of traffic results fo MAS behavioural modelling environment. It is hoped Zürich, Switzerland (from: www.matsim.org). that this modelling utility will be integrated into First the travel time of alternative plausible routes future single building as well urban simulation between the origin and destination of each journey is programs. calculated to determine the least cost routes. This is CONCLUSIONS AND OUTLOOK carried out for all activity chains of all agents until all journey plans have been deduced. A stochastic Considerable progress has been made in recent years queue-based traffic simulation then simulates each to simulate the availability of renewable energy agent’s journeys throughout the network. The actual within the urban context as well as the more general arrival time at each destination then depends on the demand for and consumption of resources (energy, degree of network congestion. water and waste); culminating in the recent development of CitySim, to which this paper relates. Next a score is associated with the utility of the achieved daily travel plan, considering the utility of But their remains a great deal of work to do if we are the time spent performing the required activities, the to model urban resource flows, due to both buildings time spent in travel and whether or not these and transport, in a truly comprehensive way, together activities were started late. Using an evolutionary with means for optimising them. This is however a algorithm in which each member of a given very exciting challenge and one which, should we generation corresponds to a new travel plan the next succeed, would produce a model of acute value to travel plan in line is then simulated. The success of future planners of urban settlements, both new and these plans are then ranked. The worst performing existing! 1 e.g. derived from Swiss microcensus data - 1089 -
  • 8. ACKNOWLEDGEMENT Page, J. (2007), Simulating occupant presence and behaviour in buildings, Unpublished PhD Thesis, Financial support received for this work from the EPFL. European Commission as part of the CONCERTO II Project HOLISTIC is gratefully acknowledged. Page, J., Robinson, D., Morel, N., Scartezzini, J.-L. (2007a), A generalised stochastic model for the REFERENCES prediction of occupant presence, Energy and Clarke, J.A. (2001), Energy Simulation in Building Buildings, 40(2) p83-98. Design, Butterworth-Heinemann: Oxford. Page, J., Robinson, D., Morel, N., Scartezzini, J.-l. de Wit, M.S. (2001), Uncertainty in prediction of (2007b), Stochastic simulation of occupant presence thermal comfort in buildings, PhD Thesis, Delft and behaviour in buildings, Proc. Tenth Int. IBPSA University of Technology, Delft. Conf: Building Simulation 2007, Beijing, China. Girardet, H. (1999), Creating sustainable cities, Perez, R., Seals, R., Michalsky, J. (1993), All- Schumacher Briefing 2, Green Books. weather model for sky luminance distribution–– preliminary configuration and validation. Solar Haldi, F. Robinson, D. (2009a), A comprehensive Energy 50 (3), 235–243. stochastic model of window opening behaviour, Building and Environment, in press Pigg, S., Eilers, M., Reed, J. (1996), Behavioural (doi:10.1016/j.buildenv.2009.03.025). aspects of lighting and occupancy sensors in privates offices: a case study of a university office building. Haldi, F. Robinson, D. (2009b), A comprehensive In: Proc. ACEEE Summer Study on Energy stochastic model of window usage: theory and Efficiency in Buildings 8, pp. 8.161–8.171. validation, ibid. Rasheed, A. Robinson, D. (2009), Multiscale Haldi and Robinson (2009c) , A comprehensive modelling of the urban climate, ibid. stochastic model of blind usage: theory and validation, ibid. Reinhart, C. F. (2004), Lightswitch-2002: a model for manual and automated control of electric lighting Hunt, D.R.G. (1979), The use of artificial lighting in and blinds, Solar Energy, 77(1), p15–28. relation to daylight levels and occupancy. Building and Environment (14), 21–33. Reinhart, C.F. and Voss, K. (2003), Monitoring manual control of electric lighting and blinds. Kämpf, J., Robinson, D. (2007), A simplified thermal Lighting Research & Technology 35(3), p243–260. model to support analysis of urban resource flows, Energy and Buildings 39(4), p445-453. Robinson, D., Stone, A. (2004), Solar radiation modelling in the urban context, Solar Energy, (77)3, Kämpf, J., Robinson, D. (2009a), A hybrid CMA-ES p295-309. and DE optimisation algorithm with application to solar energy potential, Applied Soft Computing 2(9) Robinson, D., Stone, A. (2005), A simplified p738-745. radiosity algorithm for general urban radiation exchange, Building Services Engineering Research Kämpf, J., Robinson, D., Optimisation of building and Technology, 26(4), p271-284. form for solar energy utilisation using constrained evolutionary algorithms, Energy and Buildings Robinson, D., Stone, A. (2006), Internal illumination (submitted) prediction based on a simplified radiosity algorithm, Solar Energy, 80(3), p260-267. Kämpf, J., Robinson, D. (2009c) Optimisation of urban energy demand using an evolutionary Robinson, D., Campbell, N., Gaiser, W., Kabel, K., algorithm, ibid. Le-Mouele, A., Morel, N., Page, J., Stankovic, S., Stone, A. (2007), SUNtool – a new modelling MATSim-T, 1990, www.matsim.org/ paradigm for simulating and optimising urban Nielsen, T. R. (2005), Simple tool to evaluate energy sustainability, Solar Energy, 81(9), p1196-1211 demand and indoor environment in the early stages Tregenza, P., Sharples, S. (1993), Daylighting of building design. Solar Energy 78 (1), pp. 73-83. algorithms. ETSU S 1350-1993, UK. Lefebvre, G., Bransier, J., Neveu, A. (1987), United Nations (2004). Department of Economic and Simulation du comportement thermique d’un local Social Affairs / Population Division. World par des methodes numeriques d’ordre reduit, Revue Urbanization Prospects: The 2003 Revision. New Generale de Thermique 26(302) 106–114. York: United Nations, p.3. Macdonald, I.A. (2002), Quantifying the Effects of Uncertainty in Building Simulation. Ph.D. Thesis, ESRU, University of Strathclyde. Nielsen, T.R. (2005), Simple tool to evaluate energy demand and indoor environment in the early stages of building design, Solar Energy 78 (1), p73–83. - 1090 -