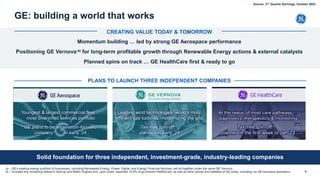
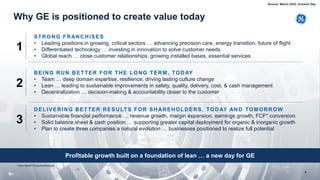
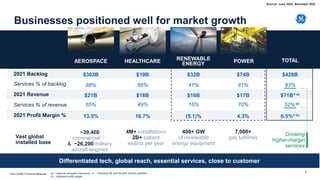
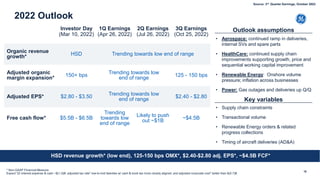
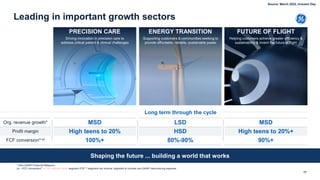
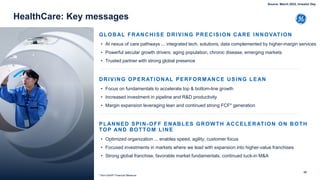
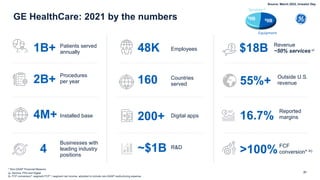
GE 2022 Company Overview
December 2022
CAUTION CONCERNING FORWARD-LOOKING STATEMENTS:
This document contains "forward-looking statements" – that is, statements related to future events that by their nature
address matters that are, to different degrees, uncertain. For details on the uncertainties that may cause our actual future
results to be materially different than those expressed in our forward-looking statements, see https://www.ge.com/investor-
relations/important-forward-looking-statement-information as well as our annual reports on Form 10-K and quarterly reports
on Form 10-Q. We do not undertake to update our forward-looking statements. This document also includes certain
forward-looking projected financial information that is based on estimates and forecasts. Actual results could differ
materially.
NON-GAAP FINANCIAL MEASURES:
In this document, we sometimes use information derived from consolidated financial data but not presented in our financial
statements prepared in accordance with U.S. generally accepted accounting principles (GAAP). Certain of these data are
considered “non-GAAP financial measures” under the U.S. Securities and Exchange Commission rules. These non-GAAP
financial measures supplement our GAAP disclosures and should not be considered an alternative to the GAAP measure.
The reasons we use these non-GAAP financial measures and the reconciliations to their most directly comparable GAAP
financial measures are included in our earnings releases and the appendix of this presentation, as applicable.
Amounts shown on subsequent pages may not add due to rounding.
GE’s Investor Relations website at www.ge.com/investor and our corporate blog at www.gereports.com, as well as GE’s
Facebook page and Twitter accounts, contain a significant amount of information about GE, including financial and other
information for investors. GE encourages investors to visit these websites from time to time, as information is updated and
new information is posted.
2
GE Overview
GE: building a world that works
4
Momentum building … led by strong GE Aerospace performance
Positioning GE Vernova-a) for long-term profitable growth through Renewable Energy actions & external catalysts
Planned spins on track … GE HealthCare first & ready to go
Solid foundation for three independent, investment-grade, industry-leading companies
Power - Received a Kindle Energy order to provide H-Class power
generation equipment for its expected 725MW natural gas-fired
Magnolia Power Plant
CREATING VALUE TODAY & TOMORROW
PLANS TO LAUNCH THREE INDEPENDENT COMPANIES
(a – GE's existing energy portfolio of businesses, including Renewable Energy, Power, Digital, and Energy Financial Services, will sit together under the name GE Vernova
(b – Includes any remaining stakes in AerCap and Baker Hughes and, upon close, expected 19.9% of go-forward HealthCare, as well as other assets and liabilities of GE today, including run-off Insurance operations
GE plans to be an aviation-focused
company-b) … in early '24
Youngest & largest commercial fleet ...
most diversified services portfolio
Tax-free spin-off...
planned in early ’24
Leading wind technologies, world's most
efficient gas turbines, modernizing the grid
Source: 3rd Quarter Earnings, October 2022
GE HealthCare ready to go … targeted for Jan 4, '23
Announced Board of Directors for
future independent company
Publicly filed Form 10
Hosting Investor Day on December 8
Global leader in precision care
Outstanding portfolio of innovative
products & solutions
Accelerating growth & margin expansion
Creating long-term value as a faster-growing, more profitable company
RECENT SPIN PROGRESS
CLEAR STRATEGY FOR VALUE CREATION
5
Source: 3rd Quarter Earnings, October 2022
Why GE is positioned to create value today
Profitable growth built on a foundation of lean … a new day for GE
* Non-GAAP Financial Measure
STRONG FRANCHISES
• Leading positions in growing, critical sectors … advancing precision care, energy transition, future of flight
• Differentiated technology … investing in innovation to solve customer needs
• Global reach … close customer relationships, growing installed bases, essential services
1
BEING RUN BETTER FOR THE LONG TERM, TODAY
• Team … deep domain expertise, resilience, driving lasting culture change
• Lean … leading to sustainable improvements in safety, quality, delivery, cost, & cash management
• Decentralization … decision-making & accountability closer to the customer
2
DELIVERING BETTER RESULTS FOR SHAREHOLDERS, TODAY AND TOMORROW
• Sustainable financial performance … revenue growth, margin expansion, earnings growth, FCF* conversion
• Solid balance sheet & cash position … supporting greater capital deployment for organic & inorganic growth
• Plan to create three companies a natural evolution … businesses positioned to realize full potential
3
6
Source: March 2022, Investor Day
(a – revenue excludes Insurance
(b – Adjusted profit margin
Businesses positioned well for market growth
HEALTHCARE
4M+ installations
2B+ patient
exams per year
POWER
7,000+
gas turbines
400+ GW
of renewable
energy equipment
7
TOTAL
2021 Backlog $19B $74B $428B
2021 Revenue $18B $17B $71B*-a)
Services % of revenue 49% 70% 52%-a)
2021 Profit Margin % 16.7% 4.3% 6.5%*-b)
Services % of backlog 66% 81% 83%
RENEWABLE
ENERGY
$32B
$16B
16%
(5.1)%
41%
Growing
higher-margin
services
Vast global
installed base
* Non-GAAP Financial Measure
Differentiated tech, global reach, essential services, close to customer
AEROSPACE
~39,400
commercial-c)
& ~26,200 military
aircraft engines
$303B
$21B
65%
13.5%
88%
(c – Including GE and its joint venture partners
Source: June 2022, Bernstein SDC
Delivering profitable growth
8
LASTING CULTURE CHANGE
Acting with humility Leading with transparency
LEAN AT THE FOUNDATION
Focus on customer
During GE Kaizen Week, the Aerospace team “trystormed” possible solutions
to improve missed delivery targets including visual management
Delivering with focus
Driving safety, quality, delivery, & cost improvements in GE’s nearly 30 business P&Ls
Elimination of waste
HealthCare is making production more efficient at its plant in Hino, Japan
through value stream mapping, standard work & Kaizen
Gas Power uses Hoshin Kanri to prioritize deploying its lean work to its most
strategic objectives, such as improving the 7F outage customer experience
Prioritization of work
Source: March 2022, Investor Day
Playing offense: Innovation, growth & profitability
Market, sell & service products we have today
Strengthen offerings with new product introductions
Technology to lead industries forward
Strategic M&A to expand competitive capabilities
Together with GE Research, Aerospace announced
a new research partnership with NASA to accelerate the introduction
of hybrid electric flight technologies for commercial aviation
PRIORITIZING ORGANIC INVESTMENTS
COMPLEMENTED BY INORGANIC INVESTMENT
9
Safety, quality, delivery & cost a must ... driving shorter lead times, growth &
profitability
IMPROVING OPERATIONS FIRST
Fortifying competitive positions globally & unlocking upside potential
Source: March 2022, Investor Day
Building a world that works for tomorrow
Progressing our efforts & improving programs
• Progress toward 2030 carbon neutrality commitment: 21% reduction vs. 2019
(Scope 1 & 2 emissions)
• Ambition to be a net zero company by 2050, for Scope 3 emissions from use of
sold products
• Executed ESG issues assessment for GE Company and our businesses
• Introduced clearer product safety and quality goals, programs and initiatives
as well as a holistic strategy around product stewardship and circular
economy
• Published our inaugural GE Human Rights Report, providing increased
transparency into our governance and due diligence processes
Source: 2021 GE Sustainability
Report
1 based on full-time equivalent, active employees as of December 31, 2021
2 CFM International is a 50-50 joint venture (JV) between GE and Safran Aircraft Engines; Engine Alliance is a 50-50 JV between GE and Pratt & Whitney
3 GE, customer and partner funded
Sustainability Priorities
How are strategy and
sustainability priorities
align with the UN
Sustainable
Development Goals
(SDGs)
10
10
Our Representation
11
Building a world that works for everyone
Committed to a More Diverse Workforce
• GE a global company … 68% of employees based outside of the U.S.,
representing nationalities from 169 countries
• Saw growth at the leadership level for both women globally (+1.2%)
and for total U.S. race and ethnic minority (+1.7%) since 2020
• On average, men and women performing similar work are paid within
1% of each other in each GE business
• GE Board of Directors female representation at 36%, with two of four
Board leadership positions held by women
• GE launched Next Engineers in 2021 … a global college-readiness initiative
to increase the diversity of young people in engineering
Source: 2021 GE Diversity Report
Leadership encompasses the top 1.5% of all active employees; female representation growth relative to 2020-based
Clinical Apps
Meet Our Employee Resource Groups
AFRICAN AMERICAN/AFFINITY FORUM (AAF)
Building on a deep-rooted history and culture within GE as the oldest ERG
ASIAN PACIFIC ALLIES & FRIENDS (APAF)
Supporting GE’s Asian Pacific Islander (API) employees
PRIDE ALLIANCE (PRIDE)
Welcoming the LGBTQAI+ community and their allies
HISPANIC FORUM (HF)
Promoting Hispanic heritage, showcasing Hispanic talent and value
DISABILITIES ADVOCACY NETWORK (DAN)
Enabling people with disabilities, their families, and allies to connect & thrive
VETERANS NETWORK (VN)
Encouraging the career development & growth of our veterans
WOMEN’S NETWORK (WN)
Attracting, developing, inspiring, & retaining female professional talent
GREEN TEAM NETWORK (GTN)
Furthering our sustainability goals with a grassroots-driven approach
Proud to have been an early leader in the creation of strong Employee
Resource Groups (ERGs) nearly 30 years ago
Taking action – GE Aerospace & GE HealthCare
12
Lean fundamentals critical to driving improved delivery
AEROSPACE - OE AEROSPACE - SERVICES
• Improvement versus 1Q
• Largest constraints: structural
castings & forgings
• Improvement throughout 2Q
• Constraints: repairs, castings,
forgings, labor gaps
Mfg. lines at shortage risk
• Lowest since March ‘21
• Constraints: chips, resins
• Inflation from spot buys, logistics
Work stops
• 6 recent LEAP supplier kaizens
• Daily management to drive
throughput (e.g. Hooksett plant)
• Dedicated additional 20% of existing
engineers to support delivery
• 70 manufacturability projects in 1H’22
• Monthly recruiting kaizens to ramp
labor across multiple sites
• ~1,600 skilled mechanics added
• Improving overhaul turn around time
◦ Wales Shingi … 5% faster cycle
◦ Multiple Repair kaizens
• Supplier actions, dual sources
• >6,400 alternative subcomponents/
design changes
• >20% cycle time reduction at Cork,
expanded factory capacity
• Secured critical components for 2H
Material issues
HEALTHCARE
Engine output up >3% q/q Shop visit-a) output up >20% q/q Overdue backlog down >5% q/q
(a – Internal shop visits
Source: 2nd Quarter Earnings, July 2022
Taking action – GE Vernova
13
Experienced leaders running proven playbook across businesses
POWER PLAYBOOK RENEWABLE ENERGY FOCUS
Market
expectation
"Fixed" cost
Product cost
Price,
selectivity &
underwriting
• Conservatively assumed & sized Gas
business for ~25-30 GW global market
• Developing strategy which assumes ~2,000
GE Onshore turbines/year
• Refocusing on select geographies
• Building plans to resize footprint in line with
market & selectivity
• Cost actions to yield significant savings
• Driving NPI cost curve down and industrializing
supply chain for large scale production
• Proactive fleet durability actions
• Improved product durability
• Focused on product cost & CSA productivity
• Narrow scope – equipment, Steam services
• Grow higher-margin Aero & Services
• Services escalation & list price increases
• Defined international strike zones
• Grow higher-margin Grid Automation, Services
• Focus on price … Onshore price improving
• Reduced headcount ~20% since ‘18
• Gas Power ~$1B reduced cost
Lean &
decentralization
• Reorganized into 4 P&Ls, removed HQ
• Lean at foundation, e.g. Live Outage
• Decentralizing & driving full P&L accountability
• Example: Grid reorganization into 3 P&Ls
• Embedding lean, cross functional problem solving
GE’s portfolio of energy businesses
Source: 2nd Quarter Earnings, July 2022
Driving Renewable Energy profitability in 2024
TAKING ACTION: ONSHORE WIND GE VERNOVA EXTERNAL CATALYSTS
(a – Subject to EWC consult & approval; program across GE Vernova businesses, primarily at Renewable Energy
(b – Source: ’13-’23 WoodMac; ’24-’34 GE forecast
GE’s portfolio of energy businesses
GE Vernova – path to profitability
• Historic action in U.S., EU, globally on climate, energy
• U.S.: Inflation Reduction Act: ~$370B for energy, 10 year
package aligned with GE Vernova technology;
Infrastructure & Investment Jobs Act: $65B+ for grid
modernization, nuclear, breakthroughs
• EU: energy crisis accelerating pragmatic approach for
reduced emissions & energy security … Taxonomy
approved with support for gas, nuclear, renewables
• Focused on improving fleet availability, better balancing
innovation & industrialization
◦ Pivot to standard, simplified, “workhorse”
products ... improving quality & product cost
◦ Deploying corrective measures in existing fleet
• Driving selectivity by narrowing geographic focus,
significant price improvement
• Across businesses, initiating restructuring over a few
years ... planning for ~$0.5B annualized savings-a) &
~$0.6B expense-a)
U.S. Onshore Average Installations (GW)-b)
~9
~15
’13 – ‘23 ’24 – ‘34
14
Source: 3rd Quarter Earnings, October 2022
Digital launched Opus One Distributed Energy
Resource Management System to help keep the
electric grid safe, secure, and resilient
Innovation and growth highlights
15
Power secured an order for 9HA combined cycle
power plants in Vietnam – the first HA powered plant
in the country
Strengthening competitive positions globally & unlocking upside potential
HealthCare launched Voluson Expert 22, with artificial
intelligence powered ultrasound unlocking new imaging
and processing power
HealthCare & Medtronic are enabling personalized
care on the CARESCAPE precision monitoring
platform
Aerospace announced 200 CFM-International LEAP-
1B engines were selected by Delta Air Lines to power
its new fleet of 737-10 aircraft
Aerospace completed the world's first test of a megawatt-
class and multi-kilovolt hybrid electric propulsion system
at altitude simulating single-aisle commercial flight
GE VERNOVA
GE's portfolio of energy businesses
HEALTHCARE
AEROSPACE
Source: 2nd Quarter Earnings, July 2022
HSD revenue growth* (low end), 125-150 bps OMX*, $2.40-$2.80 adj. EPS*, ~$4.5B FCF*
Outlook assumptions
• Aerospace: continued ramp in deliveries,
internal SVs and spare parts
• HealthCare: continued supply chain
improvements supporting growth, price and
sequential working capital improvement
• Renewable Energy: Onshore volume
pressure; inflation across businesses
• Power: Gas outages and deliveries up Q/Q
Investor Day
(Mar 10, 2022)
1Q Earnings
(Apr 26, 2022)
2Q Earnings
(Jul 26, 2022)
3Q Earnings
(Oct 25, 2022)
Organic revenue
growth*
HSD Trending towards low end of range
Adjusted organic
margin expansion*
150+ bps Trending towards low
end of range
125 - 150 bps
Adjusted EPS* $2.80 - $3.50 Trending towards low
end of range
$2.40 - $2.80
Free cash flow* $5.5B - $6.5B
Trending
towards low
end of range
Likely to push
out ~$1B
~$4.5B
* Non-GAAP Financial Measure
Expect '22 interest expense & cash ~$(1.5)B, adjusted tax rate* low-to-mid twenties w/ cash & book tax more closely aligned, and adjusted corporate cost* better than $(0.7)B
Key variables
• Supply chain constraints
• Transactional volume
• Renewable Energy orders & related
progress collections
• Timing of aircraft deliveries (AD&A)
2022 Outlook
16
Source: 3rd Quarter Earnings, October 2022
Leading in important growth sectors
PRECISION CARE
Driving innovation in precision care to
address critical patient & clinical challenges
ENERGY TRANSITION
Supporting customers & communities seeking to
provide affordable, reliable, sustainable power
FUTURE OF FLIGHT
Helping customers achieve greater efficiency &
sustainability & invent the future of flight
MSD
High teens to 20%+
90%+
* Non-GAAP Financial Measure
(a – FCF conversion* on GE defined basis: segment FCF* / segment net income, adjusted to include non-GAAP restructuring expense
LSD
HSD
80%-90%
Long term through the cycle
Shaping the future ... building a world that works
MSD
High teens to 20%
100%+
17
Org. revenue growth*
Profit margin
FCF conversion*-a)
Source: March 2022, Investor Day
GE HealthCare
HealthCare: Key messages
19
GLOBAL FRANCHISE DRIVING PRECISION CARE INNOVATION
• At nexus of care pathways ... integrated tech, solutions, data complemented by higher-margin services
• Powerful secular growth drivers: aging population, chronic disease, emerging markets
• Trusted partner with strong global presence
DRIVING OPERATIONAL PERFORMANCE USING LEAN
• Focus on fundamentals to accelerate top & bottom-line growth
• Increased investment in pipeline and R&D productivity
• Margin expansion leveraging lean and continued strong FCF* generation
PLANNED SPIN-OFF ENABLES GROWTH ACCELERATION ON BOTH
TOP AND BOTTOM LINE
• Optimized organization ... enables speed, agility, customer focus
• Focused investments in markets where we lead with expansion into higher-value franchises
• Strong global franchise, favorable market fundamentals, continued tuck-in M&A
* Non-GAAP Financial Measure
Source: March 2022, Investor Day
MARKET NEEDS
Enabling precision care ... built around patient and customer
Leading innovator enabling personalized and precision
care through integrated clinical care, connected
technology, and data across patient journey
Improving lives in the moments that matter, for both
patient and caregiver
20
Health system efficiency
& access
• Demand for efficiency & flexibility
where care is delivered
• Cost-effective products to
increase access
Digitization of health
• More precise diagnostics,
better interoperability,
improved workflow
• Seamless integration of
artificial intelligence to
improve outcomes
Improved outcomes
• Specific data insights to make
informed decisions
• Advancements in diagnostics,
monitoring, & therapeutics
Underpinned by more resilient, sustainable practices and products, while
growing access to care
Source: March 2022, Investor Day
21
GE HealthCare: 2021 by the numbers
Installed base
4M+
(a- Service, PDx and Digital
(b- FCF conversion*: segment FCF* / segment net income, adjusted to include non-GAAP restructuring expense
Patients served
annually
1B+
FCF
conversion*-b)
>100%
Reported
margins
16.7%
Employees
48K
Businesses with
leading industry
positions
4
Digital apps
200+
Outside U.S.
revenue
55%+
Procedures
per year
2B+
Equipment
Services-a)
$9B
$9B
R&D
~$1B
Countries
served
160
* Non-GAAP Financial Measure
Revenue
~50% services-a)
$18B
Source: March 2022, Investor Day
Highlights over the last year
EXPANDING OUR PLATFORMS
BK Medical Acquisition
Expanding Ultrasound portfolio
with advanced surgical
visualization and navigation
INNOVATING FOR GROWTH
22
Zionexa Acquisition
Enables more targeted treatment
for metastatic breast cancer
patients
SIGNATM Hero
RevolutionTM Apex
Vscan AIRTM
CARESCAPE ONE
Command Center
AMX NavigateTM with
Critical Care Suite 2.0
StarGuideTM
AIRTM Recon DL
Source: March 2022, Investor Day
Convergence of care to deliver precision care
MARKET DRIVERS
• The volume of healthcare data continues to
grow… 50 petabytes​ of data per hospital​, 36% data
growth per year​
• Healthcare systems increasingly seek to merge
clinical medicine with data science
• Need to aggregate and integrate data—imaging,
genomic, and proteomic—for better insights
Imaging, diagnostics,
and genomic data to
customize care plans
DIAGNOSTICS
THERAPY
Right therapeutics
at right time ...
enabled by
diagnostics, imaging,
guidance, and highly
specific data
MONITORING
Enabling mobile
visualization, care-team
collaboration, and clinical
decision support–in real
time
GE HealthCare is at the center of an
ecosystem working toward precision care—better
patient outcomes, productivity, and seamless
workflow integration
23
Source: March 2022, Investor Day
24
Industry leader in $84B global healthcare sector with strong
secular tailwinds
Business
Segments
FY21
Revenue-a)
Ultrasound
$3B
Patient Care Solutions
$3B
Pharmaceutical Diagnostics
$2B
Imaging
$10B
Enterprise Digital Solutions-b)
$1B
Service & Repair-c)
$6B
(a – Healthcare Systems includes Imaging, Ultrasound and Patient Care Solutions (PCS)
(b – Represents total Digital revenue included in HCS Imaging, Ultrasound and Patient Care Solutions figures above.
(c – Service & repair revenue included in HCS Imaging, Ultrasound and Patient Care Solutions figures above
~50% Recurring Revenues
Source: September 2022, Morgan Stanley Healthcare Conference
HealthCare: Long term outlook through the cycle
HealthCare plans to deliver MSD revenue growth*-a) while expanding margin profile
GE REVENUE GROWTH*-a) GE PROFIT MARGIN GE FCF CONVERSION*-b)
High teens
to 20%
100%+
MSD
*Non-GAAP Financial Measure
(a- Organic basis
(b- FCF conversion*: segment FCF* / segment net income, adjusted to include non-GAAP restructuring expense 25
Source: March 2022, Investor Day
Strong, global HealthCare franchise delivering better outcomes for patients and customers
26
HealthCare: Revenue growth
~50% recurring revenues
2022F
 Market growth and positive dynamics
 Need for precision care
 R&D technology investment & innovation
 Therapy and surgery solutions
 Go-to-market and care pathways
* Non-GAAP Financial Measure
Organic Growth 2020 2021
Orders 1% 10%
Revenue* 4% 1%
2023F- a )
MSD*-b)
As of March
Outlook
LSD-MSD*-b)
Updated 2Q’22:
MSD
(a- Pre-spin
(b- Organic basis
Source: March 2022, Investor Day
Updated: 2nd Quarter Earnings, July 2022
Opportunity over time to evolve margin profile and address critical patient needs
25
HealthCare: Margins
 Footprint and portfolio optimization
 Lean enabled productivity
 Pricing discipline / inflation management
 Tuck-in M&A
 Recurring services & software growth
Organic 2020 2021
Margin Expansion* 190bps 70bps
Decentralized operating structure
25-75+ bps
OMX*-b)
$3.0B - $4.0B profit
As of March Outlook
Updated 3Q’22:
$2.6B+ profit
* Non-GAAP Financial Measure
(a- Pre-spin
(b- Organic basis
2022F 2023F- a )
Source: March 2022, Investor Day
Updated: 2nd Quarter Earnings, July 2022
Updated: 3rd Quarter Earnings, October 2022
Enhanced capital allocation & strategic flexibility to enable growth
28
HealthCare: Free cash flow*
 Investment-grade credit rating
 Profitability & ROI focus
 Working capital management
 CAPEX investment for growth
 Disciplined M&A
Ex-BioPharma 2020 2021
FCF*-b) $2.7B $2.7B
FCF Conversion*-b) >100% >100%
Improving operational linearity
Updated 3Q’22:
$2.1B - $2.3B
Up
>100% conversion*-b)
As of March Outlook
(b- FCF* excludes prior period CFOA impact from discontinued factoring programs. FCF conversion*: segment FCF* / segment net income, adjusted to include non-GAAP restructuring expense
* Non-GAAP Financial Measure
(a- Pre-spin
2022F 2023F- a )
Source: March 2022, Investor Day
Updated: 2nd Quarter Earnings, July 2022
Updated: 3rd Quarter Earnings, October 2022
NEUROSURGERY & SPINE GENERAL SURGERY UROLOGY
• Active imaging solutions to provide surgeons with real-time critical
information so that they can deliver faster, more personalized care
• Strategic, highly complementary addition to growing, profitable Ultrasound
business
• Expands GE HealthCare beyond diagnostics into surgical and therapeutic
interventions, as well as minimally invasive & robotic surgery
29
BK Medical: entry into operating room with surgical navigation
Better care. Faster surgeries.
Real-time intraoperative imaging
platform for neurosurgery
Continuous surgical guidance and
advanced visualization
Enhanced care for intervention
Ultrasound meets surgery with real-time surgical visualization
Not all products or features are available in all geographies
Source: March 2022, Investor Day
US & Canada
~$7 billion
7,200 FTs-a)
EMEA
~$5 billion
5,800 FTs
China
~$3 billion
3,400 FTs
Intercontinental
~$3 billion
4,500 FTs
Manufacturing sites
Key R&D locations
2021
GE HEALTHCARE
LOCAL, GLOBALLY
Global sales force >10,000;
1,500 channel partners to
expand our reach; and
8,000 field engineers
INTEGRATED SUPPLY
CHAIN
Strong global commercial
regions with 41
manufacturing sites
delivering quality products
and enabling world-class
customer experience
INNOVATION CLOSE
TO CUSTOMERS
R&D at >20 locations in 8
countries
30
2021 GE HEALTHCARE REVENUE
(a- Field Team
Trusted partner with strong global presence
Includes ~50% services revenue
Source: March 2022, Investor Day
HealthCare: China
ROBUST GROWTH STRATEGIC THEM ES
POSITIONED TO WIN IN CHINA
HIGHLIGHTS
$2.7B 2021 revenue
~7,000 Employees
5 Plants
Imaging, U/S,
LCS & PDx
Leader CT, MI, PET-MR,
U/S, PDx
Manufacturing locally for 30+ Years
Data sources: third party estimates
LOCALLY- MADE
• Agile supply chains meeting local
policy requirement
LOCAL INNOVATION
• Speed to market and meet unmet
needs in China
LOCAL PARTNERSHIP
• Building Precision Care + Digital Eco-
system
31
Source: March 2022, Investor Day
Operating layer
• “Connect once” with operating
layer, on premise or cloud,
single interface, common
viewing tools, secure integration
to data sources including EMR.
Artificial intelligence
engine
• Machine learning tools enable
AI development, orchestration
engine to invoke existing AI
algorithms in clinical workflow
Development platform
• Tools for GE and third-party
developers to accelerate
development of clinical
workflow and AI-enabled apps
Enterprise data optimizer
• Multi-modal data aggregation,
data transformation, and
processing for clinical and
operational insights
Edison™ Digital Health Platform
Designed to enable better patient outcomes, productivity, and seamless workflow integration
1
3 4
2
EDISON
DIGITAL HEALTH
PLATFORM
Flexible, data aggregator
to improve clinical insights,
reduce IT burden and
increase productivity
32
2021 total healthcare digital revenue of ~$1B including Edison Apps, Command Center & Enterprise Digital Solutions
Source: March 2022, Investor Day
33
AIR™ Recon DL
~600
Global
installations
~1,000,000
estimated patients
scanned with AIR™
Recon DL*
>10
Published
journal articles
HOW IT WORKS?
• MR raw data acquisition
complicated ... significant errors
due to noise
• Deep-learning fills in and
corrects raw data quickly and
accurately
AIR™ RECON DL
• Advanced MRI image quality
• Sharp, clear, accurate images provide reliable
diagnosis for clinicians
• Improved MRI experience for patients …
scan time reduction of up to 50%-a)
Conventional
*calculated by IB data with estimation 20 scans per day, 5.5 working day in a week, fully start using AIR™ Recon DL 4 weeks after
delivery. (as of Jan 2022)
Not all products or features are available in all geographies
(a – GE HealthCare data on file
Source: March 2022, Investor Day
GE HealthCare Command Center
REAL-TIME INSIGHT MAKES CARE
MORE EFFICIENT
• Real-time patient overview & predictive suggestions
• Up to 500K messages a day in typical setting
• 300+ hospitals globally
• Reduced length of stay-a)
• Increase bed & OR utilization-a)
• Reduced code blues-a)
• $40M efficiency savings over ~1 year-b)
Credit: AdventHealth Mission Control, Orlando, FL
34
(a-
(b-
data from hospitals including Johns Hopkins, Tampa General, OHSU, Humber
Tampa General Press Release, https://www.tgh.org/news/tgh-press-releases/2020/october/tampa-general-hospital-and-ge-healthcares-carecomm-saves-40-million-cuts-20000-excess-days-and
Source: March 2022, Investor Day
Summary
• Global franchise driving precision care innovation to address critical
patient/clinical challenges
• Driving operational performance using lean leading to higher growth, continued
margin expansion and FCF* generation
• Spin-off: excellent opportunity to optimize organization for speed and agility,
building faster growth profile through portfolio focus and M&A
35
*Non-GAAP Financial Measure
Source: March 2022, Investor Day
GE Vernova
Vernova: Key messages
37
POWER ON TRACK FOR STABLE EARNINGS AND CASH GENERATION
• Completing Gas turnaround … steady demand & services growth, lean taking hold
• Steam strategic pivot on track … primarily services go-forward
RENEWABLE PORTFOLIO POSITIONED FOR GROWTH; FOCUSED ON
RUNNING THE BUSINESSES BETTER
• Resetting underwriting perimeter and cost-structure for Onshore Wind … while scaling lean
• Focus on Haliade-X execution
• Serving grid modernization needs … operational improvements and investing for growth
CREATING CAPACITY TO INVEST AND INNOVATE FOR GROWTH AND
DECARBONIZATION
• This decade of action: Haliade-X, Opus One, HAs, Aero
• Future decades at scale: SMR, CCUS, H2
Charles McKinney, Assembler, Greenville SC
stands in front of a 7HA gas turbine
Source: March 2022, Investor Day
38
• Electricity generation growing ~50% by 2040
• ~13 gigatons of carbon emitted by the Power sector
• ~800 million people without access to electricity
• $10-15 trillion investment required over ten years-a)
(a – IEA World Energy Investment 2021 Electricity Sector Investment … STEPS ‘21-’25 + SDS to NZE ‘26-’30
The opportunity to grow and decarbonize the energy sector is
large … solving for sustainability, reliability, and affordability
Excited to integrate the
world’s most diverse
power, renewable, and
digital portfolio together to
solve the energy trilemma
Source: March 2022, Investor Day
39
Vernova: 2021 by the numbers
Wind turbines
installed in more
than 35 countries
52K
220m
World’s electricity
generated with
the help of our
technology
1/3
Backlog-a)
$106B
World records
held for
combined cycle
efficiency
2
R&D
investment
~$1B
Employees-a)
70K
Global T&D
utilities served by
our software
30%
EFS-enabled
orders
$7B
Gas turbines
installed…
world’s largest
fleet
7K
Revenue-a)
~44% services
Equipment
Services
$18B
$14B
Haliade-X rotor
size
Position in U.S.
wind installs-b)
#1
(a – Power and Renewable Energy, excluding Digital and EFS
(b – Source: American Clean Power Association
$33B
Source: March 2022, Investor Day
Vernova: Highlights over the last year
40
Dogger Bank C Haliade-X
Ocean Wind Haliade-X
Pattern Energy 2 MW turbines
Invenergy 2 MW turbines
Pulau Indah 9HA GT
Guangdong 9HA GT H2 blended
Tongyeong 7HA GT
Aero LM2500Xpress in Colorado
225 kV substation in Senegal
HA fleet 1M hours
Haliade-X prototype at 14MW
1st HA repair at Singapore facility
Grid Digital ADMS release
Opus One acquisition
Agreement to sell part of Steam
Power’s Nuclear activities
LEADING THE ENERGY TRANSITION
HYDROGEN
RENEWABLES
CCUS
NUCLEAR
GRID
DIGITAL
SF6-free switchgear
in Norway
DOE awards $5.7M
FEED study
AI enabled Autonomous
Tuning to reduce CO2
BWRX-300 SMR
selected for OPG
Australia’s first gas
and hydrogen plant
Blade recycling
agreement established
Fleet & Portfolio Milestones
Key Commercial Wins
Source: March 2022, Investor Day
Global sectors
Energy sectors where we operate
Grid T&D hardware
and software
Gas, Steam,
Nuclear, Hydro
Onshore and
Offshore
Stable baseload; zero-carbon
pathways for gas (H2, CCUS)
Electricity growth with zero-
carbon; policy and capital
Modernization of the
grid, remote grid play
GE ‘21 revenue, % services-b)
~$17B, ~70% ~$12B, ~15% ~$5B-c), ~20%
Sector CAGR ’21 - ’30-a)
LSD HSD MSD/HSD
Sector size ’21-a) ~$100B ~$70B ~$60B
(a – GE Estimate of Served Available Segment, Capex and services
(b – GE revenue represents best approximate sector view & does not include eliminations
(c- Including Power Conversion and GE Digital - Grid Software revenue
ELECTRIFICATION
CONVENTIONAL POWER WIND
Leading position in ~$230B global energy sector where we operate… complementary portfolio of GE
technology to grow & lead energy transition
41
Source: March 2022, Investor Day
42
Vernova: Long-term outlook through the cycle
Stable margins, strong FCF* from Power funding profitable growth in Renewables and Digital
GE REVENUE GROWTH*-a) GE PROFIT MARGIN GE FCF CONVERSION*-b)
HSD 80-90%
LSD
*Non-GAAP Financial Measure
(a- Organic basis
(b- FCF conversion*: segment FCF* / segment net income, adjusted to include non-GAAP restructuring expense
Source: March 2022, Investor Day
Power financials
Organic
revenue
growth*
Free cash
flow*-b)
2021 2022F 2023F
KEY DRIVERS
*Non-GAAP Financial Measure
(a- Organic basis
(b- FCF* excludes prior period CFOA impact from discontinued factoring programs. FCF conversion*: segment FCF* / segment net income, adjusted to include non-GAAP restructuring expense
On path to HSD margin, $1-2B profit in ’23 … stable, reliable cash growth from earnings
LSD
$16.9B,
(4)%
$1.2B
Op margin,
Op profit
4.3%,
$0.7B
HSD,
$1-2B
Up,
$1.0-1.2B
Up,
> 150%
conversion
Up,
> 100%
conversion
LSD
 Gas Power: Revenue up LSD*-a) with DD margins
by ’23 … services installed base, aero growth, lean
 Steam Power: Transforming to services focused
business … $1B+ revenue, DD margins by ’24
 Power Conversion: HSD*-a) revenue growth, MSD
margins in ‘22
 Nuclear: Stable topline, investing in SMR
 FCF* driven by earnings growth in all business,
lower steam coal-exit impact, and working capital
improvements (Inventory, Contract assets)
43
Source: March 2022, Investor Day
As of March Outlook
As of March Outlook
As of March Outlook
Updated: 2nd Quarter Earnings, July 2022
0.0
0.5
1.0
1.5
2.0
2.5
'19 '20 '21 22 '23
Gas Power: Installed base foundation
• Demand growth supporting REN
penetration increase
• ‘21 orders > $1B … deliveries
ramping from ‘22 onwards
AERO EQUIPMENT
• 134 units ordered; 66 COD, most
units running baseload … services
billings ~$1B/yr by mid-’20s
• Major outages ~4 yrs. post COD,
billings stream growing w/ hours
HAs
• Expect LSD growth in global gas-
based generation electricity
• Strong GE fleet utilization …
MWhrs growth outpacing market
INSTALLED BASE
-12%
-7%
-2%
3%
8%
3Q'20 4Q'20 1Q'21 2Q'21 3Q'21 4Q'21
GE MWhrs utilization … quarterly y/y
Gas-generation demand … quarterly y/y
0
20
40
60
'20 '21 '22 '23+
Aero unit shipments
Aero unit shipments projected
HA operating hours (MM)
HA operating hours projected (MM)
7,000+ GTs … almost double the nearest peer installed base … service, HA & Aero opportunities ahead
44
Source: March 2022, Investor Day
45
Gas Power: Carbon Solutions
CARBON CAPTURE & STORAGE (CCS)
• Clear role of CCUS in the energy transition
• US has existing CO2 pipelines, developing pricing
mechanisms, $12B funding passed in ‘21 Infra act
• GE well positioned in this developing segment:
• Largest IB … strong systems integration experience
• Meaningful R&D and Intellectual property
• Key FEED studies: US DOE with Linde 7Fs, UK BP
and Net Zero Teesside 9HA with Technip
• Middle East alliances … blue H2, ammonia
GE’s installed base, alliances, research and experience are key to meaningful climate impact
7
H
A
7F
7F
7HA
7F 7HA
7HA
7HA
LM6
7F
7E
Gas Turbine w/ CCS Direct Air Capture Gas Turbine w/ H2
Source: US Department of Energy, National Energy Technology Laboratory
Source: March 2022, Investor Day
• Gas turbine technology capable of H2 fuel combustion
• Economics and availability are the challenges to be
overcome for H2 use at scale today
• Increasing customer requirements for GE solutions:
• 8MM hours with H2 and H2-like fuels on 100+ GTs
• Investing for 100% H2 by 2030 for new-unit
customers, and retrofit/upgrades for installed base
• Multiple new H2 projects w/ different GTs last 2 years
46
Gas Power: Hydrogen pathways
HYDROGEN (H2)
Cricket Valley will undertake a demonstration project, starting in late 2022, by running
a 7F.05 turbines on a blend of natural gas with 5% “green hydrogen” by volume
Customers planning and engaged now … GE roadmap for 100% H2 … ready for when fuel economics scale
Source: March 2022, Investor Day
Renewable Energy
48
Renewable Energy: Focus areas
• Customer conviction to invest … onshore wind will recover
… offshore, grid further acceleration in 2H of decade
• Our teams exhibit great passion for technology, but can
prioritize for better results
• Heavier equipment mix business today, must size
accordingly with premium on pricing and execution
IN ITIA L O B SERVATIO N S
• Simplify organization structure and reduce costs-a)
• Accelerate underwriting selectivity, pricing actions
• Focus on services growth where we can achieve scale
• Industrialize maturing supply chains
• Standardize lean across businesses … SQDC
K EY A R EA S O F FO C U S
Strong medium-term potential, focusing on prioritization and what we can control
(a- no plans shall be finalized and/or implemented until the completion of appropriate engagement with works councils and/or other employee representatives as required in accordance with local law
Source: March 2022, Investor Day
Renewable Energy financials Initiated on March 10, 2022
49
Organic
revenue
growth*
Free cash
flow*-b)
2021 2022F 2023F
KEY DRIVERS
(b- FCF* excludes prior period CFOA impact from discontinued factoring programs. FCF conversion*: segment FCF* / segment net income, adjusted to include non-GAAP restructuring expense
Resetting the business for profitability and cash generation in ‘24
LSD
Better but
negative
Op margin,
Op profit
$15.7B,
(2)%
$(1.2)B
(5.1)%,
$(0.8)B
Updated 3Q:
~$(2)B
Approaching
breakeven
MSD
Approaching
breakeven
 Onshore Wind: Int’l selectivity & cost out tailwinds,
NAM near term volume pressure
 Offshore Wind: Ramping to ~$3B revenue by ’24 and
profitability by mid-20’s … managing inflation
headwinds
 Grid: MSD revenue growth-a)*, significant profit
improvement ’22; breakeven in ’23
 FCF* driven by normalized progress as NAM markets
stabilize and earnings improvement
Updated 1Q: below
previous range
Updated 2Q: below
prior year with
additional pressure
As of March Outlook
As of March Outlook
As of March Outlook
Source: March 2022, Investor Day
Updated: 2nd Quarter Earnings, July 2022
Updated: 3rd Quarter Earnings, October 2022
50
113
171
2021 2025F 2027F
50
Offshore Wind
INDUSTRY DYNAMICS PRIORITIES
• Successful launch of Haliade-X:
• Prototype operating for 28 months
• First COD in mid-’23 … ongoing certification testing
towards higher rating and serial production readiness
• Manage cost, risk profile: localization, modularization
• ~50 GW offshore capacity to grow at > 20% CAGR
GW capacity scheduled & planned
Source: WoodMac
• Continue to accelerate growth:
• ~$7B backlog today … shipping until mid-’25
• ~$120B+ industry pipeline from ‘23-’30
~3x in
6 years
Building towards ~$3B revenue business by ’24 and profitable in the mid-20’s
• Investing in super-conducting generator:
• Increase output, lower cost … reducing weight, rare-
earth material risk; prototype in ‘23, US DOE backed
• Significant MW growth of latest NPI’s … inflation
pressures on raw materials
Source: March 2022, Investor Day
Updated: 3rd Quarter Earnings, October 2022
-
5
10
15
20
'08 '09 '10 '11 '12 '13 '14 '15 '16 '17 '18 '19 '20 '21 '22F
Onshore Wind
• Long-term demand intact … ~50 GW by mid-decade
• EU commitments and Renewable Energy 100
• U.S. planning ~10 GW installs in ’22 and stabilizing
INDUSTRY AND BUSINESS DYNAMICS PRIORITIES
• NAM: Strengthening the core
• New product innovation for medium-term opportunities
• Driving price … DD% price in 4Q’21 NAM bids
• Lean focus … logistics, installation and commissioning
• Right-sizing cost-structure-c)
• International: Selectivity to build profitable backlog
• Strategic countries, defined strike-zone
• DD% price in 4Q’21 int’l bids with inflation escalation
• Lean focus … reduce waste, improve cost, execution
• Services: DD profitable growth … 1,000+ turbines/year
eligible for repower; digital solutions
• NAM business: Well positioned and profitable today, near-
term policy uncertainty, mid-term demand visibility strong
Onshore Wind U.S. installations (GW)-b)
Production Tax Credit Extension
51
(a- excluding China
(b- source: Woodmac to ‘21, ‘22 GE forecast
(c- no plans shall be finalized and/or implemented until the completion of appropriate engagement with works councils and/or other employee representatives as required in accordance with local law
Managing market conditions, while running the business better … path to profitability in ‘24
• International business: Growing demand, challenged
profitability and heavy cost structure
F
Source: March 2022, Investor Day
Updated: 3rd Quarter Earnings, October 2022
52
Onshore Wind: Lean focus
SAFETY Implemented Hierarchy of
Controls standard work
DELIVERY ↓ 40% Cypress installation
time with standard work
QUALITY Tiger teams + lean … 25%
faster issues resolution
– Integrating field feedback into design
and supply chain
COST transforming outbound logistics
… eliminate 20% leakage
Applying lean to drive operational improvement
Source: March 2022, Investor Day
53
Electrification sectors we operate in
GE ‘21 revenue-b)
HSD MSD
~$8B ~$5B
~$0.6B ~$0.6B
Products
Control &
Automation
Relays, Gateways
GIS & Network model,
ADMS, EMS
Sector CAGR ’21 - ’30-a)
Sector ’21-a)
HSD MSD
~$17B ~$25B
~$1.2B ~$1.5B
Switchgear,
Transformers
HVDC,
Substations
MSD
~$6B
~$1B
Rotating machines,
Power electronics
(a – GE Estimate of Served Available Segment, Capex and Services
(b- GE revenue represents best approximate sector view & does not include eliminations
(c – Reported in the Power segment today
(d – Reported in Corporate/Digital today
Complementary businesses … focused on running better to capture industry demand
Grid
automation
Grid
Software-d)
Grid integrated
solutions
Grid Power
transmission
Power
Conversion-c)
Source: March 2022, Investor Day
54
Electrification: Scaling our businesses for profitable growth
• Unique value by combining digital and
hardware solutions
• Investing in digital substations and
renewables integration
• Software for grid orchestration and
asset management
• Strategic bolt-on … Opus One
• Targeting to grow > sector growth
o Grid Automation growth accelerating …
orders up MSD-a) in ‘21 & HSD-a) 2H’21
POSITIONING TO GROW
GRID AUTOMATION AND
SOFTWARE
• Scaling Power Conversion play
• Improving project execution
performance of legacy projects
• Selective growth … disciplined
underwriting, services focus
• Opportunity to reduce product &
structural cost-c) to improve
competitiveness
TURNING AROUND GRID
INTEGRATED SOLUTIONS &
POWER TRANSMISSION
• Inflection point reached in 2021
… stabilized operations
• Driving growth: 3-prong approach
… win/loss, NPIs, breakthroughs
POWER CONVERSION-b)
TURNAROUND
ACCELERATING
$0.9 $0.8
$1.0
2019 2020 2021 2022F
HSD
MSD%
Sales
(18)% 2%
(13)%
Op
Profit %
Driving turnarounds and investing for growth
*Non-GAAP Financial Measure
(a – Organic basis
(b – reported in the Power segment today
(c – no plans shall be finalized and/or implemented until the completion of appropriate engagement with works councils and/or other employee representatives as required in accordance with local law
Source: March 2022, Investor Day
7%
10%
83%
58%
12%
30%
Energy transition: Markets in focus
CANADA
ASIA
Electricity
demand today
12,700 TWh/y 650 TWh/y
7.7 Gigatons 0.1 Gigatons
Power sector carbon
emissions today
zero-carbon
gas
coal/oil
Nearly two-thirds of
global power sector CO2
* IHS “inflections” scenario (their baseline outlook)
Less than 1% of
global power sector CO2
27,500 TWh/y 910 TWh/y
Electricity demand in
’50*
More than double
today’s demand
40% above
today’s demand
55
Asia … Decade of action to decarbonize while demand doubles
Canada … Investing in breakthroughs for last ~15% to net-zero carbon
Source: March 2022, Investor Day
56
Vernova: Wrap
• The opportunity to grow & decarbonize the energy sector is
large … solving for sustainability, reliability, and affordability
• GE Power is on track … confident in our ability improve
Renewables & Digital with the scaling of lean
• Investing for long term with complete conviction in leading the
energy transition … this decade and the decades that follow
3.6MW turbine - Markbygden Wind Farm Piteå,
Norrbotten county N. Sweden
Source: March 2022, Investor Day
GE Aerospace
GE Aerospace: Key messages
58
EXCEPTIONAL BUSINESS IN ATTRACTIVE COMMERCIAL AND
MILITARY SECTORS
• Strong, underlying equipment and services volume growth as market recovers
• Focused portfolio with strong positions across businesses
EMBRACING LEAN AND TECHNOLOGY TO DRIVE
OPERATIONAL PERFORMANCE AND SERVICES GROWTH
• Enterprise focus on safety, quality, delivery, and cost
• Deploying technology to improve customer outcomes and reduce costs
INVESTING IN SUSTAINABLE TECHNOLOGIES TO ENABLE THE
FUTURE OF FLIGHT
• Leveraging unique technology portfolio in existing products (CMC, additive)
• Investing in breakthrough technologies (SAF, XA100, hybrid electric, hydrogen, open fan)
GE Aerospace employee performs overhaul maintenance on a GE90 engine
at the GE Celma Overhaul Facility in Brazil.
Source: March 2022, Investor Day
59
GE Aerospace: 2021 by the numbers
People flying at any
given time on GE or
JV-a) powered aircraft
~400K
Reported
margins
13.5%
Commercial-b) &
Military engines
delivered
2K+
88%
12%
A GE or JV-a)
powered aircraft
takes off
2
seconds
Every
Free cash
flow*
$4.6B
Passengers
carried
1.5B Increase in shop
visits
10%
Total backlog
$300B+
Revenue
~65% Services
$21B
Commercial &
Military engines
in service
~66K
Commercial fleet
with one or less
shop visits
Commercial flights
powered by GE or
JV-a) engines
$8B
$14B
Services
Equipment
3
out of
4
60%
*Non-GAAP Financial Measure; FCF* excludes prior period CFOA impact from discontinued factoring programs
(a – includes equipment made by CFM and Engine Alliance joint ventures
(b – includes 900+ CFM/LEAP engines delivered by GE and Safran
CFM is a 50/50 Joint Venture between GE and Safran Aircraft Engines; Engine Alliance is a 50/50 JV between GE and Pratt & Whitney
Source: March 2022, Investor Day
Highlights over the last year
$300B+ backlog
(as of Dec 31st, 2021)
OUR PORTFOLIO
Commercial OE & Services wins
Qatar GE9X – 777-8F
Singapore GE9X
Indigo LEAP-1A
Akasa LEAP-1B
Allegiant LEAP-1B
Southwest LEAP-1B
UPS & FedEx CF6
Military achievements
F110 for F-15EX
T700 services
T408 demonstrator
OUR FUTURE OF FLIGHT
CFM RISETM
XA100 testing
Hydrogen
Hybrid Electric
60
100% SAF flight-a)
(a –100% sustainable aviation fuel on supplying one LEAP-1B engine
CFM is a 50/50 Joint Venture between GE and Safran Aircraft Engines. RISE is a registered trademark of CFM.
Source: March 2022, Investor Day
Sector size ’21-a)
Sector CAGR ’21 - ’25-a)
~$40B ~$15B
~$15B
High-teens HSD
LSD
61
Focused portfolio across large, growing businesses
COMMERCIAL PROPULSION M ILITARY PROPULSION SYSTEMS
Customer needs
Demand drivers
GE Aerospace ’21 revenue
% services
$14.4B
>60%
$1.6B
~50%
$4.1B
>70%
• Equipment ramp readiness
• Services capacity & material solutions
• Lower carbon solutions
• Fleet modernization
• Faster development cycles
• Aircraft electrification
• Increased autonomy
• Fleet renewal and expansion
• Post-COVID return to travel
• Strong US and int’l demand
• New technology development
• Increased aircraft production
• Next-gen systems technologies
(a- Source: GE industry estimates; Systems defined as electrical systems, avionics, and mechanical systems; Commercial Engines definition excludes turboprops
Source: March 2022, Investor Day
62
Strength in diverse commercial equipment installed base
GE and JV-d) engines in operation with …
(a-Source: Cirium Dec 31, 2021. Includes in-service and parked aircraft.
(b-GE Aerospace estimate of total fleet growth including competitors
(c- Widebody includes 508 Engine Alliance and 308 CFM engines
(d- includes equipment made by CFM and Engine Alliance joint ventures
CFM is a 50/50 JV between GE and Safran Aircraft Engines; Engine Alliance is a 50/50 JV between GE and PW
WIDEBODIES-c)
Sole-source
777, 747-8
Dual-source
747, 767, 787,
A300, A330,
A380
REGIONAL JETS
Sole-source
ARJ21
CRJ
E170/190
Others
Global fleet
distribution
(# of engines)-a)
NARROWBODIES
Dual-source
A320ceo,
A320neo
families
89%
Global lessors
73%
Global airlines
74%
Widebody freighters
Leading positions for decades of continued new unit growth
Sole-source
737
Classics
737 NG
737 MAX
‘22–’32 fleet
CAGR-b) MSD Flat
MSD
Source: March 2022, Investor Day
63
Commercial recovery driving services growth
GE / CFM DEPARTURES
(% of ’19 levels-a))
• Departure recovery driving ’22 shop visits up high-teens &
organic services revenue growth* more than 25%
• Strong utilization drives billings and cash higher
WHAT IT MEANS FOR GE
• Expect narrowbody traffic to recover later in ’23,
widebody passenger by late ‘23
• Slow start in ‘22 due to Omicron … expect momentum
to pick up based on customer confidence
TOTAL DEPARTURES
0
20
40
60
80
100
120
140
Widebody
(Passenger)
Narrowbody
Total
Widebody (Freight)
’20 ’21 ’22F ’23F ’24F
%
Actuals
Feb ’22
forecast
*Non-GAAP Financial Measure
(a- GE internal forecast as of February 2022
CFM is a 50/50 Joint Venture between GE and Safran Aircraft Engines
63
Source: March 2022, Investor Day
Updated: 2nd Quarter Earnings, July 2022
Updated: 3rd Quarter Earnings, October 2022
64
Systems: complements core businesses
Flight management, open
computing, displays, health
and data monitoring
Component supplier (electrical,
mechanical, sensors)
Focused on high-power civil &
military turboprop applications
Generation, distribution,
conversion, and control of
aircraft electrical power
Expand civil & high voltage
applications; airframe &
propulsive electrification
Autonomy and future
platforms; AI & mission
computing starting in military
Developing ignition & sensor
solutions for more sustainable
aviation
Next-gen commercial turbo-
props; technology applied to
CFM RISETM program
T
O
D
A
Y
F
U
T
U
R
E
Key technologies playing a central role to the future of flight
ELECTRICAL POWER AVIONICS UNISON DOWTY PROPELLERS
M
A
I
N
P
L
A
T
F
O
R
M
S
F-35
F-18
AH64
777
Large
biz jets
737
777X
A320
C919
F-16
F-18
F-35
All major engine OEMs C-130J
Saab 340
Dash 8/Q
CFM is a 50/50 Joint Venture between GE and Safran Aircraft Engines. RISE is a registered trademark of CFM.
Source: March 2022, Investor Day
65
Military business positioned for growth through ’25
CONTINUING TO WIN
ON CORE PLATFORMS
HSD TOPLINE GROWTH
THROUGH ‘25
US DoD
• F110 … US Air Force F-15EX
• F404 … US Air Force T-7A
• LM2500 … Constellation class frigate
Key focus areas in 2022
• Improve supply chain delivery
supported by lean
• Intense focus on developing next
generation technologies
DEVELOPING NEXT
GENERATION PRODUCTS
Combat
• XA100 … F-35 re-engine opportunity
• Prototype in testing with US Air Force
Rotorcraft
• T901 … Apache & Black Hawk re-engine
• T901 … Future vertical lift
• T408 … US Marines CH-53K heavy lift
=
CAGR ‘20-’25
HSD revenue growth*-a)
2020 2021 2022F 2025F
$4.6B $4.1B
International
• F414 … Korea KF-21
• F404 … India MkII Tejas
• US equipment to allies
Strong demand in a growing sector … focused on execution
CFM is a 50/50 Joint Venture between GE and Safran Aircraft Engines
*Non-GAAP Financial Measure
(a- Organic basis
Source: March 2022, Investor Day
Aerospace financials
66
Op margin,
Op profit
Organic
revenue
growth*
Free cash
flow*-b)
13.5%,
$2.9B
$21.3B,
(3)%
$4.6B
2021
Updated 3Q:
high-teens
>20%
Implied 3Q:
flat to slightly
better
2022F
High-teens,
~$6B
>20%
2023F
Up, 90%+
conversion
KEY DRIVERS
*Non-GAAP Financial Measure
(a- Organic basis
(b- FCF* excludes prior period CFOA impact from discontinued factoring programs. FCF conversion*: segment FCF* / segment net income, adjusted to include non-GAAP restructuring expense
 Topline growth as recovery momentum continues …
unprecedented demand ramp in OE & services with
>25% high teens shop visit & organic revenue
growth* in ‘22
 Military recovery & growth on demand strength
 Cost productivity through lean & improving LEAP
learning curve while navigating negative mix
 Improving working capital management &
disciplined capital allocation
 ’22 FCF* driven by profitable growth but impacted
by allowance payment timing … growing back to
greater than ’19 levels in ’23
Significant growth & margin expansion driving FCF* as recovery momentum continues
Source: March 2022, Investor Day
As of March Outlook
As of March Outlook
As of March Outlook
Updated: 2nd Quarter Earnings, July 2022
Updated: 3rd Quarter Earnings, October 2022
67
Aerospace: Long-term outlook through the cycle
Positioned to win as commercial aftermarket recovers & military grows
GE REVENUE GROWTH*-a) GE PROFIT MARGIN GE FCF CONVERSION*-b)
High teens
to 20%+
90%+
MSD
(higher near term)
*Non-GAAP Financial Measure
(a- Organic basis
(b- FCF conversion*: segment FCF* / segment net income, adjusted to include non-GAAP restructuring expense
Source: March 2022, Investor Day
Aerospace’s next era building on a decade of product renewals
CF6
CFM56
GE90
CF34
Regional workhorse
Legacy Next generation Future of flight
GEnx
15% better fuel
efficiency vs. CF6
LEAP
15% better fuel
efficiency vs. CFM56
GE9X
10% better fuel
efficiency vs GE90
Passport
17%+ better fuel
efficiency vs. CF34-3
CFM RISETM
>20% efficiency
vs. today’s engines
Hydrogen
demonstrator
Hybrid-electric
demonstrator
(1980s to 2050s) (2010s to 2070s) (2030s to 2090+)
68
Source: March 2022, Investor Day
2019 2020 2021 2022F 2023F 2024F 2025F
LEAP CFM56
69
Commercial equipment
PRODUCTION RAMP POST-COVID
# o f L E AP & C F M 5 6 S h i p m e n t s
LEAP NEW ENGINE PRODUCT COST
Av e r a g e c o s t p e r u n i t
• Ready for ramp … hard capacity in place, building back skilled
labor, partnering with supply base
• Aligned with airframers on production rates through ‘23
• Commercial equipment revenue growth*-a) 20%+ trending below
20% in ’22
• Improving productivity post COVID slowdown
• ~(3) pts Aerospace margin impact in ’22 & ’23 driven by
CFM56/LEAP transition … improvement as approach op margin
breakeven in ’25
• 9X volume and mix meaningful post 777X entry into service
Production ramp to support customers and driving revenue growth
~2,000
2,000+
845
815
2,000+
1,736
1st unit ’25F
Breakeven no
later than ‘25
44%
cost out
(’16-’21)
CFM is a 50/50 Joint Venture between GE and Safran Aircraft Engines
’21
*Non-GAAP Financial Measure
(a- Organic basis
Source: March 2022, Investor Day
Updated: 2nd Quarter Earnings, July 2022
'19 '20 '21 '22F '23F '24F '25F
70
Commercial services shop visit growth through the decade
Significant volume driving revenue and profit growth
Regional aircraft
(CF34 variants)
Narrowbody aircraft
(CFM56 variants)
LEAP
Widebody aircraft
(GEnx, GE90, CF6, GP)
~5.4k
0
’25+ Growth
# SV
SHOP VISITS GROWING >25% HIGH TEENS
IN ’22 BASED ON AIRCRAFT USAGE
Driving lean to create capacity, improve
operational performance
• 20% turnaround time reduction in Celma,
Brazil overhaul shop
• Transitioned 550+ repairs to overhaul shops
improving on time delivery and logistics costs
Unique open GE and external MRO footprint
READY FOR GROWTH
• 80+ locations-a) available to service
worldwide shop visit demand
• Open network encourages investments …
increasing flexibility for operators
(a- includes 6 GE overhaul facilities
CFM is a 50/50 Joint Venture between GE and Safran Aircraft Engines
Source: March 2022, Investor Day
Updated: 2nd Quarter Earnings, July 2022
71
Aftermarket services through the engine lifecycle
Source: Cirium, Dec 31, 2021. Excludes aircraft in storage.
(a- Includes CFM engines
Delivering flexible material solutions to keep the fleet flying longer
~50% of CFM56 engines
have not seen 1st SV
No SV
1 SV
2+ SV
CFM56 SVs peak
later in the decade
~19,100 CFM56
engines in service-a)
CFM56 ENGINES
Typical narrowbody shop visit content
SV1 SV2 SV3
Workscope flexibility
Typical widebody shop visit content
SV1 SV2 SV3
No SV
1 SV
2+ SV
~60% of widebody engines
have not seen SV2
Expecting MSD SV
growth through 2025
WIDEBODY ENGINES
Industrializing repairs
• ~13,000 repairs in the
catalog today
• Developing +500 more
repairs annually
ENABLING WORKSCOPE
FLEXIBILITY
~6,500 total widebody
engines in service-a)
Material solutions
• Largest USM provider
• 20+ years experience
Average content
CFM is a 50/50 Joint Venture between GE and Safran Aircraft Engines
Source: March 2022, Investor Day
Combining lean with technology to drive service productivity
CFM is a 50/50 Joint Venture between GE and Safran Aircraft Engines
ON-WING
TECHNOLOGY
AI ENABLED
INSPECTIONS
ADDITIVE
REPAIR
>50%
Cycle time reduction
~10,000
Field applications by 2025
~80%
Cycle time reduction
CUSTOMER
BENEFITS
Accelerate component
workflow through the
shop with digital & lean
Keep engines on-
wing longer
Enable high speed
precision repair
Helping operators improve fleet utilization through faster turnaround time
CFM HPC blade
72
360 Foam Wash
Blade Tip Repair
Source: March 2022, Investor Day
73
Commercial Services revenue trajectory
$9B
2021 2023F
2022F
• Revenue outpacing shop visit volume
• Volume key driver … shop visit growth
>25% of high-teens in ’22, strength in
’23 with growth across all product lines
• Catalog price evolution consistent with
recent history
• Content increases in ’23 as engines
progress through lifecycle … widebody
volume driving higher revenue/SV
• Widebody ~40% & narrowbody ~50%
of total services revenue in ’22 & ’23
GROWTH DRIVERS
$8B
2020
>25%*-a)
Supporting demand through lean & technology productivity
Growth in volume, price, content/mix
$15B
2019
*Non-GAAP Financial Measure
(a- Organic basis
Source: March 2022, Investor Day
Updated: 2nd Quarter Earnings, July 2022
74
ADVANCED
AERODYNAMICS
Lighter, thinner composite fan blades
improve efficiencies
Innovation is in our product DNA
CERAMIC MATRIX
COMPOSITES
Lighter & increased durability through
higher heat resistance than alloys
MANUFACTURING
TECHNOLOGIES
Additive simplifies architecture, reduces
weight & improves fuel efficiency
GE90-94B
composite fan blade
introduced 1995
GE9X composite fan
blade certified 2020 Combustor
Additive Catalyst
engine inlet frame
New generation of more fuel-efficient aircraft engines in every thrust class made possible
by breakthrough technologies and materials
CFM is a 50/50 Joint Venture between GE and Safran Aircraft Engines. RISE is a registered trademark of CFM.
Source: March 2022, Investor Day
75
ELECTRIFICATION
• 1st MW hybrid-electric system
demonstrated at altitude
conditions-a)
• Development partnership with
NASA and Boeing
Breakthrough technology demonstrators
ALTERNATIVE FUELS
• Partnership with Airbus to flight
test hydrogen-powered engine
• Sustainable Aviation Fuel
compatibility and advocacy
Ground & flight tests to show technology readiness this decade
CFM is a 50/50 Joint Venture between GE and Safran Aircraft Engines. RISE is a registered trademark of CFM.
(a- Altitude conditions up to 36,000 feet
ADVANCED ARCHITECTURE
• CFM RISETM: Open fan,
compact core, hybrid-electric
technology
• Greater than 20% fuel efficiency
vs. today’s engines
ADAPTIVE CYCLE
• Best of both worlds … switching
between high thrust and efficiency
• 10% more thrust and 25% better
fuel efficiency vs. today’s engines
Source: March 2022, Investor Day
Summary
76
• Exceptional business in attractive commercial and
military sectors
• Embracing lean and technology to drive operational
performance & services growth
• Investing in sustainable technologies to enable the
future of flight
World-leading business … executing on unprecedented ramps
GE flying testbed with GE9X engine
Source: March 2022, Investor Day
GE Financials
GE’s financial priorities
Disciplined capital allocation
• CapEx & M&A processes (AerCap, BK Medical)
Balance sheet improvements
• Reduced gross debt by $87B over 3 years
• W/C management & factoring discontinuation
• Improved linearity ... reduced peak cash needs
• Generated nearly $6B of Industrial FCF*-a) in ‘21
Driving sustainable, high quality earnings & FCF* growth
Structural improvements
• Daily management
• Lean monthly close
• Nearly 30 operational P&Ls
• Commercial & M&A underwriting
• Simplified reporting
* Non-GAAP Financial Measure
(a- Excludes prior period CFOA impact from discontinued factoring programs of $(0.7)B
78
Cash flow grow th
• Working capital & CapEx efficiency
• 100%+ FCF conversion*
Profit grow th
• Productivity & restructuring
• Commercial selectivity
• Price/cost
Revenue growth
• Commercial execution, services strength
• NPIs, technology breakthroughs
SUBSTANTIAL PROGRESS FOCUS AREAS
1
2
3
4
Source: March 2022, Investor Day
79
… driven by profitable volume growth in 2022 Updated 1Q:
trending to low end
Equipment Services
• All businesses growing ...
Aerospace recovery continues
• Backlog strength from ‘21
orders... ~ of revenue in hand
• Services growth outpaces
equipment ... mix headwind
from NPIs (LEAP, HAL-X)
• Managing supply constraints
HSD organic growth* supported by market fundamentals with ~2/3 backlog in hand
2022 DYNAMICS
* Non-GAAP Financial Measure
2021
Adj.
revenue*
$71B
$34B
$37B
2022F
Adj.
revenue*
~$76B
~$36B
~$40B
Aerospace
Commercial
Services
NPIs
(Aerospace CEO,
Renewables
OFW)
Gas Power
Services
HealthCare Aerospace
Military
Source: March 2022, Investor Day
80
Targeting ~$2B gross cost out in ‘22 through productivity, restructuring & sourcing actions
~$68B-a)
adjusted
cost
Direct
material
SG&A +
R&D
~$29B
~$25B
$14B
Labor &
overhead
Cost of sales
(a- 2021 actuals, cost excluding NCI and EFS benefit from taxes
(b- Some plans may be subject to the outcome of legally mandated information & consulation with employee representatives
Direct material
• Sourcing actions: Best cost, nearshore & dual sources
• Value analysis & value engineering of components …
should-cost deployment
Labor & overhead-b)
• Standard work & waste removal to drive outage/cycles
efficiency & factory rationalization
• Product reliability with systematic root-cause analysis …
focus on suppliers’ quality and design for durability
Operating expense-b)
• Organizational streamlining, decentralization
• Strategic refocusing
ACTIONS WE’RE TAKING TO DRIVE COST OUT
Cost out
Source: June 2022, Bernstein SDC
Creating three global, investment-grade companies positioned to drive shareholder value
Stronger balance sheet enables GE to play offense
NET DEBT*-a)
*Non-GAAP financial Measure
(a – Includes bonds, 100% of preferred equity and 100% of cash.
(b – Based on today's portfolio of business including Aerospace, HealthCare, Renewables & Power
Net debt*-a)
<1.0X
Pref $6B
Bonds $35B
Cash $16B
Bonds & Pref
~$20B
Cash ~$10B
$25B
Net debt* / EBITDA-b) 3.3X
~$10B
GO FORWARD STRATEGY
81
GO FORWARD CAPITAL
ALLOCATION STRATEGY
• Evaluating opportunities that increase
growth, earnings & FCF*
 Organic: R&D, CapEx
 Restructuring
 Inorganic: acquisitions & dispositions
• Planned standalone investment-grade
companies will establish go forward financial
policies tailored to strategic & financial
objectives
• Board recently authorized share repurchase
up to $3B
2021 2023F
Source: March 2022, Investor Day
GE positioned to create value today
82
Strong franchises
Being run better for
the long term, today
Delivering better
results for
shareholders,
today and tomorrow
We rise to the challenge of building a world that works
Source: March 2022, Investor Day
Appendix
GAAP 2020*** 2021*** YoY
Total Revenues $75,833 $74,196 (2)%
Cash from Operating Activities
(CFOA)
$1,025 $888 $(137)
Profit $5,970 $(3,683) U
Profit Margin 7.9% (5.0)% (1,290) bps
Continuing EPS (diluted) $5.46** $(3.25) U
Non-GAAP* 2020*** 2021*** YoY
Adjusted Revenues 72,969 71,090 (3)%
Organic Revenues $71,589 $70,125 (2)%
Free Cash Flow (FCF) $635 $1,889 $1,254
FCF Ex. Disc. Factoring
Industrial FCF Ex. Disc. Factoring
$3,996
$2,628
$5,831
$(1,368)
$1,835
Adjusted Profit $2,246 $4,608 F
Adjusted
Profit Margin
3.1% 6.5% 340 bps
Adjusted EPS (diluted) $(0.07)** $1.71 F
84
2021 Performance Metrics
Dollars in millions; except per-share amounts
*Non-GAAP Financial Measures. Please see the Non-GAAP Financial Measures section on pages 21-22 and 32-34 of the
Management’s Discussion and Analysis within our 2021 Form 10-K for explanations of why we use these Non-GAAP
measures. The reconciliations to the most comparable GAAP financial measures are found in the appendix of this
document.
**Restated to account for the 1-for-8 reverse stock split which occurred after market close on 7/30/21
***Financial measures now on one-column basis
Source: GE 4th Quarter 2021 earnings, January 2022 and Form 10-K for 2021
Slightly better y/y, from $(1.2)B in ‘21
Updated 2Q’22: Expect to be below $(1.0)B for the year
85
~$(1.5)B expense & cash
INTEREST EXPENSE
TAXES
Adjusted tax rate* low to mid-twenties; cash taxes more closely aligned with book taxes;
excludes impact of separation-related taxes
ADJ. CORPORATE COSTS*
SEPARATION COSTS Expect ~50% of total separation costs (~$2B) excluding tax cost; cash lagging expense
NON-OP. BENEFIT COSTS Slightly positive driven by lower amortization of historical losses & investment gains
PREFERRED DIVIDENDS Expense recorded within adjusted EPS* … LIBOR + 333bps
BKR/AER STAKES Mark-to-market remaining investment; any impact treated as non-GAAP EPS adjustment
INSURANCE Expecting stable performance, lower COVID favorability
RESTRUCTURING Total expense & cash flat to slightly up; in-segment expense down
Other 2022 guidance items
*Non-GAAP Financial Measure
Source: March 2022, Investor Day
Updated: 2nd Quarter Earnings, July 2022
Updated 3Q’22: Expect to be below $(0.7)B for the year
Updated: 3rd Quarter Earnings, October 2022
86
GE full-year 2022 outlook: Updated 3Q~$4.5B FCF*
*Non-GAAP Financial Measure
Total Company Aerospace HealthCare Renewable Energy Power
Organic Revenue* High-single-digit growth >20% growth
Low- to mid-single-
digit growth
Low-single-digit growth
Low-single-digit
growth
Adjusted Profit
Margin*
150+ bps organic
expansion
Mid-teens
25-75 bps organic
expansion
Better, but negative Up
Adjusted Profit* $6.0B – $7.0B $3.8B – $4.3B $3.1B – $3.3B $(0.7)B – $(0.5)B $1.0B – $1.2B
Adjusted Earnings
per Share*
$2.80 – $3.50
Free Cash Flow* $5.5B – $6.5B Down slightly
Up, >100% free
cash flow
conversion*
Better, but negative
Up, >150% free cash flow
conversion*
Updated 1Q: below previous
range
Updated 3Q: ~ $(2)B
Updated 1Q: below
previous range
Updated 2Q: below prior year
and facing additional
pressure
Source: March 2022, Investor Day
Updated 2Q: MSD
Updated 2Q: below implied
Updated 3Q: $2.1B -
$2.3B
Updated 3Q: +$2.6B
Updated 2Q: further decline
Implied 3Q: flat to slightly
better
Updated: 2nd Quarter Earnings, July 2022
Updated: 3rd Quarter Earnings, October 2022
Updated 3Q: high-teens
Updated 3Q: above prior
range
Updated 2Q: Trending to
low-end
Updated 3Q: 125 – 150 bps
Updated 3Q: $2.40 - $2.80
Updated 2Q: ~4.5B
Updated 2Q: trending to low-
end
87
2021 Free cash flow* details
($ in millions)
2021
1Q'21 2Q'21 3Q'21 4Q'21 Total
Company Aerospace HealthCare Renewables Power Corporate
Net earnings (loss) ex insurance* — (0.8) 0.5 (3.6) (3.8) 2.3 2.3 (0.7) 0.6 (8.3)
Debt extinguishment costs — 1.4 — 5.1 6.5 — — — — 6.5
Depreciation & amortization 0.8 0.8 0.7 0.8 3.0 1.1 0.6 0.4 0.7 0.2
Operating working capital-a)-b) (0.9) 0.1 (0.1) 2.3 1.3 1.0 0.2 (0.2) 0.6 (0.2)
Other CFOA-c) (2.8) (1.0) 0.5 (0.5) (3.8) 0.4 (0.2) (0.5) (0.7) (2.8)
Gross capex (0.4) (0.3) (0.3) (0.4) (1.4) (0.5) (0.2) (0.4) (0.2) —
FCF* (3.4) 0.2 1.3 3.7 1.9 4.3 2.7 (1.4) 0.9 (4.7)
Disc. factoring cash flow impact-d) (0.8) 0.1 — — (0.7) (0.3) — (0.2) (0.2) —
FCF ex. disc. factoring*
(2.6) 0.1 1.4 3.7 2.6 4.6 2.7 (1.2) 1.2 (4.7)
* Non-GAAP Financial Measure
(a – Excludes CFOA impact from factoring programs discontinued as of April 1, 2021 and November 9, 2021
(b – Excludes CFOA impact from receivables factoring and supply chain finance eliminations
(c – Aggregates the following: (Gains) losses on sales of business interests, (Gains) losses on equity securities, principal pension plans (net), other post retirement benefit plans (net), income taxes (net), and all other
operating activities; excludes deal taxes, GE Pension Plan contributions and Goodwill impairments
(d - Discontinued factoring cash flow impact for the prior year 2020 were $(3.4)B split by Q1'20 $(1.4)B, Q2'20 $(1.0)B, Q3'20 $0.4B, Q4'20 $(1.4)B
Source: GE 4th Quarter 2021 earnings, January 2022
Non-GAAP reconciliations
89
Organic revenues, profit (loss) and profit margin by segment
* Non-GAAP Financial Measure
We believe these measures provide management and investors with a more complete understanding of underlying operating results and trends of established, ongoing operations by excluding the effect of acquisitions, dispositions and foreign currency, as these activities can obscure underlying trends.
ORGANIC REVENUES, PROFIT (LOSS) AND PROFIT MARGIN BY SEGMENT (NON-GAAP)
REVENUES PROFIT (LOSS) PROFIT MARGIN
(Dollars in millions) 2021 2020 V% 2021 2020 V% 2021 2020 V pts
Aerospace (GAAP) $ 21,310 $ 22,042 (3)% $ 2,882 $ 1,229 F 13.5 % 5.6 % 7.9pts
Less: acquisitions — — — —
Less: business dispositions — 48 — (48)
Less: foreign currency effect 21 — (18) —
Aerospace organic (Non-GAAP) $ 21,289 $ 21,994 (3)% $ 2,900 $ 1,277 F 13.6 % 5.8 % 7.8pts
HealthCare (GAAP) $ 17,725 $ 18,009 (2)% $ 2,966 $ 3,060 (3)% 16.7 % 17.0 % (0.3)pts
Less: acquisitions 19 (96) (29) (43)
Less: business dispositions — 911 — 373
Less: foreign currency effect 308 — 114 —
HealthCare organic (Non-GAAP) $ 17,398 $ 17,194 1 % $ 2,881 $ 2,729 6 % 16.6 % 15.9 % 0.7pts
Renewable Energy (GAAP) $ 15,697 $ 15,666 — % $ (795) $ (715) (11)% (5.1)% (4.6)% (0.5)pts
Less: acquisitions — — — —
Less: business dispositions — 33 — (4)
Less: foreign currency effect 414 — (39) —
Renewable Energy organic (Non-GAAP) $ 15,283 $ 15,633 (2)% $ (756) $ (711) (6)% (4.9)% (4.5)% (0.4)pts
Power (GAAP) $ 16,903 $ 17,589 (4)% $ 726 $ 274 F 4.3 % 1.6 % 2.7pts
Less: acquisitions — — — —
Less: business dispositions 26 220 (2) 7
Less: foreign currency effect 203 — (59) —
Power organic (Non-GAAP) $ 16,674 $ 17,370 (4)% $ 788 $ 267 F 4.7 % 1.5 % 3.2pts
Source: March 2022, Investor Day
90
HealthCare Organic revenues, profit (loss), and profit margin
* Non-GAAP Financial Measure
We believe these measures provide management and investors with a more complete understanding of underlying operating results and trends of established, ongoing operations by excluding the effect of acquisitions, dispositions and foreign currency, as these activities can obscure underlying trends.
HEALTHCARE ORGANIC REVENUES, PROFIT (LOSS) AND PROFIT MARGIN (NON-GAAP)
REVENUES PROFIT (LOSS) PROFIT MARGIN
(Dollars in millions) 2020 2019 V% 2020 2019 V% 2020 2019 V pts
HealthCare (GAAP) $ 18,009 $ 19,942 (10) % $ 3,060 $ 3,737 (18) % 17.0 % 18.7 % (1.7)pts
Less: acquisitions 55 21 (13) (4)
Less: business dispositions 21 2,603 (2) 1,111
Less: foreign currency effect (46) — (6) —
HealthCare organic (Non-GAAP) $ 17,979 $ 17,318 4 % $ 3,081 $ 2,630 17 % 17.1 % 15.2 % 1.9pts
Source: March 2022, Investor Day
91
Adjusted organic revenues and Equipment & service organic revenues
ORGANIC REVENUES (NON-GAAP)
(Dollars in millions) 2021 2020 V%
Total revenues (GAAP) $ 74,196 $ 75,833 (2)%
Less: Insurance revenues 3,106 2,865
Adjusted revenues (Non-GAAP) $ 71,090 $ 72,969 (3)%
Less: acquisitions 19 (67)
Less: business dispositions (33) 1,447
Less: foreign currency effect 979 —
Organic revenues (Non-GAAP) $ 70,125 $ 71,589 (2)%
EQUIPMENT AND SERVICES ORGANIC REVENUES (NON-GAAP) EQUIPMENT SERVICES
(Dollars in millions) 2021 2020 V% 2021 2020 V%
Total revenues (GAAP) $ 34,200 $ 37,584 (9)% $ 36,890 $ 35,385 4 %
Less: acquisitions — — 19 (67)
Less: business dispositions (32) 1,037 (1) 410
Less: foreign currency effect 664 — 315 —
Total organic revenues (Non-GAAP) $ 33,567 $ 36,547 (8)% $ 36,558 $ 35,042 4 %
* Non-GAAP Financial Measure
We believe these measures provide management and investors with a more complete understanding of underlying operating results and trends of established, ongoing operations by excluding the effect of acquisitions, dispositions and foreign currency, as these activities can obscure underlying trends.
Source: March 2022, Investor Day
92
Adjusted profit & profit margin
ADJUSTED PROFIT AND PROFIT MARGIN (EXCLUDING CERTAIN ITEMS) (NON-GAAP)
(Dollars in millions) 2021 2020 V%
Total revenues (GAAP) $ 74,196 $ 75,833 (2)%
Less: Insurance revenues 3,106 2,865
Adjusted revenues (Non-GAAP) $ 71,090 $ 72,969 (3)%
Total costs and expenses (GAAP) $ 80,702 $ 81,259 (1)%
Less: Insurance cost and expenses 2,540 2,668
Less: interest and other financial charges 1,813 2,018
Less: debt extinguishment costs 6,524 301
Less: non-operating benefit costs 1,782 2,430
Less: restructuring & other 455 693
Less: Steam asset impairment — 363
Less: SEC settlement charge — 200
Less: goodwill impairments — 728
Add: noncontrolling interests (71) (158)
Add: EFS benefit from taxes (162) (154)
Adjusted costs (Non-GAAP) $ 67,354 $ 71,546 (6)%
Other income (GAAP) $ 2,823 $ 11,396 (75)%
Less: gains (losses) on equity securities 1,921 (1,891)
Less: restructuring & other 75 13
Less: gains (losses) on purchases and sales of business interests (44) 12,452
Adjusted other income (Non-GAAP) $ 871 $ 823 6 %
Profit (loss) (GAAP) $ (3,683) $ 5,970 U
Profit (loss) margin (GAAP) (5.0)% 7.9 % (12.9) pts
Adjusted profit (loss) (Non-GAAP) $ 4,608 $ 2,246 F
Adjusted profit (loss) margin (Non-GAAP) 6.5 % 3.1 % 3.4 pts
* Non-GAAP Financial Measure
We believe that adjusting profit to exclude the effects of items that are not closely associated with ongoing operations provides management and investors with a meaningful measure that increases the period-to-period comparability. Gains (losses) and restructuring and other items are impacted by the
timing and magnitude of gains associated with dispositions, and the timing and magnitude of costs associated with restructuring and other activities.
Source: March 2022, Investor Day
93
Adjusted earnings (loss) and Adjusted earnings (loss) per share, one column basis
* Non-GAAP Financial Measure
Earnings-per-share amounts are computed independently. As a result, the sum of per-share amounts may not equal the total.
The service cost of our pension and other benefit plans are included in adjusted earnings (loss)*, which represents the ongoing cost of providing pension benefits to our employees. The components of non-operating benefit costs are mainly driven by capital allocation decisions and market performance,
and we manage these separately from the operational performance of our businesses. Gains (losses) and restructuring and other items are impacted by the timing and magnitude of gains associated with dispositions, and the timing and magnitude of costs associated with restructuring and other
activities. We believe that the retained costs in Adjusted earnings (loss)* provides management and investors a useful measure to evaluate the performance of the total company and increases period-to-period comparability.
ADJUSTED EARNINGS (LOSS) (NON-GAAP) 2021 2020 V%
(Dollars in millions, per-share amounts in dollars) Earnings EPS Earnings EPS Earnings EPS
Earnings (loss) from continuing operations (GAAP) $ (3,571) (3.25) $ 5,975 5.46 U U
Insurance earnings (pre-tax) 570 0.52 193 0.18
Tax effect on Insurance earnings (126) (0.11) (50) (0.05)
Less: Insurance earnings (net of tax) 444 0.40 143 0.13
Earnings (loss) excluding Insurance (Non-GAAP) $ (4,015) (3.66) $ 5,832 5.32 U U
Non-operating benefits costs (pre-tax) (GAAP) (1,782) (1.62) (2,430) (2.22)
Tax effect on non-operating benefit costs 374 0.34 510 0.47
Less: non-operating benefit costs (net of tax) (1,408) (1.28) (1,920) (1.75)
Gains (losses) on purchases and sales of business interests (pre-tax) (44) (0.04) 12,452 11.37
Tax effect on gains (losses) on purchases and sales of business interests 6 0.01 (1,257) (1.15)
Less: gains (losses) on purchases and sales of business interests (net of tax) (37) (0.03) 11,195 10.22
Gains (losses) on equity securities (pre-tax) 1,921 1.75 (1,891) (1.73)
Tax effect on gains (losses) on equity securities(a) 128 0.12 637 0.58
Less: gains (losses) on equity securities (net of tax) 2,049 1.87 (1,255) (1.15)
Restructuring & other (pre-tax) (380) (0.35) (680) (0.62)
Tax effect on restructuring & other 35 0.03 151 0.14
Less: restructuring & other (net of tax) (346) (0.31) (529) (0.48)
Debt extinguishment costs (pre-tax) (6,524) (5.94) (301) (0.27)
Tax effect on debt extinguishment costs(b) 430 0.39 57 0.05
Less: debt extinguishment costs (net of tax) (6,094) (5.55) (244) (0.22)
Steam asset impairments (pre-tax) — — (363) (0.33)
Tax effect on Steam asset impairments — — 37 0.03
Less: Steam asset impairments (net of tax) — — (326) (0.30)
Goodwill impairments (pre-tax) — — (728) (0.66)
Tax effect on goodwill impairments — — (23) (0.02)
Less: goodwill impairments (net of tax) — — (751) (0.69)
Less: Accretion of redeemable noncontrolling interest (pre-tax and net of tax) (9) (0.01) (151) (0.14)
Less: SEC settlement charge (pre-tax and net of tax) — — (200) (0.18)
Less: U.S. tax reform enactment adjustment 8 0.01 (49) (0.05)
Less: Tax benefit related to BioPharma sale — — 143 0.13
Less: Tax loss related to GECAS transaction (54) (0.05) — —
Adjusted earnings (loss) (Non-GAAP) $ 1,876 1.71 $ (81) (0.07) F F
(a) Includes tax benefits available to offset the tax on gains in equity securities.
(b) Includes related tax valuation allowances.
Source: March 2022, Investor Day
94
Free cash flows (FCF) and GE Industrial FCF (including and excluding discontinued factoring)
FREE CASH FLOWS (FCF) (Non-GAAP)
(Dollars in millions) 2021 2020 V$
CFOA (GAAP) $ 888 $ 1,025 $ (137)
Less: Insurance CFOA 86 (80) 167
CFOA excluding Insurance (Non-GAAP) $ 802 $ 1,105 $ (304)
Add: gross additions to property, plant and equipment-a) (1,250) (1,579) 329
Add: gross additions to internal-use software-a) (111) (151) 39
Less: GE Pension Plan funding — (2,500) 2,500
Less: CFOA impact from factoring programs discontinued in 2021 (5,108) — (5,108)
Less: CFOA impact from receivables factoring and supply chain finance eliminations 2,666 1,419 1,246
Less: taxes related to business sales (6) (178) 172
Free cash flows (Non-GAAP) $ 1,889 $ 635 $ 1,254
Less: prior period CFOA impact from factoring programs discontinued in 2021 -b) (739) (3,361) 2,622
Free cash flows excluding discontinued factoring (Non-GAAP) $ 2,628 $ 3,996 $ (1,368)
* Non-GAAP Financial Measure
We believe investors may find it useful to compare GE’s Total Company and Industrial free cash flows* performance without the effects of cash used for taxes related to business sales, the factoring program discontinuation, pension plan funding and receivables factoring and supply chain finance
eliminations. We believe this measure will better allow management and investors to evaluate the capacity of our industrial operations to generate free cash flows.
(a – Included in Gross CAPEX
(b – Represents the CFOA impact from cash that GE would have otherwise collected had customer receivables not been previously sold in factoring programs that have now been discontinued.
GE INDUSTRIAL FREE CASH FLOWS (FCF) (Non-GAAP)
(Dollars in millions) 2021 2020 V$
GE Industrial CFOA (GAAP) $ 1,530 $ (1,254) $ 2,784
Add: gross additions to property, plant and equipment-a) (1,250) (1,579) 329
Add: gross additions to internal-use software-a) (107) (143) 36
Less: GE Pension Plan funding — (2,500) 2,500
Less: CFOA impact from factoring programs discontinued in 2021 (5,108) — (5,108)
Less: taxes related to business sales 189 (1,082) 1,271
GE Industrial free cash flows (Non-GAAP) $ 5,092 $ 606 $ 4,487
Less: prior period CFOA impact from factoring programs discontinued in 2021 -b) (739) (3,361) 2,622
GE Industrial free cash flows excluding discontinued factoring (Non-GAAP) $ 5,831 $ 3,967 $ 1,864
Source: March 2022, Investor Day
95
Free cash flows (FCF) by quarter (including and excluding discontinued factoring)
FREE CASH FLOWS (FCF) (Non-GAAP)
(Dollars in millions) Q1'21 Q2'21 Q3'21 Q4'21 FY'21
CFOA (GAAP) $ (2,640) $ (351) $ 1,464 $ 2,415 $ 888
Less: Insurance CFOA 60 (16) (4) 46 86
CFOA excluding Insurance (Non-GAAP) $ (2,699) $ (336) $ 1,467 $ 2,369 $ 802
Add: gross additions to property, plant and equipment-a) (332) (267) (296) (355) (1,250)
Add: gross additions to internal-use software-a) (24) (26) (29) (33) (111)
Less: GE Pension Plan funding — — — — —
Less: CFOA impact from factoring programs discontinued in 2021 — (2,706) (362) (2,041) (5,108)
Less: CFOA impact from receivables factoring and supply chain finance eliminations 306 1,884 161 314 2,666
Less: taxes related to business sales — (6) — — (6)
Free cash flows (Non-GAAP) $ (3,361) $ 199 $ 1,343 $ 3,708 $ 1,889
Less: prior period CFOA impact from factoring programs discontinued in 2021 -b) (778) 67 (28) — (739)
Free cash flows excluding discontinued factoring (Non-GAAP) $ (2,583) $ 132 $ 1,371 $ 3,708 $ 2,628
* Non-GAAP Financial Measure
We believe investors may find it useful to compare GE’s Total Company free cash flows* performance without the effects of cash used for taxes related to business sales, the factoring program discontinuation, pension plan funding and receivables factoring and supply chain finance eliminations. We
believe this measure will better allow management and investors to evaluate the capacity of our industrial operations to generate free cash flows.
(a – Included in Gross CAPEX
(b – Represents the CFOA impact from cash that GE would have otherwise collected had customer receivables not been previously sold in factoring programs that have now been discontinued.
FREE CASH FLOWS (FCF) (Non-GAAP)
(Dollars in millions) Q1'20 Q2'20 Q3'20 Q4'20 FY'20
CFOA (GAAP) $ (919) $ (1,501) $ 545 $ 2,901 $ 1,025
Less: Insurance CFOA (30) (32) (91) 73 (80)
CFOA excluding Insurance (Non-GAAP) $ (890) $ (1,469) $ 636 $ 2,828 $ 1,105
Add: gross additions to property, plant and equipment-a) (504) (498) (300) (276) (1,579)
Add: gross additions to internal-use software-a) (60) (38) (27) (25) (151)
Less: GE Pension Plan funding — — — (2,500) (2,500)
Less: CFOA impact from factoring programs discontinued in 2021 — — — — —
Less: CFOA impact from receivables factoring and supply chain finance eliminations 226 762 (229) 660 1,419
Less: taxes related to business sales (17) (71) (64) (26) (178)
Free cash flows (Non-GAAP) $ (1,663) $ (2,697) $ 602 $ 4,392 $ 635
Less: prior period CFOA impact from factoring programs discontinued in 2021 -b) (1,368) (1,049) 433 (1,377) (3,361)
Free cash flows excluding discontinued factoring (Non-GAAP) $ (295) $ (1,647) $ 169 $ 5,769 $ 3,996
Source: GE 4th Quarter 2021 earnings, January 2022
96
Free cash flows (FCF) by segment (including and excluding discontinued factoring and
excluding BioPharma)
2021 FREE CASH FLOWS (FCF) (Non-GAAP)
(Dollars in millions) Aerospace HealthCare Renewables Power Corporate Total Company
CFOA (GAAP) $ 2,815 $ 1,471 $ (1,576) $ 24 $ (1,846) $ 888
Less: Insurance CFOA — — — — 86 86
CFOA excluding Insurance (Non-GAAP) $ 2,815 $ 1,471 $ (1,576) $ 24 $ (1,933) $ 802
Add: gross additions to property, plant and equipment-a) (445) (242) (349) (189) (25) (1,250)
Add: gross additions to internal-use software-a) (61) (6) (9) (23) (13) (111)
Less: GE Pension Plan funding — — — — — —
Less: CFOA impact from factoring programs discontinued in 2021 (2,006) (1,481) (539) (1,117) 35 (5,108)
Less: CFOA impact from receivables factoring and supply chain finance eliminations — — — — 2,666 2,666
Less: taxes related to business sales — — — — (6) (6)
Free cash flows (Non-GAAP) $ 4,315 $ 2,705 $ (1,395) $ 929 $ (4,665) $ 1,889
Less: prior period CFOA impact from factoring programs discontinued in 2021-b) (314) — (195) (232) 2 (739)
Free cash flows excluding discontinued factoring (Non-GAAP) $ 4,629 $ 2,705 $ (1,200) $ 1,161 $ (4,667) $ 2,628
2020 FREE CASH FLOWS (FCF) (Non-GAAP)
(Dollars in millions) Aerospace HealthCare Renewables Power Corporate Total Company
CFOA (GAAP) $ 763 $ 3,143 $ (328) $ 285 $ (2,838) $ 1,025
Less: Insurance CFOA — — — — (80) (80)
CFOA excluding Insurance (Non-GAAP) $ 763 $ 3,143 $ (328) $ 285 $ (2,757) $ 1,105
Add: gross additions to property, plant and equipment-a) (737) (256) (302) (245) (40) (1,579)
Add: gross additions to internal-use software-a) (61) (24) (11) (25) (30) (151)
Less: GE Pension Plan funding — — — — (2,500) (2,500)
Less: CFOA impact from factoring programs discontinued in 2021 — — — — — —
Less: CFOA impact from receivables factoring and supply chain finance eliminations — — — — 1,419 1,419
Less: taxes related to business sales — — — — (178) (178)
Free cash flows (Non-GAAP) $ (34) $ 2,863 $ (641) $ 15 $ (1,569) $ 635
Less: prior period CFOA impact from factoring programs discontinued in 2021-b) (2,023) (179) (606) (529) (24) (3,361)
Free cash flows excluding discontinued factoring (Non-GAAP) $ 1,989 $ 3,042 $ (34) $ 544 $ (1,545) $ 3,996
Less: BioPharma CFOA — 315 — — — 315
Less: BioPharma gross additions to property, plant and equipment — (17) — — — (17)
Less: BioPharma gross additions to internal-use software — (2) — — — (2)
Free cash flows excluding discontinued factoring and BioPharma (Non-GAAP) $ 1,989 $ 2,746 $ (34) $ 544 $ (1,545) $ 3,700
* Non-GAAP Financial Measure
We believe investors may find it useful to compare GE’s Total Company free cash flows* performance without the effects of cash used for taxes related to business sales, the factoring program discontinuation, pension plan funding and receivables factoring and supply chain finance eliminations. We
believe this measure will better allow management and investors to evaluate the capacity of our industrial operations to generate free cash flows.
(a – Included in Gross CAPEX
(b – Represents the CFOA impact from cash that GE would have otherwise collected had customer receivables not been previously sold in factoring programs that have now been discontinued.
Source: March 2022, Investor Day
Adjusted Corporate costs
97
ADJUSTED CORPORATE COSTS (NON-GAAP)
(Dollars in millions) 2021 2020 V%
Revenues
Corporate revenues $ 945 $ 1,313
Insurance revenues 3,106 2,865
Eliminations and other (1,490) (1,650)
Total Corporate $ 2,561 $ 2,528 1 %
Operating profit (cost)
Gains (losses) on purchases and sales of business interests $ (44) $ 12,452
Gains (losses) on equity securities 1,921 (1,891)
Restructuring and other charges (380) (680)
Steam asset impairments, net of noncontrolling interests of $65 million — (363)
SEC settlement charge — (200)
Goodwill impairments, net of noncontrolling interests of $149 million — (728)
Insurance profit (loss) 566 197
Adjusted total corporate operating costs (Non-GAAP) (1,170) (1,602)
Total Corporate (GAAP) $ 892 $ 7,184
Less: gains (losses), impairments, Insurance, and restructuring & other 2,062 8,786
Adjusted total corporate operating costs (Non-GAAP) $ (1,170) $ (1,602) 27 %
Functions & operations $ (848) $ (1,303)
Environmental, health and safety (EHS) and other items (302) (104)
Eliminations (20) (195)
Adjusted total corporate operating costs (Non-GAAP) $ (1,170) $ (1,602) 27 %
* Non-GAAP Financial Measure
Adjusted total corporate operating costs* excludes gains (losses) on purchases and sales of business interests, significant higher-cost restructuring programs, gains (losses) on equity securities, goodwill impairments and run-off Insurance profit. We believe that adjusting corporate costs to exclude the
effects of items that are not closely associated with ongoing corporate operations provides management and investors with a meaningful measure that increases the period-to-period comparability of our ongoing corporate costs.
Source: March 2022, Investor Day
98
Net earnings (loss) excluding Insurance
TOTAL COMPANY NET EARNINGS (LOSS) EXCLUDING INSURANCE (NON-GAAP)
(Dollars in millions) 1Q'21 2Q'21 3Q'21 4Q'21 FY'21
Net earnings (loss) from continuing operations (GAAP) $ 97 $ (571) $ 582 $ (3,504) $ (3,396)
Less: Insurance earnings (net of tax) 111 181 42 110 444
Net earnings (loss) excluding Insurance (Non-GAAP) $ (15) $ (752) $ 540 $ (3,613) $ (3,840)
* Non-GAAP Financial Measure
We believe investors may find it useful to compare GE’s Total Company free cash flows* performance without the effects of insurance earnings/(losses) net of tax. We believe this measure will better allow management and investors to evaluate the capacity of our industrial operations to generate free
cash flows.
2021 NET EARNINGS (LOSS) EXCLUDING INSURANCE (NON GAAP)
(Dollars in millions) Aerospace HealthCare Renewables Power Corporate Total Company
Net earnings (loss) from continuing operations (GAAP) $ 2,295 $ 2,304 $ (741) $ 564 $ (7,818) $ (3,396)
Less: Insurance earnings (net of tax) 0 0 0 0 444 444
Net earnings (loss) excluding Insurance (Non-GAAP) $ 2,295 $ 2,304 $ (741) $ 564 $ (8,262) $ (3,840)
2020 NET EARNINGS (LOSS) EXCLUDING INSURANCE (NON GAAP)
(Dollars in millions) Aerospace HealthCare Renewables Power Corporate Total Company
Net earnings (loss) from continuing operations (GAAP) $ 841 $ 2,344 $ (618) $ 146 $ 3,745 $ 6,458
Less: Insurance earnings (net of tax) 0 0 0 0 143 143
Net earnings (loss) excluding Insurance (Non-GAAP) $ 841 $ 2,344 $ (618) $ 146 $ 3,601 $ 6,314
Source: GE 4th Quarter 2021 earnings, January 2022
GE Net debt
99
* Non-GAAP Financial Measure
a) - We are including this calculation to provide another market view to GE’s leverage.
b) - Represents the total net deficit status of principal pension plans, other pension plans and retiree benefit plans.
c) - We are including this calculation to provide a view aligned to credit rating methodology.
GE CONSOLIDATED NET DEBT (NON-GAAP) December 31, 2021
(Dollars in millions)
Total consolidated GE borrowings (GAAP) 35,186
100% of preferred stock 5,935
Deduction for 100% of GE cash, cash equivalents and restricted cash (15,770)
Total GE consolidated net debt - market aligned (Non-GAAP) (a) 25,351
Pension and principal retiree benefit plan liabilities (pre-tax) (b) 15,341
Less: taxes at 21% 3,222
Pension and principal retiree benefit plan liabilities (net of tax) 12,119
GE operating lease liabilities 2,848
Less: 50% of GE preferred stock 2,967
Short-term off-book factoring 161
Add back total GE cash, cash equivalents and restricted cash 15,770
Less: 25% of GE cash, cash equivalents and restricted cash (3,942)
Deduction for 75% of GE cash, cash equivalents and restricted cash (11,827)
Total GE consolidated net debt - rating agency aligned (Non-GAAP) (c) 41,453
Approaches
• Market Aligned: Measure introduced in 4Q’21 to provide another market view to GE’s leverage.
• Rating Agency Aligned: Measure introduced in 2018. Aligned to credit rating methodology.
Source: March 2022, Investor Day
Approaches
◦ Market Aligned: Measure introduced in 4Q’21 to provide another market view to GE’s leverage.
◦ Rating Agency Aligned: Measure introduced in 2018. Aligned to credit rating methodology.
GE EBITDA & leverage
* Non-GAAP Financial Measure
a) Other items are mainly comprised of adjustments for gains and out of segment restructuring
b) Rating Agency aligned adjustments are mainly comprised of adjusted other income, long-term fixed operating lease expense, stock-related compensation expense and out of segment restructuring.
GE NET DEBT/EBITDA RATIO - MARKET ALIGNED (NON-GAAP)
(Dollars in millions) December 31, 2021
Total GE consolidated net debt - market aligned (Non-GAAP) 25,351
Total GE leverage EBITDA - market aligned (Non-GAAP) 7,616
GE net debt/EBITDA ratio - market aligned (Non-GAAP) 3.3x
GE NET DEBT/EBITDA RATIO - RATING AGENCY ALIGNED (NON-GAAP)
(Dollars in millions) December 31, 2021
Total GE consolidated net debt - rating agency aligned (Non-GAAP) 41,453
Total GE leverage EBITDA - rating agency aligned (Non-GAAP) 7,748
GE net debt/EBITDA ratio - rating agency aligned (Non-GAAP) 5.4x
100
GE CONSOLIDATED LEVERAGE EBITDA - (NON-GAAP)
(Dollars in millions) December 31, 2021
GE earnings (loss) from continuing operations before income taxes (GAAP) (3,683)
Less: Interest and other financial charges (1,813)
Less: Debt extinguishment costs (6,524)
Less: Depreciation and amortization of property, plant, and equipment and amortization of intangible assets (3,009)
Less: Non-operating benefit costs (1,782)
Less: Other items(a) 1,426
Less: Insurance profit 566
Add: EFS benefit from taxes 162
Total GE leverage EBITDA - MARKET ALIGNED (Non-GAAP) 7,616
Add: Rating Agency aligned adjustments(b) 132
Total GE leverage EBITDA - RATING AGENCY ALIGNED (Non-GAAP) 7,748
Source: March 2022, Investor Day
We cannot provide a reconciliation of the differences between the non-GAAP expectations and corresponding GAAP measure for Adjusted EPS* in 2022 without unreasonable effort due to the uncertainty of
timing of any gains or losses related to acquisitions & dispositions, the timing and magnitude of the financial impact related to the mark-to-market of our remaining investment in AerCap and Baker Hughes,
and the timing and magnitude of restructuring expenses. Although we have attempted to estimate the amount of gains and restructuring charges for the purpose of explaining the probable significance of
these components, this calculation involves a number of unknown variables, resulting in a GAAP range that we believe is too large and variable to be meaningful.
2022 ADJUSTED EPS (NON-GAAP)
* Non-GAAP Financial Measure 101
We cannot provide a reconciliation of the differences between the non-GAAP expectations and corresponding GAAP measure for free cash flows* in 2022 without unreasonable effort due to the uncertainty of
timing of deal taxes related to business sales.
2022 FREE CASH FLOWS (NON-GAAP)
Source: March 2022, Investor Day

General Electric 2022 Company Overview

  • 1.
    GE 2022 CompanyOverview December 2022
  • 2.
    CAUTION CONCERNING FORWARD-LOOKINGSTATEMENTS: This document contains "forward-looking statements" – that is, statements related to future events that by their nature address matters that are, to different degrees, uncertain. For details on the uncertainties that may cause our actual future results to be materially different than those expressed in our forward-looking statements, see https://www.ge.com/investor- relations/important-forward-looking-statement-information as well as our annual reports on Form 10-K and quarterly reports on Form 10-Q. We do not undertake to update our forward-looking statements. This document also includes certain forward-looking projected financial information that is based on estimates and forecasts. Actual results could differ materially. NON-GAAP FINANCIAL MEASURES: In this document, we sometimes use information derived from consolidated financial data but not presented in our financial statements prepared in accordance with U.S. generally accepted accounting principles (GAAP). Certain of these data are considered “non-GAAP financial measures” under the U.S. Securities and Exchange Commission rules. These non-GAAP financial measures supplement our GAAP disclosures and should not be considered an alternative to the GAAP measure. The reasons we use these non-GAAP financial measures and the reconciliations to their most directly comparable GAAP financial measures are included in our earnings releases and the appendix of this presentation, as applicable. Amounts shown on subsequent pages may not add due to rounding. GE’s Investor Relations website at www.ge.com/investor and our corporate blog at www.gereports.com, as well as GE’s Facebook page and Twitter accounts, contain a significant amount of information about GE, including financial and other information for investors. GE encourages investors to visit these websites from time to time, as information is updated and new information is posted. 2
  • 3.
  • 4.
    GE: building aworld that works 4 Momentum building … led by strong GE Aerospace performance Positioning GE Vernova-a) for long-term profitable growth through Renewable Energy actions & external catalysts Planned spins on track … GE HealthCare first & ready to go Solid foundation for three independent, investment-grade, industry-leading companies Power - Received a Kindle Energy order to provide H-Class power generation equipment for its expected 725MW natural gas-fired Magnolia Power Plant CREATING VALUE TODAY & TOMORROW PLANS TO LAUNCH THREE INDEPENDENT COMPANIES (a – GE's existing energy portfolio of businesses, including Renewable Energy, Power, Digital, and Energy Financial Services, will sit together under the name GE Vernova (b – Includes any remaining stakes in AerCap and Baker Hughes and, upon close, expected 19.9% of go-forward HealthCare, as well as other assets and liabilities of GE today, including run-off Insurance operations GE plans to be an aviation-focused company-b) … in early '24 Youngest & largest commercial fleet ... most diversified services portfolio Tax-free spin-off... planned in early ’24 Leading wind technologies, world's most efficient gas turbines, modernizing the grid Source: 3rd Quarter Earnings, October 2022
  • 5.
    GE HealthCare readyto go … targeted for Jan 4, '23 Announced Board of Directors for future independent company Publicly filed Form 10 Hosting Investor Day on December 8 Global leader in precision care Outstanding portfolio of innovative products & solutions Accelerating growth & margin expansion Creating long-term value as a faster-growing, more profitable company RECENT SPIN PROGRESS CLEAR STRATEGY FOR VALUE CREATION 5 Source: 3rd Quarter Earnings, October 2022
  • 6.
    Why GE ispositioned to create value today Profitable growth built on a foundation of lean … a new day for GE * Non-GAAP Financial Measure STRONG FRANCHISES • Leading positions in growing, critical sectors … advancing precision care, energy transition, future of flight • Differentiated technology … investing in innovation to solve customer needs • Global reach … close customer relationships, growing installed bases, essential services 1 BEING RUN BETTER FOR THE LONG TERM, TODAY • Team … deep domain expertise, resilience, driving lasting culture change • Lean … leading to sustainable improvements in safety, quality, delivery, cost, & cash management • Decentralization … decision-making & accountability closer to the customer 2 DELIVERING BETTER RESULTS FOR SHAREHOLDERS, TODAY AND TOMORROW • Sustainable financial performance … revenue growth, margin expansion, earnings growth, FCF* conversion • Solid balance sheet & cash position … supporting greater capital deployment for organic & inorganic growth • Plan to create three companies a natural evolution … businesses positioned to realize full potential 3 6 Source: March 2022, Investor Day
  • 7.
    (a – revenueexcludes Insurance (b – Adjusted profit margin Businesses positioned well for market growth HEALTHCARE 4M+ installations 2B+ patient exams per year POWER 7,000+ gas turbines 400+ GW of renewable energy equipment 7 TOTAL 2021 Backlog $19B $74B $428B 2021 Revenue $18B $17B $71B*-a) Services % of revenue 49% 70% 52%-a) 2021 Profit Margin % 16.7% 4.3% 6.5%*-b) Services % of backlog 66% 81% 83% RENEWABLE ENERGY $32B $16B 16% (5.1)% 41% Growing higher-margin services Vast global installed base * Non-GAAP Financial Measure Differentiated tech, global reach, essential services, close to customer AEROSPACE ~39,400 commercial-c) & ~26,200 military aircraft engines $303B $21B 65% 13.5% 88% (c – Including GE and its joint venture partners Source: June 2022, Bernstein SDC
  • 8.
    Delivering profitable growth 8 LASTINGCULTURE CHANGE Acting with humility Leading with transparency LEAN AT THE FOUNDATION Focus on customer During GE Kaizen Week, the Aerospace team “trystormed” possible solutions to improve missed delivery targets including visual management Delivering with focus Driving safety, quality, delivery, & cost improvements in GE’s nearly 30 business P&Ls Elimination of waste HealthCare is making production more efficient at its plant in Hino, Japan through value stream mapping, standard work & Kaizen Gas Power uses Hoshin Kanri to prioritize deploying its lean work to its most strategic objectives, such as improving the 7F outage customer experience Prioritization of work Source: March 2022, Investor Day
  • 9.
    Playing offense: Innovation,growth & profitability Market, sell & service products we have today Strengthen offerings with new product introductions Technology to lead industries forward Strategic M&A to expand competitive capabilities Together with GE Research, Aerospace announced a new research partnership with NASA to accelerate the introduction of hybrid electric flight technologies for commercial aviation PRIORITIZING ORGANIC INVESTMENTS COMPLEMENTED BY INORGANIC INVESTMENT 9 Safety, quality, delivery & cost a must ... driving shorter lead times, growth & profitability IMPROVING OPERATIONS FIRST Fortifying competitive positions globally & unlocking upside potential Source: March 2022, Investor Day
  • 10.
    Building a worldthat works for tomorrow Progressing our efforts & improving programs • Progress toward 2030 carbon neutrality commitment: 21% reduction vs. 2019 (Scope 1 & 2 emissions) • Ambition to be a net zero company by 2050, for Scope 3 emissions from use of sold products • Executed ESG issues assessment for GE Company and our businesses • Introduced clearer product safety and quality goals, programs and initiatives as well as a holistic strategy around product stewardship and circular economy • Published our inaugural GE Human Rights Report, providing increased transparency into our governance and due diligence processes Source: 2021 GE Sustainability Report 1 based on full-time equivalent, active employees as of December 31, 2021 2 CFM International is a 50-50 joint venture (JV) between GE and Safran Aircraft Engines; Engine Alliance is a 50-50 JV between GE and Pratt & Whitney 3 GE, customer and partner funded Sustainability Priorities How are strategy and sustainability priorities align with the UN Sustainable Development Goals (SDGs) 10 10
  • 11.
    Our Representation 11 Building aworld that works for everyone Committed to a More Diverse Workforce • GE a global company … 68% of employees based outside of the U.S., representing nationalities from 169 countries • Saw growth at the leadership level for both women globally (+1.2%) and for total U.S. race and ethnic minority (+1.7%) since 2020 • On average, men and women performing similar work are paid within 1% of each other in each GE business • GE Board of Directors female representation at 36%, with two of four Board leadership positions held by women • GE launched Next Engineers in 2021 … a global college-readiness initiative to increase the diversity of young people in engineering Source: 2021 GE Diversity Report Leadership encompasses the top 1.5% of all active employees; female representation growth relative to 2020-based Clinical Apps Meet Our Employee Resource Groups AFRICAN AMERICAN/AFFINITY FORUM (AAF) Building on a deep-rooted history and culture within GE as the oldest ERG ASIAN PACIFIC ALLIES & FRIENDS (APAF) Supporting GE’s Asian Pacific Islander (API) employees PRIDE ALLIANCE (PRIDE) Welcoming the LGBTQAI+ community and their allies HISPANIC FORUM (HF) Promoting Hispanic heritage, showcasing Hispanic talent and value DISABILITIES ADVOCACY NETWORK (DAN) Enabling people with disabilities, their families, and allies to connect & thrive VETERANS NETWORK (VN) Encouraging the career development & growth of our veterans WOMEN’S NETWORK (WN) Attracting, developing, inspiring, & retaining female professional talent GREEN TEAM NETWORK (GTN) Furthering our sustainability goals with a grassroots-driven approach Proud to have been an early leader in the creation of strong Employee Resource Groups (ERGs) nearly 30 years ago
  • 12.
    Taking action –GE Aerospace & GE HealthCare 12 Lean fundamentals critical to driving improved delivery AEROSPACE - OE AEROSPACE - SERVICES • Improvement versus 1Q • Largest constraints: structural castings & forgings • Improvement throughout 2Q • Constraints: repairs, castings, forgings, labor gaps Mfg. lines at shortage risk • Lowest since March ‘21 • Constraints: chips, resins • Inflation from spot buys, logistics Work stops • 6 recent LEAP supplier kaizens • Daily management to drive throughput (e.g. Hooksett plant) • Dedicated additional 20% of existing engineers to support delivery • 70 manufacturability projects in 1H’22 • Monthly recruiting kaizens to ramp labor across multiple sites • ~1,600 skilled mechanics added • Improving overhaul turn around time ◦ Wales Shingi … 5% faster cycle ◦ Multiple Repair kaizens • Supplier actions, dual sources • >6,400 alternative subcomponents/ design changes • >20% cycle time reduction at Cork, expanded factory capacity • Secured critical components for 2H Material issues HEALTHCARE Engine output up >3% q/q Shop visit-a) output up >20% q/q Overdue backlog down >5% q/q (a – Internal shop visits Source: 2nd Quarter Earnings, July 2022
  • 13.
    Taking action –GE Vernova 13 Experienced leaders running proven playbook across businesses POWER PLAYBOOK RENEWABLE ENERGY FOCUS Market expectation "Fixed" cost Product cost Price, selectivity & underwriting • Conservatively assumed & sized Gas business for ~25-30 GW global market • Developing strategy which assumes ~2,000 GE Onshore turbines/year • Refocusing on select geographies • Building plans to resize footprint in line with market & selectivity • Cost actions to yield significant savings • Driving NPI cost curve down and industrializing supply chain for large scale production • Proactive fleet durability actions • Improved product durability • Focused on product cost & CSA productivity • Narrow scope – equipment, Steam services • Grow higher-margin Aero & Services • Services escalation & list price increases • Defined international strike zones • Grow higher-margin Grid Automation, Services • Focus on price … Onshore price improving • Reduced headcount ~20% since ‘18 • Gas Power ~$1B reduced cost Lean & decentralization • Reorganized into 4 P&Ls, removed HQ • Lean at foundation, e.g. Live Outage • Decentralizing & driving full P&L accountability • Example: Grid reorganization into 3 P&Ls • Embedding lean, cross functional problem solving GE’s portfolio of energy businesses Source: 2nd Quarter Earnings, July 2022
  • 14.
    Driving Renewable Energyprofitability in 2024 TAKING ACTION: ONSHORE WIND GE VERNOVA EXTERNAL CATALYSTS (a – Subject to EWC consult & approval; program across GE Vernova businesses, primarily at Renewable Energy (b – Source: ’13-’23 WoodMac; ’24-’34 GE forecast GE’s portfolio of energy businesses GE Vernova – path to profitability • Historic action in U.S., EU, globally on climate, energy • U.S.: Inflation Reduction Act: ~$370B for energy, 10 year package aligned with GE Vernova technology; Infrastructure & Investment Jobs Act: $65B+ for grid modernization, nuclear, breakthroughs • EU: energy crisis accelerating pragmatic approach for reduced emissions & energy security … Taxonomy approved with support for gas, nuclear, renewables • Focused on improving fleet availability, better balancing innovation & industrialization ◦ Pivot to standard, simplified, “workhorse” products ... improving quality & product cost ◦ Deploying corrective measures in existing fleet • Driving selectivity by narrowing geographic focus, significant price improvement • Across businesses, initiating restructuring over a few years ... planning for ~$0.5B annualized savings-a) & ~$0.6B expense-a) U.S. Onshore Average Installations (GW)-b) ~9 ~15 ’13 – ‘23 ’24 – ‘34 14 Source: 3rd Quarter Earnings, October 2022
  • 15.
    Digital launched OpusOne Distributed Energy Resource Management System to help keep the electric grid safe, secure, and resilient Innovation and growth highlights 15 Power secured an order for 9HA combined cycle power plants in Vietnam – the first HA powered plant in the country Strengthening competitive positions globally & unlocking upside potential HealthCare launched Voluson Expert 22, with artificial intelligence powered ultrasound unlocking new imaging and processing power HealthCare & Medtronic are enabling personalized care on the CARESCAPE precision monitoring platform Aerospace announced 200 CFM-International LEAP- 1B engines were selected by Delta Air Lines to power its new fleet of 737-10 aircraft Aerospace completed the world's first test of a megawatt- class and multi-kilovolt hybrid electric propulsion system at altitude simulating single-aisle commercial flight GE VERNOVA GE's portfolio of energy businesses HEALTHCARE AEROSPACE Source: 2nd Quarter Earnings, July 2022
  • 16.
    HSD revenue growth*(low end), 125-150 bps OMX*, $2.40-$2.80 adj. EPS*, ~$4.5B FCF* Outlook assumptions • Aerospace: continued ramp in deliveries, internal SVs and spare parts • HealthCare: continued supply chain improvements supporting growth, price and sequential working capital improvement • Renewable Energy: Onshore volume pressure; inflation across businesses • Power: Gas outages and deliveries up Q/Q Investor Day (Mar 10, 2022) 1Q Earnings (Apr 26, 2022) 2Q Earnings (Jul 26, 2022) 3Q Earnings (Oct 25, 2022) Organic revenue growth* HSD Trending towards low end of range Adjusted organic margin expansion* 150+ bps Trending towards low end of range 125 - 150 bps Adjusted EPS* $2.80 - $3.50 Trending towards low end of range $2.40 - $2.80 Free cash flow* $5.5B - $6.5B Trending towards low end of range Likely to push out ~$1B ~$4.5B * Non-GAAP Financial Measure Expect '22 interest expense & cash ~$(1.5)B, adjusted tax rate* low-to-mid twenties w/ cash & book tax more closely aligned, and adjusted corporate cost* better than $(0.7)B Key variables • Supply chain constraints • Transactional volume • Renewable Energy orders & related progress collections • Timing of aircraft deliveries (AD&A) 2022 Outlook 16 Source: 3rd Quarter Earnings, October 2022
  • 17.
    Leading in importantgrowth sectors PRECISION CARE Driving innovation in precision care to address critical patient & clinical challenges ENERGY TRANSITION Supporting customers & communities seeking to provide affordable, reliable, sustainable power FUTURE OF FLIGHT Helping customers achieve greater efficiency & sustainability & invent the future of flight MSD High teens to 20%+ 90%+ * Non-GAAP Financial Measure (a – FCF conversion* on GE defined basis: segment FCF* / segment net income, adjusted to include non-GAAP restructuring expense LSD HSD 80%-90% Long term through the cycle Shaping the future ... building a world that works MSD High teens to 20% 100%+ 17 Org. revenue growth* Profit margin FCF conversion*-a) Source: March 2022, Investor Day
  • 18.
  • 19.
    HealthCare: Key messages 19 GLOBALFRANCHISE DRIVING PRECISION CARE INNOVATION • At nexus of care pathways ... integrated tech, solutions, data complemented by higher-margin services • Powerful secular growth drivers: aging population, chronic disease, emerging markets • Trusted partner with strong global presence DRIVING OPERATIONAL PERFORMANCE USING LEAN • Focus on fundamentals to accelerate top & bottom-line growth • Increased investment in pipeline and R&D productivity • Margin expansion leveraging lean and continued strong FCF* generation PLANNED SPIN-OFF ENABLES GROWTH ACCELERATION ON BOTH TOP AND BOTTOM LINE • Optimized organization ... enables speed, agility, customer focus • Focused investments in markets where we lead with expansion into higher-value franchises • Strong global franchise, favorable market fundamentals, continued tuck-in M&A * Non-GAAP Financial Measure Source: March 2022, Investor Day
  • 20.
    MARKET NEEDS Enabling precisioncare ... built around patient and customer Leading innovator enabling personalized and precision care through integrated clinical care, connected technology, and data across patient journey Improving lives in the moments that matter, for both patient and caregiver 20 Health system efficiency & access • Demand for efficiency & flexibility where care is delivered • Cost-effective products to increase access Digitization of health • More precise diagnostics, better interoperability, improved workflow • Seamless integration of artificial intelligence to improve outcomes Improved outcomes • Specific data insights to make informed decisions • Advancements in diagnostics, monitoring, & therapeutics Underpinned by more resilient, sustainable practices and products, while growing access to care Source: March 2022, Investor Day
  • 21.
    21 GE HealthCare: 2021by the numbers Installed base 4M+ (a- Service, PDx and Digital (b- FCF conversion*: segment FCF* / segment net income, adjusted to include non-GAAP restructuring expense Patients served annually 1B+ FCF conversion*-b) >100% Reported margins 16.7% Employees 48K Businesses with leading industry positions 4 Digital apps 200+ Outside U.S. revenue 55%+ Procedures per year 2B+ Equipment Services-a) $9B $9B R&D ~$1B Countries served 160 * Non-GAAP Financial Measure Revenue ~50% services-a) $18B Source: March 2022, Investor Day
  • 22.
    Highlights over thelast year EXPANDING OUR PLATFORMS BK Medical Acquisition Expanding Ultrasound portfolio with advanced surgical visualization and navigation INNOVATING FOR GROWTH 22 Zionexa Acquisition Enables more targeted treatment for metastatic breast cancer patients SIGNATM Hero RevolutionTM Apex Vscan AIRTM CARESCAPE ONE Command Center AMX NavigateTM with Critical Care Suite 2.0 StarGuideTM AIRTM Recon DL Source: March 2022, Investor Day
  • 23.
    Convergence of careto deliver precision care MARKET DRIVERS • The volume of healthcare data continues to grow… 50 petabytes​ of data per hospital​, 36% data growth per year​ • Healthcare systems increasingly seek to merge clinical medicine with data science • Need to aggregate and integrate data—imaging, genomic, and proteomic—for better insights Imaging, diagnostics, and genomic data to customize care plans DIAGNOSTICS THERAPY Right therapeutics at right time ... enabled by diagnostics, imaging, guidance, and highly specific data MONITORING Enabling mobile visualization, care-team collaboration, and clinical decision support–in real time GE HealthCare is at the center of an ecosystem working toward precision care—better patient outcomes, productivity, and seamless workflow integration 23 Source: March 2022, Investor Day
  • 24.
    24 Industry leader in$84B global healthcare sector with strong secular tailwinds Business Segments FY21 Revenue-a) Ultrasound $3B Patient Care Solutions $3B Pharmaceutical Diagnostics $2B Imaging $10B Enterprise Digital Solutions-b) $1B Service & Repair-c) $6B (a – Healthcare Systems includes Imaging, Ultrasound and Patient Care Solutions (PCS) (b – Represents total Digital revenue included in HCS Imaging, Ultrasound and Patient Care Solutions figures above. (c – Service & repair revenue included in HCS Imaging, Ultrasound and Patient Care Solutions figures above ~50% Recurring Revenues ~50% Recurring Revenues Source: September 2022, Morgan Stanley Healthcare Conference
  • 25.
    HealthCare: Long termoutlook through the cycle HealthCare plans to deliver MSD revenue growth*-a) while expanding margin profile GE REVENUE GROWTH*-a) GE PROFIT MARGIN GE FCF CONVERSION*-b) High teens to 20% 100%+ MSD *Non-GAAP Financial Measure (a- Organic basis (b- FCF conversion*: segment FCF* / segment net income, adjusted to include non-GAAP restructuring expense 25 Source: March 2022, Investor Day
  • 26.
    Strong, global HealthCarefranchise delivering better outcomes for patients and customers 26 HealthCare: Revenue growth ~50% recurring revenues 2022F  Market growth and positive dynamics  Need for precision care  R&D technology investment & innovation  Therapy and surgery solutions  Go-to-market and care pathways * Non-GAAP Financial Measure Organic Growth 2020 2021 Orders 1% 10% Revenue* 4% 1% 2023F- a ) MSD*-b) As of March Outlook LSD-MSD*-b) Updated 2Q’22: MSD (a- Pre-spin (b- Organic basis Source: March 2022, Investor Day Updated: 2nd Quarter Earnings, July 2022
  • 27.
    Opportunity over timeto evolve margin profile and address critical patient needs 25 HealthCare: Margins  Footprint and portfolio optimization  Lean enabled productivity  Pricing discipline / inflation management  Tuck-in M&A  Recurring services & software growth Organic 2020 2021 Margin Expansion* 190bps 70bps Decentralized operating structure 25-75+ bps OMX*-b) $3.0B - $4.0B profit As of March Outlook Updated 3Q’22: $2.6B+ profit * Non-GAAP Financial Measure (a- Pre-spin (b- Organic basis 2022F 2023F- a ) Source: March 2022, Investor Day Updated: 2nd Quarter Earnings, July 2022 Updated: 3rd Quarter Earnings, October 2022
  • 28.
    Enhanced capital allocation& strategic flexibility to enable growth 28 HealthCare: Free cash flow*  Investment-grade credit rating  Profitability & ROI focus  Working capital management  CAPEX investment for growth  Disciplined M&A Ex-BioPharma 2020 2021 FCF*-b) $2.7B $2.7B FCF Conversion*-b) >100% >100% Improving operational linearity Updated 3Q’22: $2.1B - $2.3B Up >100% conversion*-b) As of March Outlook (b- FCF* excludes prior period CFOA impact from discontinued factoring programs. FCF conversion*: segment FCF* / segment net income, adjusted to include non-GAAP restructuring expense * Non-GAAP Financial Measure (a- Pre-spin 2022F 2023F- a ) Source: March 2022, Investor Day Updated: 2nd Quarter Earnings, July 2022 Updated: 3rd Quarter Earnings, October 2022
  • 29.
    NEUROSURGERY & SPINEGENERAL SURGERY UROLOGY • Active imaging solutions to provide surgeons with real-time critical information so that they can deliver faster, more personalized care • Strategic, highly complementary addition to growing, profitable Ultrasound business • Expands GE HealthCare beyond diagnostics into surgical and therapeutic interventions, as well as minimally invasive & robotic surgery 29 BK Medical: entry into operating room with surgical navigation Better care. Faster surgeries. Real-time intraoperative imaging platform for neurosurgery Continuous surgical guidance and advanced visualization Enhanced care for intervention Ultrasound meets surgery with real-time surgical visualization Not all products or features are available in all geographies Source: March 2022, Investor Day
  • 30.
    US & Canada ~$7billion 7,200 FTs-a) EMEA ~$5 billion 5,800 FTs China ~$3 billion 3,400 FTs Intercontinental ~$3 billion 4,500 FTs Manufacturing sites Key R&D locations 2021 GE HEALTHCARE LOCAL, GLOBALLY Global sales force >10,000; 1,500 channel partners to expand our reach; and 8,000 field engineers INTEGRATED SUPPLY CHAIN Strong global commercial regions with 41 manufacturing sites delivering quality products and enabling world-class customer experience INNOVATION CLOSE TO CUSTOMERS R&D at >20 locations in 8 countries 30 2021 GE HEALTHCARE REVENUE (a- Field Team Trusted partner with strong global presence Includes ~50% services revenue Source: March 2022, Investor Day
  • 31.
    HealthCare: China ROBUST GROWTHSTRATEGIC THEM ES POSITIONED TO WIN IN CHINA HIGHLIGHTS $2.7B 2021 revenue ~7,000 Employees 5 Plants Imaging, U/S, LCS & PDx Leader CT, MI, PET-MR, U/S, PDx Manufacturing locally for 30+ Years Data sources: third party estimates LOCALLY- MADE • Agile supply chains meeting local policy requirement LOCAL INNOVATION • Speed to market and meet unmet needs in China LOCAL PARTNERSHIP • Building Precision Care + Digital Eco- system 31 Source: March 2022, Investor Day
  • 32.
    Operating layer • “Connectonce” with operating layer, on premise or cloud, single interface, common viewing tools, secure integration to data sources including EMR. Artificial intelligence engine • Machine learning tools enable AI development, orchestration engine to invoke existing AI algorithms in clinical workflow Development platform • Tools for GE and third-party developers to accelerate development of clinical workflow and AI-enabled apps Enterprise data optimizer • Multi-modal data aggregation, data transformation, and processing for clinical and operational insights Edison™ Digital Health Platform Designed to enable better patient outcomes, productivity, and seamless workflow integration 1 3 4 2 EDISON DIGITAL HEALTH PLATFORM Flexible, data aggregator to improve clinical insights, reduce IT burden and increase productivity 32 2021 total healthcare digital revenue of ~$1B including Edison Apps, Command Center & Enterprise Digital Solutions Source: March 2022, Investor Day
  • 33.
    33 AIR™ Recon DL ~600 Global installations ~1,000,000 estimatedpatients scanned with AIR™ Recon DL* >10 Published journal articles HOW IT WORKS? • MR raw data acquisition complicated ... significant errors due to noise • Deep-learning fills in and corrects raw data quickly and accurately AIR™ RECON DL • Advanced MRI image quality • Sharp, clear, accurate images provide reliable diagnosis for clinicians • Improved MRI experience for patients … scan time reduction of up to 50%-a) Conventional *calculated by IB data with estimation 20 scans per day, 5.5 working day in a week, fully start using AIR™ Recon DL 4 weeks after delivery. (as of Jan 2022) Not all products or features are available in all geographies (a – GE HealthCare data on file Source: March 2022, Investor Day
  • 34.
    GE HealthCare CommandCenter REAL-TIME INSIGHT MAKES CARE MORE EFFICIENT • Real-time patient overview & predictive suggestions • Up to 500K messages a day in typical setting • 300+ hospitals globally • Reduced length of stay-a) • Increase bed & OR utilization-a) • Reduced code blues-a) • $40M efficiency savings over ~1 year-b) Credit: AdventHealth Mission Control, Orlando, FL 34 (a- (b- data from hospitals including Johns Hopkins, Tampa General, OHSU, Humber Tampa General Press Release, https://www.tgh.org/news/tgh-press-releases/2020/october/tampa-general-hospital-and-ge-healthcares-carecomm-saves-40-million-cuts-20000-excess-days-and Source: March 2022, Investor Day
  • 35.
    Summary • Global franchisedriving precision care innovation to address critical patient/clinical challenges • Driving operational performance using lean leading to higher growth, continued margin expansion and FCF* generation • Spin-off: excellent opportunity to optimize organization for speed and agility, building faster growth profile through portfolio focus and M&A 35 *Non-GAAP Financial Measure Source: March 2022, Investor Day
  • 36.
  • 37.
    Vernova: Key messages 37 POWERON TRACK FOR STABLE EARNINGS AND CASH GENERATION • Completing Gas turnaround … steady demand & services growth, lean taking hold • Steam strategic pivot on track … primarily services go-forward RENEWABLE PORTFOLIO POSITIONED FOR GROWTH; FOCUSED ON RUNNING THE BUSINESSES BETTER • Resetting underwriting perimeter and cost-structure for Onshore Wind … while scaling lean • Focus on Haliade-X execution • Serving grid modernization needs … operational improvements and investing for growth CREATING CAPACITY TO INVEST AND INNOVATE FOR GROWTH AND DECARBONIZATION • This decade of action: Haliade-X, Opus One, HAs, Aero • Future decades at scale: SMR, CCUS, H2 Charles McKinney, Assembler, Greenville SC stands in front of a 7HA gas turbine Source: March 2022, Investor Day
  • 38.
    38 • Electricity generationgrowing ~50% by 2040 • ~13 gigatons of carbon emitted by the Power sector • ~800 million people without access to electricity • $10-15 trillion investment required over ten years-a) (a – IEA World Energy Investment 2021 Electricity Sector Investment … STEPS ‘21-’25 + SDS to NZE ‘26-’30 The opportunity to grow and decarbonize the energy sector is large … solving for sustainability, reliability, and affordability Excited to integrate the world’s most diverse power, renewable, and digital portfolio together to solve the energy trilemma Source: March 2022, Investor Day
  • 39.
    39 Vernova: 2021 bythe numbers Wind turbines installed in more than 35 countries 52K 220m World’s electricity generated with the help of our technology 1/3 Backlog-a) $106B World records held for combined cycle efficiency 2 R&D investment ~$1B Employees-a) 70K Global T&D utilities served by our software 30% EFS-enabled orders $7B Gas turbines installed… world’s largest fleet 7K Revenue-a) ~44% services Equipment Services $18B $14B Haliade-X rotor size Position in U.S. wind installs-b) #1 (a – Power and Renewable Energy, excluding Digital and EFS (b – Source: American Clean Power Association $33B Source: March 2022, Investor Day
  • 40.
    Vernova: Highlights overthe last year 40 Dogger Bank C Haliade-X Ocean Wind Haliade-X Pattern Energy 2 MW turbines Invenergy 2 MW turbines Pulau Indah 9HA GT Guangdong 9HA GT H2 blended Tongyeong 7HA GT Aero LM2500Xpress in Colorado 225 kV substation in Senegal HA fleet 1M hours Haliade-X prototype at 14MW 1st HA repair at Singapore facility Grid Digital ADMS release Opus One acquisition Agreement to sell part of Steam Power’s Nuclear activities LEADING THE ENERGY TRANSITION HYDROGEN RENEWABLES CCUS NUCLEAR GRID DIGITAL SF6-free switchgear in Norway DOE awards $5.7M FEED study AI enabled Autonomous Tuning to reduce CO2 BWRX-300 SMR selected for OPG Australia’s first gas and hydrogen plant Blade recycling agreement established Fleet & Portfolio Milestones Key Commercial Wins Source: March 2022, Investor Day
  • 41.
    Global sectors Energy sectorswhere we operate Grid T&D hardware and software Gas, Steam, Nuclear, Hydro Onshore and Offshore Stable baseload; zero-carbon pathways for gas (H2, CCUS) Electricity growth with zero- carbon; policy and capital Modernization of the grid, remote grid play GE ‘21 revenue, % services-b) ~$17B, ~70% ~$12B, ~15% ~$5B-c), ~20% Sector CAGR ’21 - ’30-a) LSD HSD MSD/HSD Sector size ’21-a) ~$100B ~$70B ~$60B (a – GE Estimate of Served Available Segment, Capex and services (b – GE revenue represents best approximate sector view & does not include eliminations (c- Including Power Conversion and GE Digital - Grid Software revenue ELECTRIFICATION CONVENTIONAL POWER WIND Leading position in ~$230B global energy sector where we operate… complementary portfolio of GE technology to grow & lead energy transition 41 Source: March 2022, Investor Day
  • 42.
    42 Vernova: Long-term outlookthrough the cycle Stable margins, strong FCF* from Power funding profitable growth in Renewables and Digital GE REVENUE GROWTH*-a) GE PROFIT MARGIN GE FCF CONVERSION*-b) HSD 80-90% LSD *Non-GAAP Financial Measure (a- Organic basis (b- FCF conversion*: segment FCF* / segment net income, adjusted to include non-GAAP restructuring expense Source: March 2022, Investor Day
  • 43.
    Power financials Organic revenue growth* Free cash flow*-b) 20212022F 2023F KEY DRIVERS *Non-GAAP Financial Measure (a- Organic basis (b- FCF* excludes prior period CFOA impact from discontinued factoring programs. FCF conversion*: segment FCF* / segment net income, adjusted to include non-GAAP restructuring expense On path to HSD margin, $1-2B profit in ’23 … stable, reliable cash growth from earnings LSD $16.9B, (4)% $1.2B Op margin, Op profit 4.3%, $0.7B HSD, $1-2B Up, $1.0-1.2B Up, > 150% conversion Up, > 100% conversion LSD  Gas Power: Revenue up LSD*-a) with DD margins by ’23 … services installed base, aero growth, lean  Steam Power: Transforming to services focused business … $1B+ revenue, DD margins by ’24  Power Conversion: HSD*-a) revenue growth, MSD margins in ‘22  Nuclear: Stable topline, investing in SMR  FCF* driven by earnings growth in all business, lower steam coal-exit impact, and working capital improvements (Inventory, Contract assets) 43 Source: March 2022, Investor Day As of March Outlook As of March Outlook As of March Outlook Updated: 2nd Quarter Earnings, July 2022
  • 44.
    0.0 0.5 1.0 1.5 2.0 2.5 '19 '20 '2122 '23 Gas Power: Installed base foundation • Demand growth supporting REN penetration increase • ‘21 orders > $1B … deliveries ramping from ‘22 onwards AERO EQUIPMENT • 134 units ordered; 66 COD, most units running baseload … services billings ~$1B/yr by mid-’20s • Major outages ~4 yrs. post COD, billings stream growing w/ hours HAs • Expect LSD growth in global gas- based generation electricity • Strong GE fleet utilization … MWhrs growth outpacing market INSTALLED BASE -12% -7% -2% 3% 8% 3Q'20 4Q'20 1Q'21 2Q'21 3Q'21 4Q'21 GE MWhrs utilization … quarterly y/y Gas-generation demand … quarterly y/y 0 20 40 60 '20 '21 '22 '23+ Aero unit shipments Aero unit shipments projected HA operating hours (MM) HA operating hours projected (MM) 7,000+ GTs … almost double the nearest peer installed base … service, HA & Aero opportunities ahead 44 Source: March 2022, Investor Day
  • 45.
    45 Gas Power: CarbonSolutions CARBON CAPTURE & STORAGE (CCS) • Clear role of CCUS in the energy transition • US has existing CO2 pipelines, developing pricing mechanisms, $12B funding passed in ‘21 Infra act • GE well positioned in this developing segment: • Largest IB … strong systems integration experience • Meaningful R&D and Intellectual property • Key FEED studies: US DOE with Linde 7Fs, UK BP and Net Zero Teesside 9HA with Technip • Middle East alliances … blue H2, ammonia GE’s installed base, alliances, research and experience are key to meaningful climate impact 7 H A 7F 7F 7HA 7F 7HA 7HA 7HA LM6 7F 7E Gas Turbine w/ CCS Direct Air Capture Gas Turbine w/ H2 Source: US Department of Energy, National Energy Technology Laboratory Source: March 2022, Investor Day
  • 46.
    • Gas turbinetechnology capable of H2 fuel combustion • Economics and availability are the challenges to be overcome for H2 use at scale today • Increasing customer requirements for GE solutions: • 8MM hours with H2 and H2-like fuels on 100+ GTs • Investing for 100% H2 by 2030 for new-unit customers, and retrofit/upgrades for installed base • Multiple new H2 projects w/ different GTs last 2 years 46 Gas Power: Hydrogen pathways HYDROGEN (H2) Cricket Valley will undertake a demonstration project, starting in late 2022, by running a 7F.05 turbines on a blend of natural gas with 5% “green hydrogen” by volume Customers planning and engaged now … GE roadmap for 100% H2 … ready for when fuel economics scale Source: March 2022, Investor Day
  • 47.
  • 48.
    48 Renewable Energy: Focusareas • Customer conviction to invest … onshore wind will recover … offshore, grid further acceleration in 2H of decade • Our teams exhibit great passion for technology, but can prioritize for better results • Heavier equipment mix business today, must size accordingly with premium on pricing and execution IN ITIA L O B SERVATIO N S • Simplify organization structure and reduce costs-a) • Accelerate underwriting selectivity, pricing actions • Focus on services growth where we can achieve scale • Industrialize maturing supply chains • Standardize lean across businesses … SQDC K EY A R EA S O F FO C U S Strong medium-term potential, focusing on prioritization and what we can control (a- no plans shall be finalized and/or implemented until the completion of appropriate engagement with works councils and/or other employee representatives as required in accordance with local law Source: March 2022, Investor Day
  • 49.
    Renewable Energy financialsInitiated on March 10, 2022 49 Organic revenue growth* Free cash flow*-b) 2021 2022F 2023F KEY DRIVERS (b- FCF* excludes prior period CFOA impact from discontinued factoring programs. FCF conversion*: segment FCF* / segment net income, adjusted to include non-GAAP restructuring expense Resetting the business for profitability and cash generation in ‘24 LSD Better but negative Op margin, Op profit $15.7B, (2)% $(1.2)B (5.1)%, $(0.8)B Updated 3Q: ~$(2)B Approaching breakeven MSD Approaching breakeven  Onshore Wind: Int’l selectivity & cost out tailwinds, NAM near term volume pressure  Offshore Wind: Ramping to ~$3B revenue by ’24 and profitability by mid-20’s … managing inflation headwinds  Grid: MSD revenue growth-a)*, significant profit improvement ’22; breakeven in ’23  FCF* driven by normalized progress as NAM markets stabilize and earnings improvement Updated 1Q: below previous range Updated 2Q: below prior year with additional pressure As of March Outlook As of March Outlook As of March Outlook Source: March 2022, Investor Day Updated: 2nd Quarter Earnings, July 2022 Updated: 3rd Quarter Earnings, October 2022
  • 50.
    50 113 171 2021 2025F 2027F 50 OffshoreWind INDUSTRY DYNAMICS PRIORITIES • Successful launch of Haliade-X: • Prototype operating for 28 months • First COD in mid-’23 … ongoing certification testing towards higher rating and serial production readiness • Manage cost, risk profile: localization, modularization • ~50 GW offshore capacity to grow at > 20% CAGR GW capacity scheduled & planned Source: WoodMac • Continue to accelerate growth: • ~$7B backlog today … shipping until mid-’25 • ~$120B+ industry pipeline from ‘23-’30 ~3x in 6 years Building towards ~$3B revenue business by ’24 and profitable in the mid-20’s • Investing in super-conducting generator: • Increase output, lower cost … reducing weight, rare- earth material risk; prototype in ‘23, US DOE backed • Significant MW growth of latest NPI’s … inflation pressures on raw materials Source: March 2022, Investor Day Updated: 3rd Quarter Earnings, October 2022
  • 51.
    - 5 10 15 20 '08 '09 '10'11 '12 '13 '14 '15 '16 '17 '18 '19 '20 '21 '22F Onshore Wind • Long-term demand intact … ~50 GW by mid-decade • EU commitments and Renewable Energy 100 • U.S. planning ~10 GW installs in ’22 and stabilizing INDUSTRY AND BUSINESS DYNAMICS PRIORITIES • NAM: Strengthening the core • New product innovation for medium-term opportunities • Driving price … DD% price in 4Q’21 NAM bids • Lean focus … logistics, installation and commissioning • Right-sizing cost-structure-c) • International: Selectivity to build profitable backlog • Strategic countries, defined strike-zone • DD% price in 4Q’21 int’l bids with inflation escalation • Lean focus … reduce waste, improve cost, execution • Services: DD profitable growth … 1,000+ turbines/year eligible for repower; digital solutions • NAM business: Well positioned and profitable today, near- term policy uncertainty, mid-term demand visibility strong Onshore Wind U.S. installations (GW)-b) Production Tax Credit Extension 51 (a- excluding China (b- source: Woodmac to ‘21, ‘22 GE forecast (c- no plans shall be finalized and/or implemented until the completion of appropriate engagement with works councils and/or other employee representatives as required in accordance with local law Managing market conditions, while running the business better … path to profitability in ‘24 • International business: Growing demand, challenged profitability and heavy cost structure F Source: March 2022, Investor Day Updated: 3rd Quarter Earnings, October 2022
  • 52.
    52 Onshore Wind: Leanfocus SAFETY Implemented Hierarchy of Controls standard work DELIVERY ↓ 40% Cypress installation time with standard work QUALITY Tiger teams + lean … 25% faster issues resolution – Integrating field feedback into design and supply chain COST transforming outbound logistics … eliminate 20% leakage Applying lean to drive operational improvement Source: March 2022, Investor Day
  • 53.
    53 Electrification sectors weoperate in GE ‘21 revenue-b) HSD MSD ~$8B ~$5B ~$0.6B ~$0.6B Products Control & Automation Relays, Gateways GIS & Network model, ADMS, EMS Sector CAGR ’21 - ’30-a) Sector ’21-a) HSD MSD ~$17B ~$25B ~$1.2B ~$1.5B Switchgear, Transformers HVDC, Substations MSD ~$6B ~$1B Rotating machines, Power electronics (a – GE Estimate of Served Available Segment, Capex and Services (b- GE revenue represents best approximate sector view & does not include eliminations (c – Reported in the Power segment today (d – Reported in Corporate/Digital today Complementary businesses … focused on running better to capture industry demand Grid automation Grid Software-d) Grid integrated solutions Grid Power transmission Power Conversion-c) Source: March 2022, Investor Day
  • 54.
    54 Electrification: Scaling ourbusinesses for profitable growth • Unique value by combining digital and hardware solutions • Investing in digital substations and renewables integration • Software for grid orchestration and asset management • Strategic bolt-on … Opus One • Targeting to grow > sector growth o Grid Automation growth accelerating … orders up MSD-a) in ‘21 & HSD-a) 2H’21 POSITIONING TO GROW GRID AUTOMATION AND SOFTWARE • Scaling Power Conversion play • Improving project execution performance of legacy projects • Selective growth … disciplined underwriting, services focus • Opportunity to reduce product & structural cost-c) to improve competitiveness TURNING AROUND GRID INTEGRATED SOLUTIONS & POWER TRANSMISSION • Inflection point reached in 2021 … stabilized operations • Driving growth: 3-prong approach … win/loss, NPIs, breakthroughs POWER CONVERSION-b) TURNAROUND ACCELERATING $0.9 $0.8 $1.0 2019 2020 2021 2022F HSD MSD% Sales (18)% 2% (13)% Op Profit % Driving turnarounds and investing for growth *Non-GAAP Financial Measure (a – Organic basis (b – reported in the Power segment today (c – no plans shall be finalized and/or implemented until the completion of appropriate engagement with works councils and/or other employee representatives as required in accordance with local law Source: March 2022, Investor Day
  • 55.
    7% 10% 83% 58% 12% 30% Energy transition: Marketsin focus CANADA ASIA Electricity demand today 12,700 TWh/y 650 TWh/y 7.7 Gigatons 0.1 Gigatons Power sector carbon emissions today zero-carbon gas coal/oil Nearly two-thirds of global power sector CO2 * IHS “inflections” scenario (their baseline outlook) Less than 1% of global power sector CO2 27,500 TWh/y 910 TWh/y Electricity demand in ’50* More than double today’s demand 40% above today’s demand 55 Asia … Decade of action to decarbonize while demand doubles Canada … Investing in breakthroughs for last ~15% to net-zero carbon Source: March 2022, Investor Day
  • 56.
    56 Vernova: Wrap • Theopportunity to grow & decarbonize the energy sector is large … solving for sustainability, reliability, and affordability • GE Power is on track … confident in our ability improve Renewables & Digital with the scaling of lean • Investing for long term with complete conviction in leading the energy transition … this decade and the decades that follow 3.6MW turbine - Markbygden Wind Farm Piteå, Norrbotten county N. Sweden Source: March 2022, Investor Day
  • 57.
  • 58.
    GE Aerospace: Keymessages 58 EXCEPTIONAL BUSINESS IN ATTRACTIVE COMMERCIAL AND MILITARY SECTORS • Strong, underlying equipment and services volume growth as market recovers • Focused portfolio with strong positions across businesses EMBRACING LEAN AND TECHNOLOGY TO DRIVE OPERATIONAL PERFORMANCE AND SERVICES GROWTH • Enterprise focus on safety, quality, delivery, and cost • Deploying technology to improve customer outcomes and reduce costs INVESTING IN SUSTAINABLE TECHNOLOGIES TO ENABLE THE FUTURE OF FLIGHT • Leveraging unique technology portfolio in existing products (CMC, additive) • Investing in breakthrough technologies (SAF, XA100, hybrid electric, hydrogen, open fan) GE Aerospace employee performs overhaul maintenance on a GE90 engine at the GE Celma Overhaul Facility in Brazil. Source: March 2022, Investor Day
  • 59.
    59 GE Aerospace: 2021by the numbers People flying at any given time on GE or JV-a) powered aircraft ~400K Reported margins 13.5% Commercial-b) & Military engines delivered 2K+ 88% 12% A GE or JV-a) powered aircraft takes off 2 seconds Every Free cash flow* $4.6B Passengers carried 1.5B Increase in shop visits 10% Total backlog $300B+ Revenue ~65% Services $21B Commercial & Military engines in service ~66K Commercial fleet with one or less shop visits Commercial flights powered by GE or JV-a) engines $8B $14B Services Equipment 3 out of 4 60% *Non-GAAP Financial Measure; FCF* excludes prior period CFOA impact from discontinued factoring programs (a – includes equipment made by CFM and Engine Alliance joint ventures (b – includes 900+ CFM/LEAP engines delivered by GE and Safran CFM is a 50/50 Joint Venture between GE and Safran Aircraft Engines; Engine Alliance is a 50/50 JV between GE and Pratt & Whitney Source: March 2022, Investor Day
  • 60.
    Highlights over thelast year $300B+ backlog (as of Dec 31st, 2021) OUR PORTFOLIO Commercial OE & Services wins Qatar GE9X – 777-8F Singapore GE9X Indigo LEAP-1A Akasa LEAP-1B Allegiant LEAP-1B Southwest LEAP-1B UPS & FedEx CF6 Military achievements F110 for F-15EX T700 services T408 demonstrator OUR FUTURE OF FLIGHT CFM RISETM XA100 testing Hydrogen Hybrid Electric 60 100% SAF flight-a) (a –100% sustainable aviation fuel on supplying one LEAP-1B engine CFM is a 50/50 Joint Venture between GE and Safran Aircraft Engines. RISE is a registered trademark of CFM. Source: March 2022, Investor Day
  • 61.
    Sector size ’21-a) SectorCAGR ’21 - ’25-a) ~$40B ~$15B ~$15B High-teens HSD LSD 61 Focused portfolio across large, growing businesses COMMERCIAL PROPULSION M ILITARY PROPULSION SYSTEMS Customer needs Demand drivers GE Aerospace ’21 revenue % services $14.4B >60% $1.6B ~50% $4.1B >70% • Equipment ramp readiness • Services capacity & material solutions • Lower carbon solutions • Fleet modernization • Faster development cycles • Aircraft electrification • Increased autonomy • Fleet renewal and expansion • Post-COVID return to travel • Strong US and int’l demand • New technology development • Increased aircraft production • Next-gen systems technologies (a- Source: GE industry estimates; Systems defined as electrical systems, avionics, and mechanical systems; Commercial Engines definition excludes turboprops Source: March 2022, Investor Day
  • 62.
    62 Strength in diversecommercial equipment installed base GE and JV-d) engines in operation with … (a-Source: Cirium Dec 31, 2021. Includes in-service and parked aircraft. (b-GE Aerospace estimate of total fleet growth including competitors (c- Widebody includes 508 Engine Alliance and 308 CFM engines (d- includes equipment made by CFM and Engine Alliance joint ventures CFM is a 50/50 JV between GE and Safran Aircraft Engines; Engine Alliance is a 50/50 JV between GE and PW WIDEBODIES-c) Sole-source 777, 747-8 Dual-source 747, 767, 787, A300, A330, A380 REGIONAL JETS Sole-source ARJ21 CRJ E170/190 Others Global fleet distribution (# of engines)-a) NARROWBODIES Dual-source A320ceo, A320neo families 89% Global lessors 73% Global airlines 74% Widebody freighters Leading positions for decades of continued new unit growth Sole-source 737 Classics 737 NG 737 MAX ‘22–’32 fleet CAGR-b) MSD Flat MSD Source: March 2022, Investor Day
  • 63.
    63 Commercial recovery drivingservices growth GE / CFM DEPARTURES (% of ’19 levels-a)) • Departure recovery driving ’22 shop visits up high-teens & organic services revenue growth* more than 25% • Strong utilization drives billings and cash higher WHAT IT MEANS FOR GE • Expect narrowbody traffic to recover later in ’23, widebody passenger by late ‘23 • Slow start in ‘22 due to Omicron … expect momentum to pick up based on customer confidence TOTAL DEPARTURES 0 20 40 60 80 100 120 140 Widebody (Passenger) Narrowbody Total Widebody (Freight) ’20 ’21 ’22F ’23F ’24F % Actuals Feb ’22 forecast *Non-GAAP Financial Measure (a- GE internal forecast as of February 2022 CFM is a 50/50 Joint Venture between GE and Safran Aircraft Engines 63 Source: March 2022, Investor Day Updated: 2nd Quarter Earnings, July 2022 Updated: 3rd Quarter Earnings, October 2022
  • 64.
    64 Systems: complements corebusinesses Flight management, open computing, displays, health and data monitoring Component supplier (electrical, mechanical, sensors) Focused on high-power civil & military turboprop applications Generation, distribution, conversion, and control of aircraft electrical power Expand civil & high voltage applications; airframe & propulsive electrification Autonomy and future platforms; AI & mission computing starting in military Developing ignition & sensor solutions for more sustainable aviation Next-gen commercial turbo- props; technology applied to CFM RISETM program T O D A Y F U T U R E Key technologies playing a central role to the future of flight ELECTRICAL POWER AVIONICS UNISON DOWTY PROPELLERS M A I N P L A T F O R M S F-35 F-18 AH64 777 Large biz jets 737 777X A320 C919 F-16 F-18 F-35 All major engine OEMs C-130J Saab 340 Dash 8/Q CFM is a 50/50 Joint Venture between GE and Safran Aircraft Engines. RISE is a registered trademark of CFM. Source: March 2022, Investor Day
  • 65.
    65 Military business positionedfor growth through ’25 CONTINUING TO WIN ON CORE PLATFORMS HSD TOPLINE GROWTH THROUGH ‘25 US DoD • F110 … US Air Force F-15EX • F404 … US Air Force T-7A • LM2500 … Constellation class frigate Key focus areas in 2022 • Improve supply chain delivery supported by lean • Intense focus on developing next generation technologies DEVELOPING NEXT GENERATION PRODUCTS Combat • XA100 … F-35 re-engine opportunity • Prototype in testing with US Air Force Rotorcraft • T901 … Apache & Black Hawk re-engine • T901 … Future vertical lift • T408 … US Marines CH-53K heavy lift = CAGR ‘20-’25 HSD revenue growth*-a) 2020 2021 2022F 2025F $4.6B $4.1B International • F414 … Korea KF-21 • F404 … India MkII Tejas • US equipment to allies Strong demand in a growing sector … focused on execution CFM is a 50/50 Joint Venture between GE and Safran Aircraft Engines *Non-GAAP Financial Measure (a- Organic basis Source: March 2022, Investor Day
  • 66.
    Aerospace financials 66 Op margin, Opprofit Organic revenue growth* Free cash flow*-b) 13.5%, $2.9B $21.3B, (3)% $4.6B 2021 Updated 3Q: high-teens >20% Implied 3Q: flat to slightly better 2022F High-teens, ~$6B >20% 2023F Up, 90%+ conversion KEY DRIVERS *Non-GAAP Financial Measure (a- Organic basis (b- FCF* excludes prior period CFOA impact from discontinued factoring programs. FCF conversion*: segment FCF* / segment net income, adjusted to include non-GAAP restructuring expense  Topline growth as recovery momentum continues … unprecedented demand ramp in OE & services with >25% high teens shop visit & organic revenue growth* in ‘22  Military recovery & growth on demand strength  Cost productivity through lean & improving LEAP learning curve while navigating negative mix  Improving working capital management & disciplined capital allocation  ’22 FCF* driven by profitable growth but impacted by allowance payment timing … growing back to greater than ’19 levels in ’23 Significant growth & margin expansion driving FCF* as recovery momentum continues Source: March 2022, Investor Day As of March Outlook As of March Outlook As of March Outlook Updated: 2nd Quarter Earnings, July 2022 Updated: 3rd Quarter Earnings, October 2022
  • 67.
    67 Aerospace: Long-term outlookthrough the cycle Positioned to win as commercial aftermarket recovers & military grows GE REVENUE GROWTH*-a) GE PROFIT MARGIN GE FCF CONVERSION*-b) High teens to 20%+ 90%+ MSD (higher near term) *Non-GAAP Financial Measure (a- Organic basis (b- FCF conversion*: segment FCF* / segment net income, adjusted to include non-GAAP restructuring expense Source: March 2022, Investor Day
  • 68.
    Aerospace’s next erabuilding on a decade of product renewals CF6 CFM56 GE90 CF34 Regional workhorse Legacy Next generation Future of flight GEnx 15% better fuel efficiency vs. CF6 LEAP 15% better fuel efficiency vs. CFM56 GE9X 10% better fuel efficiency vs GE90 Passport 17%+ better fuel efficiency vs. CF34-3 CFM RISETM >20% efficiency vs. today’s engines Hydrogen demonstrator Hybrid-electric demonstrator (1980s to 2050s) (2010s to 2070s) (2030s to 2090+) 68 Source: March 2022, Investor Day
  • 69.
    2019 2020 20212022F 2023F 2024F 2025F LEAP CFM56 69 Commercial equipment PRODUCTION RAMP POST-COVID # o f L E AP & C F M 5 6 S h i p m e n t s LEAP NEW ENGINE PRODUCT COST Av e r a g e c o s t p e r u n i t • Ready for ramp … hard capacity in place, building back skilled labor, partnering with supply base • Aligned with airframers on production rates through ‘23 • Commercial equipment revenue growth*-a) 20%+ trending below 20% in ’22 • Improving productivity post COVID slowdown • ~(3) pts Aerospace margin impact in ’22 & ’23 driven by CFM56/LEAP transition … improvement as approach op margin breakeven in ’25 • 9X volume and mix meaningful post 777X entry into service Production ramp to support customers and driving revenue growth ~2,000 2,000+ 845 815 2,000+ 1,736 1st unit ’25F Breakeven no later than ‘25 44% cost out (’16-’21) CFM is a 50/50 Joint Venture between GE and Safran Aircraft Engines ’21 *Non-GAAP Financial Measure (a- Organic basis Source: March 2022, Investor Day Updated: 2nd Quarter Earnings, July 2022
  • 70.
    '19 '20 '21'22F '23F '24F '25F 70 Commercial services shop visit growth through the decade Significant volume driving revenue and profit growth Regional aircraft (CF34 variants) Narrowbody aircraft (CFM56 variants) LEAP Widebody aircraft (GEnx, GE90, CF6, GP) ~5.4k 0 ’25+ Growth # SV SHOP VISITS GROWING >25% HIGH TEENS IN ’22 BASED ON AIRCRAFT USAGE Driving lean to create capacity, improve operational performance • 20% turnaround time reduction in Celma, Brazil overhaul shop • Transitioned 550+ repairs to overhaul shops improving on time delivery and logistics costs Unique open GE and external MRO footprint READY FOR GROWTH • 80+ locations-a) available to service worldwide shop visit demand • Open network encourages investments … increasing flexibility for operators (a- includes 6 GE overhaul facilities CFM is a 50/50 Joint Venture between GE and Safran Aircraft Engines Source: March 2022, Investor Day Updated: 2nd Quarter Earnings, July 2022
  • 71.
    71 Aftermarket services throughthe engine lifecycle Source: Cirium, Dec 31, 2021. Excludes aircraft in storage. (a- Includes CFM engines Delivering flexible material solutions to keep the fleet flying longer ~50% of CFM56 engines have not seen 1st SV No SV 1 SV 2+ SV CFM56 SVs peak later in the decade ~19,100 CFM56 engines in service-a) CFM56 ENGINES Typical narrowbody shop visit content SV1 SV2 SV3 Workscope flexibility Typical widebody shop visit content SV1 SV2 SV3 No SV 1 SV 2+ SV ~60% of widebody engines have not seen SV2 Expecting MSD SV growth through 2025 WIDEBODY ENGINES Industrializing repairs • ~13,000 repairs in the catalog today • Developing +500 more repairs annually ENABLING WORKSCOPE FLEXIBILITY ~6,500 total widebody engines in service-a) Material solutions • Largest USM provider • 20+ years experience Average content CFM is a 50/50 Joint Venture between GE and Safran Aircraft Engines Source: March 2022, Investor Day
  • 72.
    Combining lean withtechnology to drive service productivity CFM is a 50/50 Joint Venture between GE and Safran Aircraft Engines ON-WING TECHNOLOGY AI ENABLED INSPECTIONS ADDITIVE REPAIR >50% Cycle time reduction ~10,000 Field applications by 2025 ~80% Cycle time reduction CUSTOMER BENEFITS Accelerate component workflow through the shop with digital & lean Keep engines on- wing longer Enable high speed precision repair Helping operators improve fleet utilization through faster turnaround time CFM HPC blade 72 360 Foam Wash Blade Tip Repair Source: March 2022, Investor Day
  • 73.
    73 Commercial Services revenuetrajectory $9B 2021 2023F 2022F • Revenue outpacing shop visit volume • Volume key driver … shop visit growth >25% of high-teens in ’22, strength in ’23 with growth across all product lines • Catalog price evolution consistent with recent history • Content increases in ’23 as engines progress through lifecycle … widebody volume driving higher revenue/SV • Widebody ~40% & narrowbody ~50% of total services revenue in ’22 & ’23 GROWTH DRIVERS $8B 2020 >25%*-a) Supporting demand through lean & technology productivity Growth in volume, price, content/mix $15B 2019 *Non-GAAP Financial Measure (a- Organic basis Source: March 2022, Investor Day Updated: 2nd Quarter Earnings, July 2022
  • 74.
    74 ADVANCED AERODYNAMICS Lighter, thinner compositefan blades improve efficiencies Innovation is in our product DNA CERAMIC MATRIX COMPOSITES Lighter & increased durability through higher heat resistance than alloys MANUFACTURING TECHNOLOGIES Additive simplifies architecture, reduces weight & improves fuel efficiency GE90-94B composite fan blade introduced 1995 GE9X composite fan blade certified 2020 Combustor Additive Catalyst engine inlet frame New generation of more fuel-efficient aircraft engines in every thrust class made possible by breakthrough technologies and materials CFM is a 50/50 Joint Venture between GE and Safran Aircraft Engines. RISE is a registered trademark of CFM. Source: March 2022, Investor Day
  • 75.
    75 ELECTRIFICATION • 1st MWhybrid-electric system demonstrated at altitude conditions-a) • Development partnership with NASA and Boeing Breakthrough technology demonstrators ALTERNATIVE FUELS • Partnership with Airbus to flight test hydrogen-powered engine • Sustainable Aviation Fuel compatibility and advocacy Ground & flight tests to show technology readiness this decade CFM is a 50/50 Joint Venture between GE and Safran Aircraft Engines. RISE is a registered trademark of CFM. (a- Altitude conditions up to 36,000 feet ADVANCED ARCHITECTURE • CFM RISETM: Open fan, compact core, hybrid-electric technology • Greater than 20% fuel efficiency vs. today’s engines ADAPTIVE CYCLE • Best of both worlds … switching between high thrust and efficiency • 10% more thrust and 25% better fuel efficiency vs. today’s engines Source: March 2022, Investor Day
  • 76.
    Summary 76 • Exceptional businessin attractive commercial and military sectors • Embracing lean and technology to drive operational performance & services growth • Investing in sustainable technologies to enable the future of flight World-leading business … executing on unprecedented ramps GE flying testbed with GE9X engine Source: March 2022, Investor Day
  • 77.
  • 78.
    GE’s financial priorities Disciplinedcapital allocation • CapEx & M&A processes (AerCap, BK Medical) Balance sheet improvements • Reduced gross debt by $87B over 3 years • W/C management & factoring discontinuation • Improved linearity ... reduced peak cash needs • Generated nearly $6B of Industrial FCF*-a) in ‘21 Driving sustainable, high quality earnings & FCF* growth Structural improvements • Daily management • Lean monthly close • Nearly 30 operational P&Ls • Commercial & M&A underwriting • Simplified reporting * Non-GAAP Financial Measure (a- Excludes prior period CFOA impact from discontinued factoring programs of $(0.7)B 78 Cash flow grow th • Working capital & CapEx efficiency • 100%+ FCF conversion* Profit grow th • Productivity & restructuring • Commercial selectivity • Price/cost Revenue growth • Commercial execution, services strength • NPIs, technology breakthroughs SUBSTANTIAL PROGRESS FOCUS AREAS 1 2 3 4 Source: March 2022, Investor Day
  • 79.
    79 … driven byprofitable volume growth in 2022 Updated 1Q: trending to low end Equipment Services • All businesses growing ... Aerospace recovery continues • Backlog strength from ‘21 orders... ~ of revenue in hand • Services growth outpaces equipment ... mix headwind from NPIs (LEAP, HAL-X) • Managing supply constraints HSD organic growth* supported by market fundamentals with ~2/3 backlog in hand 2022 DYNAMICS * Non-GAAP Financial Measure 2021 Adj. revenue* $71B $34B $37B 2022F Adj. revenue* ~$76B ~$36B ~$40B Aerospace Commercial Services NPIs (Aerospace CEO, Renewables OFW) Gas Power Services HealthCare Aerospace Military Source: March 2022, Investor Day
  • 80.
    80 Targeting ~$2B grosscost out in ‘22 through productivity, restructuring & sourcing actions ~$68B-a) adjusted cost Direct material SG&A + R&D ~$29B ~$25B $14B Labor & overhead Cost of sales (a- 2021 actuals, cost excluding NCI and EFS benefit from taxes (b- Some plans may be subject to the outcome of legally mandated information & consulation with employee representatives Direct material • Sourcing actions: Best cost, nearshore & dual sources • Value analysis & value engineering of components … should-cost deployment Labor & overhead-b) • Standard work & waste removal to drive outage/cycles efficiency & factory rationalization • Product reliability with systematic root-cause analysis … focus on suppliers’ quality and design for durability Operating expense-b) • Organizational streamlining, decentralization • Strategic refocusing ACTIONS WE’RE TAKING TO DRIVE COST OUT Cost out Source: June 2022, Bernstein SDC
  • 81.
    Creating three global,investment-grade companies positioned to drive shareholder value Stronger balance sheet enables GE to play offense NET DEBT*-a) *Non-GAAP financial Measure (a – Includes bonds, 100% of preferred equity and 100% of cash. (b – Based on today's portfolio of business including Aerospace, HealthCare, Renewables & Power Net debt*-a) <1.0X Pref $6B Bonds $35B Cash $16B Bonds & Pref ~$20B Cash ~$10B $25B Net debt* / EBITDA-b) 3.3X ~$10B GO FORWARD STRATEGY 81 GO FORWARD CAPITAL ALLOCATION STRATEGY • Evaluating opportunities that increase growth, earnings & FCF*  Organic: R&D, CapEx  Restructuring  Inorganic: acquisitions & dispositions • Planned standalone investment-grade companies will establish go forward financial policies tailored to strategic & financial objectives • Board recently authorized share repurchase up to $3B 2021 2023F Source: March 2022, Investor Day
  • 82.
    GE positioned tocreate value today 82 Strong franchises Being run better for the long term, today Delivering better results for shareholders, today and tomorrow We rise to the challenge of building a world that works Source: March 2022, Investor Day
  • 83.
  • 84.
    GAAP 2020*** 2021***YoY Total Revenues $75,833 $74,196 (2)% Cash from Operating Activities (CFOA) $1,025 $888 $(137) Profit $5,970 $(3,683) U Profit Margin 7.9% (5.0)% (1,290) bps Continuing EPS (diluted) $5.46** $(3.25) U Non-GAAP* 2020*** 2021*** YoY Adjusted Revenues 72,969 71,090 (3)% Organic Revenues $71,589 $70,125 (2)% Free Cash Flow (FCF) $635 $1,889 $1,254 FCF Ex. Disc. Factoring Industrial FCF Ex. Disc. Factoring $3,996 $2,628 $5,831 $(1,368) $1,835 Adjusted Profit $2,246 $4,608 F Adjusted Profit Margin 3.1% 6.5% 340 bps Adjusted EPS (diluted) $(0.07)** $1.71 F 84 2021 Performance Metrics Dollars in millions; except per-share amounts *Non-GAAP Financial Measures. Please see the Non-GAAP Financial Measures section on pages 21-22 and 32-34 of the Management’s Discussion and Analysis within our 2021 Form 10-K for explanations of why we use these Non-GAAP measures. The reconciliations to the most comparable GAAP financial measures are found in the appendix of this document. **Restated to account for the 1-for-8 reverse stock split which occurred after market close on 7/30/21 ***Financial measures now on one-column basis Source: GE 4th Quarter 2021 earnings, January 2022 and Form 10-K for 2021
  • 85.
    Slightly better y/y,from $(1.2)B in ‘21 Updated 2Q’22: Expect to be below $(1.0)B for the year 85 ~$(1.5)B expense & cash INTEREST EXPENSE TAXES Adjusted tax rate* low to mid-twenties; cash taxes more closely aligned with book taxes; excludes impact of separation-related taxes ADJ. CORPORATE COSTS* SEPARATION COSTS Expect ~50% of total separation costs (~$2B) excluding tax cost; cash lagging expense NON-OP. BENEFIT COSTS Slightly positive driven by lower amortization of historical losses & investment gains PREFERRED DIVIDENDS Expense recorded within adjusted EPS* … LIBOR + 333bps BKR/AER STAKES Mark-to-market remaining investment; any impact treated as non-GAAP EPS adjustment INSURANCE Expecting stable performance, lower COVID favorability RESTRUCTURING Total expense & cash flat to slightly up; in-segment expense down Other 2022 guidance items *Non-GAAP Financial Measure Source: March 2022, Investor Day Updated: 2nd Quarter Earnings, July 2022 Updated 3Q’22: Expect to be below $(0.7)B for the year Updated: 3rd Quarter Earnings, October 2022
  • 86.
    86 GE full-year 2022outlook: Updated 3Q~$4.5B FCF* *Non-GAAP Financial Measure Total Company Aerospace HealthCare Renewable Energy Power Organic Revenue* High-single-digit growth >20% growth Low- to mid-single- digit growth Low-single-digit growth Low-single-digit growth Adjusted Profit Margin* 150+ bps organic expansion Mid-teens 25-75 bps organic expansion Better, but negative Up Adjusted Profit* $6.0B – $7.0B $3.8B – $4.3B $3.1B – $3.3B $(0.7)B – $(0.5)B $1.0B – $1.2B Adjusted Earnings per Share* $2.80 – $3.50 Free Cash Flow* $5.5B – $6.5B Down slightly Up, >100% free cash flow conversion* Better, but negative Up, >150% free cash flow conversion* Updated 1Q: below previous range Updated 3Q: ~ $(2)B Updated 1Q: below previous range Updated 2Q: below prior year and facing additional pressure Source: March 2022, Investor Day Updated 2Q: MSD Updated 2Q: below implied Updated 3Q: $2.1B - $2.3B Updated 3Q: +$2.6B Updated 2Q: further decline Implied 3Q: flat to slightly better Updated: 2nd Quarter Earnings, July 2022 Updated: 3rd Quarter Earnings, October 2022 Updated 3Q: high-teens Updated 3Q: above prior range Updated 2Q: Trending to low-end Updated 3Q: 125 – 150 bps Updated 3Q: $2.40 - $2.80 Updated 2Q: ~4.5B Updated 2Q: trending to low- end
  • 87.
    87 2021 Free cashflow* details ($ in millions) 2021 1Q'21 2Q'21 3Q'21 4Q'21 Total Company Aerospace HealthCare Renewables Power Corporate Net earnings (loss) ex insurance* — (0.8) 0.5 (3.6) (3.8) 2.3 2.3 (0.7) 0.6 (8.3) Debt extinguishment costs — 1.4 — 5.1 6.5 — — — — 6.5 Depreciation & amortization 0.8 0.8 0.7 0.8 3.0 1.1 0.6 0.4 0.7 0.2 Operating working capital-a)-b) (0.9) 0.1 (0.1) 2.3 1.3 1.0 0.2 (0.2) 0.6 (0.2) Other CFOA-c) (2.8) (1.0) 0.5 (0.5) (3.8) 0.4 (0.2) (0.5) (0.7) (2.8) Gross capex (0.4) (0.3) (0.3) (0.4) (1.4) (0.5) (0.2) (0.4) (0.2) — FCF* (3.4) 0.2 1.3 3.7 1.9 4.3 2.7 (1.4) 0.9 (4.7) Disc. factoring cash flow impact-d) (0.8) 0.1 — — (0.7) (0.3) — (0.2) (0.2) — FCF ex. disc. factoring* (2.6) 0.1 1.4 3.7 2.6 4.6 2.7 (1.2) 1.2 (4.7) * Non-GAAP Financial Measure (a – Excludes CFOA impact from factoring programs discontinued as of April 1, 2021 and November 9, 2021 (b – Excludes CFOA impact from receivables factoring and supply chain finance eliminations (c – Aggregates the following: (Gains) losses on sales of business interests, (Gains) losses on equity securities, principal pension plans (net), other post retirement benefit plans (net), income taxes (net), and all other operating activities; excludes deal taxes, GE Pension Plan contributions and Goodwill impairments (d - Discontinued factoring cash flow impact for the prior year 2020 were $(3.4)B split by Q1'20 $(1.4)B, Q2'20 $(1.0)B, Q3'20 $0.4B, Q4'20 $(1.4)B Source: GE 4th Quarter 2021 earnings, January 2022
  • 88.
  • 89.
    89 Organic revenues, profit(loss) and profit margin by segment * Non-GAAP Financial Measure We believe these measures provide management and investors with a more complete understanding of underlying operating results and trends of established, ongoing operations by excluding the effect of acquisitions, dispositions and foreign currency, as these activities can obscure underlying trends. ORGANIC REVENUES, PROFIT (LOSS) AND PROFIT MARGIN BY SEGMENT (NON-GAAP) REVENUES PROFIT (LOSS) PROFIT MARGIN (Dollars in millions) 2021 2020 V% 2021 2020 V% 2021 2020 V pts Aerospace (GAAP) $ 21,310 $ 22,042 (3)% $ 2,882 $ 1,229 F 13.5 % 5.6 % 7.9pts Less: acquisitions — — — — Less: business dispositions — 48 — (48) Less: foreign currency effect 21 — (18) — Aerospace organic (Non-GAAP) $ 21,289 $ 21,994 (3)% $ 2,900 $ 1,277 F 13.6 % 5.8 % 7.8pts HealthCare (GAAP) $ 17,725 $ 18,009 (2)% $ 2,966 $ 3,060 (3)% 16.7 % 17.0 % (0.3)pts Less: acquisitions 19 (96) (29) (43) Less: business dispositions — 911 — 373 Less: foreign currency effect 308 — 114 — HealthCare organic (Non-GAAP) $ 17,398 $ 17,194 1 % $ 2,881 $ 2,729 6 % 16.6 % 15.9 % 0.7pts Renewable Energy (GAAP) $ 15,697 $ 15,666 — % $ (795) $ (715) (11)% (5.1)% (4.6)% (0.5)pts Less: acquisitions — — — — Less: business dispositions — 33 — (4) Less: foreign currency effect 414 — (39) — Renewable Energy organic (Non-GAAP) $ 15,283 $ 15,633 (2)% $ (756) $ (711) (6)% (4.9)% (4.5)% (0.4)pts Power (GAAP) $ 16,903 $ 17,589 (4)% $ 726 $ 274 F 4.3 % 1.6 % 2.7pts Less: acquisitions — — — — Less: business dispositions 26 220 (2) 7 Less: foreign currency effect 203 — (59) — Power organic (Non-GAAP) $ 16,674 $ 17,370 (4)% $ 788 $ 267 F 4.7 % 1.5 % 3.2pts Source: March 2022, Investor Day
  • 90.
    90 HealthCare Organic revenues,profit (loss), and profit margin * Non-GAAP Financial Measure We believe these measures provide management and investors with a more complete understanding of underlying operating results and trends of established, ongoing operations by excluding the effect of acquisitions, dispositions and foreign currency, as these activities can obscure underlying trends. HEALTHCARE ORGANIC REVENUES, PROFIT (LOSS) AND PROFIT MARGIN (NON-GAAP) REVENUES PROFIT (LOSS) PROFIT MARGIN (Dollars in millions) 2020 2019 V% 2020 2019 V% 2020 2019 V pts HealthCare (GAAP) $ 18,009 $ 19,942 (10) % $ 3,060 $ 3,737 (18) % 17.0 % 18.7 % (1.7)pts Less: acquisitions 55 21 (13) (4) Less: business dispositions 21 2,603 (2) 1,111 Less: foreign currency effect (46) — (6) — HealthCare organic (Non-GAAP) $ 17,979 $ 17,318 4 % $ 3,081 $ 2,630 17 % 17.1 % 15.2 % 1.9pts Source: March 2022, Investor Day
  • 91.
    91 Adjusted organic revenuesand Equipment & service organic revenues ORGANIC REVENUES (NON-GAAP) (Dollars in millions) 2021 2020 V% Total revenues (GAAP) $ 74,196 $ 75,833 (2)% Less: Insurance revenues 3,106 2,865 Adjusted revenues (Non-GAAP) $ 71,090 $ 72,969 (3)% Less: acquisitions 19 (67) Less: business dispositions (33) 1,447 Less: foreign currency effect 979 — Organic revenues (Non-GAAP) $ 70,125 $ 71,589 (2)% EQUIPMENT AND SERVICES ORGANIC REVENUES (NON-GAAP) EQUIPMENT SERVICES (Dollars in millions) 2021 2020 V% 2021 2020 V% Total revenues (GAAP) $ 34,200 $ 37,584 (9)% $ 36,890 $ 35,385 4 % Less: acquisitions — — 19 (67) Less: business dispositions (32) 1,037 (1) 410 Less: foreign currency effect 664 — 315 — Total organic revenues (Non-GAAP) $ 33,567 $ 36,547 (8)% $ 36,558 $ 35,042 4 % * Non-GAAP Financial Measure We believe these measures provide management and investors with a more complete understanding of underlying operating results and trends of established, ongoing operations by excluding the effect of acquisitions, dispositions and foreign currency, as these activities can obscure underlying trends. Source: March 2022, Investor Day
  • 92.
    92 Adjusted profit &profit margin ADJUSTED PROFIT AND PROFIT MARGIN (EXCLUDING CERTAIN ITEMS) (NON-GAAP) (Dollars in millions) 2021 2020 V% Total revenues (GAAP) $ 74,196 $ 75,833 (2)% Less: Insurance revenues 3,106 2,865 Adjusted revenues (Non-GAAP) $ 71,090 $ 72,969 (3)% Total costs and expenses (GAAP) $ 80,702 $ 81,259 (1)% Less: Insurance cost and expenses 2,540 2,668 Less: interest and other financial charges 1,813 2,018 Less: debt extinguishment costs 6,524 301 Less: non-operating benefit costs 1,782 2,430 Less: restructuring & other 455 693 Less: Steam asset impairment — 363 Less: SEC settlement charge — 200 Less: goodwill impairments — 728 Add: noncontrolling interests (71) (158) Add: EFS benefit from taxes (162) (154) Adjusted costs (Non-GAAP) $ 67,354 $ 71,546 (6)% Other income (GAAP) $ 2,823 $ 11,396 (75)% Less: gains (losses) on equity securities 1,921 (1,891) Less: restructuring & other 75 13 Less: gains (losses) on purchases and sales of business interests (44) 12,452 Adjusted other income (Non-GAAP) $ 871 $ 823 6 % Profit (loss) (GAAP) $ (3,683) $ 5,970 U Profit (loss) margin (GAAP) (5.0)% 7.9 % (12.9) pts Adjusted profit (loss) (Non-GAAP) $ 4,608 $ 2,246 F Adjusted profit (loss) margin (Non-GAAP) 6.5 % 3.1 % 3.4 pts * Non-GAAP Financial Measure We believe that adjusting profit to exclude the effects of items that are not closely associated with ongoing operations provides management and investors with a meaningful measure that increases the period-to-period comparability. Gains (losses) and restructuring and other items are impacted by the timing and magnitude of gains associated with dispositions, and the timing and magnitude of costs associated with restructuring and other activities. Source: March 2022, Investor Day
  • 93.
    93 Adjusted earnings (loss)and Adjusted earnings (loss) per share, one column basis * Non-GAAP Financial Measure Earnings-per-share amounts are computed independently. As a result, the sum of per-share amounts may not equal the total. The service cost of our pension and other benefit plans are included in adjusted earnings (loss)*, which represents the ongoing cost of providing pension benefits to our employees. The components of non-operating benefit costs are mainly driven by capital allocation decisions and market performance, and we manage these separately from the operational performance of our businesses. Gains (losses) and restructuring and other items are impacted by the timing and magnitude of gains associated with dispositions, and the timing and magnitude of costs associated with restructuring and other activities. We believe that the retained costs in Adjusted earnings (loss)* provides management and investors a useful measure to evaluate the performance of the total company and increases period-to-period comparability. ADJUSTED EARNINGS (LOSS) (NON-GAAP) 2021 2020 V% (Dollars in millions, per-share amounts in dollars) Earnings EPS Earnings EPS Earnings EPS Earnings (loss) from continuing operations (GAAP) $ (3,571) (3.25) $ 5,975 5.46 U U Insurance earnings (pre-tax) 570 0.52 193 0.18 Tax effect on Insurance earnings (126) (0.11) (50) (0.05) Less: Insurance earnings (net of tax) 444 0.40 143 0.13 Earnings (loss) excluding Insurance (Non-GAAP) $ (4,015) (3.66) $ 5,832 5.32 U U Non-operating benefits costs (pre-tax) (GAAP) (1,782) (1.62) (2,430) (2.22) Tax effect on non-operating benefit costs 374 0.34 510 0.47 Less: non-operating benefit costs (net of tax) (1,408) (1.28) (1,920) (1.75) Gains (losses) on purchases and sales of business interests (pre-tax) (44) (0.04) 12,452 11.37 Tax effect on gains (losses) on purchases and sales of business interests 6 0.01 (1,257) (1.15) Less: gains (losses) on purchases and sales of business interests (net of tax) (37) (0.03) 11,195 10.22 Gains (losses) on equity securities (pre-tax) 1,921 1.75 (1,891) (1.73) Tax effect on gains (losses) on equity securities(a) 128 0.12 637 0.58 Less: gains (losses) on equity securities (net of tax) 2,049 1.87 (1,255) (1.15) Restructuring & other (pre-tax) (380) (0.35) (680) (0.62) Tax effect on restructuring & other 35 0.03 151 0.14 Less: restructuring & other (net of tax) (346) (0.31) (529) (0.48) Debt extinguishment costs (pre-tax) (6,524) (5.94) (301) (0.27) Tax effect on debt extinguishment costs(b) 430 0.39 57 0.05 Less: debt extinguishment costs (net of tax) (6,094) (5.55) (244) (0.22) Steam asset impairments (pre-tax) — — (363) (0.33) Tax effect on Steam asset impairments — — 37 0.03 Less: Steam asset impairments (net of tax) — — (326) (0.30) Goodwill impairments (pre-tax) — — (728) (0.66) Tax effect on goodwill impairments — — (23) (0.02) Less: goodwill impairments (net of tax) — — (751) (0.69) Less: Accretion of redeemable noncontrolling interest (pre-tax and net of tax) (9) (0.01) (151) (0.14) Less: SEC settlement charge (pre-tax and net of tax) — — (200) (0.18) Less: U.S. tax reform enactment adjustment 8 0.01 (49) (0.05) Less: Tax benefit related to BioPharma sale — — 143 0.13 Less: Tax loss related to GECAS transaction (54) (0.05) — — Adjusted earnings (loss) (Non-GAAP) $ 1,876 1.71 $ (81) (0.07) F F (a) Includes tax benefits available to offset the tax on gains in equity securities. (b) Includes related tax valuation allowances. Source: March 2022, Investor Day
  • 94.
    94 Free cash flows(FCF) and GE Industrial FCF (including and excluding discontinued factoring) FREE CASH FLOWS (FCF) (Non-GAAP) (Dollars in millions) 2021 2020 V$ CFOA (GAAP) $ 888 $ 1,025 $ (137) Less: Insurance CFOA 86 (80) 167 CFOA excluding Insurance (Non-GAAP) $ 802 $ 1,105 $ (304) Add: gross additions to property, plant and equipment-a) (1,250) (1,579) 329 Add: gross additions to internal-use software-a) (111) (151) 39 Less: GE Pension Plan funding — (2,500) 2,500 Less: CFOA impact from factoring programs discontinued in 2021 (5,108) — (5,108) Less: CFOA impact from receivables factoring and supply chain finance eliminations 2,666 1,419 1,246 Less: taxes related to business sales (6) (178) 172 Free cash flows (Non-GAAP) $ 1,889 $ 635 $ 1,254 Less: prior period CFOA impact from factoring programs discontinued in 2021 -b) (739) (3,361) 2,622 Free cash flows excluding discontinued factoring (Non-GAAP) $ 2,628 $ 3,996 $ (1,368) * Non-GAAP Financial Measure We believe investors may find it useful to compare GE’s Total Company and Industrial free cash flows* performance without the effects of cash used for taxes related to business sales, the factoring program discontinuation, pension plan funding and receivables factoring and supply chain finance eliminations. We believe this measure will better allow management and investors to evaluate the capacity of our industrial operations to generate free cash flows. (a – Included in Gross CAPEX (b – Represents the CFOA impact from cash that GE would have otherwise collected had customer receivables not been previously sold in factoring programs that have now been discontinued. GE INDUSTRIAL FREE CASH FLOWS (FCF) (Non-GAAP) (Dollars in millions) 2021 2020 V$ GE Industrial CFOA (GAAP) $ 1,530 $ (1,254) $ 2,784 Add: gross additions to property, plant and equipment-a) (1,250) (1,579) 329 Add: gross additions to internal-use software-a) (107) (143) 36 Less: GE Pension Plan funding — (2,500) 2,500 Less: CFOA impact from factoring programs discontinued in 2021 (5,108) — (5,108) Less: taxes related to business sales 189 (1,082) 1,271 GE Industrial free cash flows (Non-GAAP) $ 5,092 $ 606 $ 4,487 Less: prior period CFOA impact from factoring programs discontinued in 2021 -b) (739) (3,361) 2,622 GE Industrial free cash flows excluding discontinued factoring (Non-GAAP) $ 5,831 $ 3,967 $ 1,864 Source: March 2022, Investor Day
  • 95.
    95 Free cash flows(FCF) by quarter (including and excluding discontinued factoring) FREE CASH FLOWS (FCF) (Non-GAAP) (Dollars in millions) Q1'21 Q2'21 Q3'21 Q4'21 FY'21 CFOA (GAAP) $ (2,640) $ (351) $ 1,464 $ 2,415 $ 888 Less: Insurance CFOA 60 (16) (4) 46 86 CFOA excluding Insurance (Non-GAAP) $ (2,699) $ (336) $ 1,467 $ 2,369 $ 802 Add: gross additions to property, plant and equipment-a) (332) (267) (296) (355) (1,250) Add: gross additions to internal-use software-a) (24) (26) (29) (33) (111) Less: GE Pension Plan funding — — — — — Less: CFOA impact from factoring programs discontinued in 2021 — (2,706) (362) (2,041) (5,108) Less: CFOA impact from receivables factoring and supply chain finance eliminations 306 1,884 161 314 2,666 Less: taxes related to business sales — (6) — — (6) Free cash flows (Non-GAAP) $ (3,361) $ 199 $ 1,343 $ 3,708 $ 1,889 Less: prior period CFOA impact from factoring programs discontinued in 2021 -b) (778) 67 (28) — (739) Free cash flows excluding discontinued factoring (Non-GAAP) $ (2,583) $ 132 $ 1,371 $ 3,708 $ 2,628 * Non-GAAP Financial Measure We believe investors may find it useful to compare GE’s Total Company free cash flows* performance without the effects of cash used for taxes related to business sales, the factoring program discontinuation, pension plan funding and receivables factoring and supply chain finance eliminations. We believe this measure will better allow management and investors to evaluate the capacity of our industrial operations to generate free cash flows. (a – Included in Gross CAPEX (b – Represents the CFOA impact from cash that GE would have otherwise collected had customer receivables not been previously sold in factoring programs that have now been discontinued. FREE CASH FLOWS (FCF) (Non-GAAP) (Dollars in millions) Q1'20 Q2'20 Q3'20 Q4'20 FY'20 CFOA (GAAP) $ (919) $ (1,501) $ 545 $ 2,901 $ 1,025 Less: Insurance CFOA (30) (32) (91) 73 (80) CFOA excluding Insurance (Non-GAAP) $ (890) $ (1,469) $ 636 $ 2,828 $ 1,105 Add: gross additions to property, plant and equipment-a) (504) (498) (300) (276) (1,579) Add: gross additions to internal-use software-a) (60) (38) (27) (25) (151) Less: GE Pension Plan funding — — — (2,500) (2,500) Less: CFOA impact from factoring programs discontinued in 2021 — — — — — Less: CFOA impact from receivables factoring and supply chain finance eliminations 226 762 (229) 660 1,419 Less: taxes related to business sales (17) (71) (64) (26) (178) Free cash flows (Non-GAAP) $ (1,663) $ (2,697) $ 602 $ 4,392 $ 635 Less: prior period CFOA impact from factoring programs discontinued in 2021 -b) (1,368) (1,049) 433 (1,377) (3,361) Free cash flows excluding discontinued factoring (Non-GAAP) $ (295) $ (1,647) $ 169 $ 5,769 $ 3,996 Source: GE 4th Quarter 2021 earnings, January 2022
  • 96.
    96 Free cash flows(FCF) by segment (including and excluding discontinued factoring and excluding BioPharma) 2021 FREE CASH FLOWS (FCF) (Non-GAAP) (Dollars in millions) Aerospace HealthCare Renewables Power Corporate Total Company CFOA (GAAP) $ 2,815 $ 1,471 $ (1,576) $ 24 $ (1,846) $ 888 Less: Insurance CFOA — — — — 86 86 CFOA excluding Insurance (Non-GAAP) $ 2,815 $ 1,471 $ (1,576) $ 24 $ (1,933) $ 802 Add: gross additions to property, plant and equipment-a) (445) (242) (349) (189) (25) (1,250) Add: gross additions to internal-use software-a) (61) (6) (9) (23) (13) (111) Less: GE Pension Plan funding — — — — — — Less: CFOA impact from factoring programs discontinued in 2021 (2,006) (1,481) (539) (1,117) 35 (5,108) Less: CFOA impact from receivables factoring and supply chain finance eliminations — — — — 2,666 2,666 Less: taxes related to business sales — — — — (6) (6) Free cash flows (Non-GAAP) $ 4,315 $ 2,705 $ (1,395) $ 929 $ (4,665) $ 1,889 Less: prior period CFOA impact from factoring programs discontinued in 2021-b) (314) — (195) (232) 2 (739) Free cash flows excluding discontinued factoring (Non-GAAP) $ 4,629 $ 2,705 $ (1,200) $ 1,161 $ (4,667) $ 2,628 2020 FREE CASH FLOWS (FCF) (Non-GAAP) (Dollars in millions) Aerospace HealthCare Renewables Power Corporate Total Company CFOA (GAAP) $ 763 $ 3,143 $ (328) $ 285 $ (2,838) $ 1,025 Less: Insurance CFOA — — — — (80) (80) CFOA excluding Insurance (Non-GAAP) $ 763 $ 3,143 $ (328) $ 285 $ (2,757) $ 1,105 Add: gross additions to property, plant and equipment-a) (737) (256) (302) (245) (40) (1,579) Add: gross additions to internal-use software-a) (61) (24) (11) (25) (30) (151) Less: GE Pension Plan funding — — — — (2,500) (2,500) Less: CFOA impact from factoring programs discontinued in 2021 — — — — — — Less: CFOA impact from receivables factoring and supply chain finance eliminations — — — — 1,419 1,419 Less: taxes related to business sales — — — — (178) (178) Free cash flows (Non-GAAP) $ (34) $ 2,863 $ (641) $ 15 $ (1,569) $ 635 Less: prior period CFOA impact from factoring programs discontinued in 2021-b) (2,023) (179) (606) (529) (24) (3,361) Free cash flows excluding discontinued factoring (Non-GAAP) $ 1,989 $ 3,042 $ (34) $ 544 $ (1,545) $ 3,996 Less: BioPharma CFOA — 315 — — — 315 Less: BioPharma gross additions to property, plant and equipment — (17) — — — (17) Less: BioPharma gross additions to internal-use software — (2) — — — (2) Free cash flows excluding discontinued factoring and BioPharma (Non-GAAP) $ 1,989 $ 2,746 $ (34) $ 544 $ (1,545) $ 3,700 * Non-GAAP Financial Measure We believe investors may find it useful to compare GE’s Total Company free cash flows* performance without the effects of cash used for taxes related to business sales, the factoring program discontinuation, pension plan funding and receivables factoring and supply chain finance eliminations. We believe this measure will better allow management and investors to evaluate the capacity of our industrial operations to generate free cash flows. (a – Included in Gross CAPEX (b – Represents the CFOA impact from cash that GE would have otherwise collected had customer receivables not been previously sold in factoring programs that have now been discontinued. Source: March 2022, Investor Day
  • 97.
    Adjusted Corporate costs 97 ADJUSTEDCORPORATE COSTS (NON-GAAP) (Dollars in millions) 2021 2020 V% Revenues Corporate revenues $ 945 $ 1,313 Insurance revenues 3,106 2,865 Eliminations and other (1,490) (1,650) Total Corporate $ 2,561 $ 2,528 1 % Operating profit (cost) Gains (losses) on purchases and sales of business interests $ (44) $ 12,452 Gains (losses) on equity securities 1,921 (1,891) Restructuring and other charges (380) (680) Steam asset impairments, net of noncontrolling interests of $65 million — (363) SEC settlement charge — (200) Goodwill impairments, net of noncontrolling interests of $149 million — (728) Insurance profit (loss) 566 197 Adjusted total corporate operating costs (Non-GAAP) (1,170) (1,602) Total Corporate (GAAP) $ 892 $ 7,184 Less: gains (losses), impairments, Insurance, and restructuring & other 2,062 8,786 Adjusted total corporate operating costs (Non-GAAP) $ (1,170) $ (1,602) 27 % Functions & operations $ (848) $ (1,303) Environmental, health and safety (EHS) and other items (302) (104) Eliminations (20) (195) Adjusted total corporate operating costs (Non-GAAP) $ (1,170) $ (1,602) 27 % * Non-GAAP Financial Measure Adjusted total corporate operating costs* excludes gains (losses) on purchases and sales of business interests, significant higher-cost restructuring programs, gains (losses) on equity securities, goodwill impairments and run-off Insurance profit. We believe that adjusting corporate costs to exclude the effects of items that are not closely associated with ongoing corporate operations provides management and investors with a meaningful measure that increases the period-to-period comparability of our ongoing corporate costs. Source: March 2022, Investor Day
  • 98.
    98 Net earnings (loss)excluding Insurance TOTAL COMPANY NET EARNINGS (LOSS) EXCLUDING INSURANCE (NON-GAAP) (Dollars in millions) 1Q'21 2Q'21 3Q'21 4Q'21 FY'21 Net earnings (loss) from continuing operations (GAAP) $ 97 $ (571) $ 582 $ (3,504) $ (3,396) Less: Insurance earnings (net of tax) 111 181 42 110 444 Net earnings (loss) excluding Insurance (Non-GAAP) $ (15) $ (752) $ 540 $ (3,613) $ (3,840) * Non-GAAP Financial Measure We believe investors may find it useful to compare GE’s Total Company free cash flows* performance without the effects of insurance earnings/(losses) net of tax. We believe this measure will better allow management and investors to evaluate the capacity of our industrial operations to generate free cash flows. 2021 NET EARNINGS (LOSS) EXCLUDING INSURANCE (NON GAAP) (Dollars in millions) Aerospace HealthCare Renewables Power Corporate Total Company Net earnings (loss) from continuing operations (GAAP) $ 2,295 $ 2,304 $ (741) $ 564 $ (7,818) $ (3,396) Less: Insurance earnings (net of tax) 0 0 0 0 444 444 Net earnings (loss) excluding Insurance (Non-GAAP) $ 2,295 $ 2,304 $ (741) $ 564 $ (8,262) $ (3,840) 2020 NET EARNINGS (LOSS) EXCLUDING INSURANCE (NON GAAP) (Dollars in millions) Aerospace HealthCare Renewables Power Corporate Total Company Net earnings (loss) from continuing operations (GAAP) $ 841 $ 2,344 $ (618) $ 146 $ 3,745 $ 6,458 Less: Insurance earnings (net of tax) 0 0 0 0 143 143 Net earnings (loss) excluding Insurance (Non-GAAP) $ 841 $ 2,344 $ (618) $ 146 $ 3,601 $ 6,314 Source: GE 4th Quarter 2021 earnings, January 2022
  • 99.
    GE Net debt 99 *Non-GAAP Financial Measure a) - We are including this calculation to provide another market view to GE’s leverage. b) - Represents the total net deficit status of principal pension plans, other pension plans and retiree benefit plans. c) - We are including this calculation to provide a view aligned to credit rating methodology. GE CONSOLIDATED NET DEBT (NON-GAAP) December 31, 2021 (Dollars in millions) Total consolidated GE borrowings (GAAP) 35,186 100% of preferred stock 5,935 Deduction for 100% of GE cash, cash equivalents and restricted cash (15,770) Total GE consolidated net debt - market aligned (Non-GAAP) (a) 25,351 Pension and principal retiree benefit plan liabilities (pre-tax) (b) 15,341 Less: taxes at 21% 3,222 Pension and principal retiree benefit plan liabilities (net of tax) 12,119 GE operating lease liabilities 2,848 Less: 50% of GE preferred stock 2,967 Short-term off-book factoring 161 Add back total GE cash, cash equivalents and restricted cash 15,770 Less: 25% of GE cash, cash equivalents and restricted cash (3,942) Deduction for 75% of GE cash, cash equivalents and restricted cash (11,827) Total GE consolidated net debt - rating agency aligned (Non-GAAP) (c) 41,453 Approaches • Market Aligned: Measure introduced in 4Q’21 to provide another market view to GE’s leverage. • Rating Agency Aligned: Measure introduced in 2018. Aligned to credit rating methodology. Source: March 2022, Investor Day
  • 100.
    Approaches ◦ Market Aligned:Measure introduced in 4Q’21 to provide another market view to GE’s leverage. ◦ Rating Agency Aligned: Measure introduced in 2018. Aligned to credit rating methodology. GE EBITDA & leverage * Non-GAAP Financial Measure a) Other items are mainly comprised of adjustments for gains and out of segment restructuring b) Rating Agency aligned adjustments are mainly comprised of adjusted other income, long-term fixed operating lease expense, stock-related compensation expense and out of segment restructuring. GE NET DEBT/EBITDA RATIO - MARKET ALIGNED (NON-GAAP) (Dollars in millions) December 31, 2021 Total GE consolidated net debt - market aligned (Non-GAAP) 25,351 Total GE leverage EBITDA - market aligned (Non-GAAP) 7,616 GE net debt/EBITDA ratio - market aligned (Non-GAAP) 3.3x GE NET DEBT/EBITDA RATIO - RATING AGENCY ALIGNED (NON-GAAP) (Dollars in millions) December 31, 2021 Total GE consolidated net debt - rating agency aligned (Non-GAAP) 41,453 Total GE leverage EBITDA - rating agency aligned (Non-GAAP) 7,748 GE net debt/EBITDA ratio - rating agency aligned (Non-GAAP) 5.4x 100 GE CONSOLIDATED LEVERAGE EBITDA - (NON-GAAP) (Dollars in millions) December 31, 2021 GE earnings (loss) from continuing operations before income taxes (GAAP) (3,683) Less: Interest and other financial charges (1,813) Less: Debt extinguishment costs (6,524) Less: Depreciation and amortization of property, plant, and equipment and amortization of intangible assets (3,009) Less: Non-operating benefit costs (1,782) Less: Other items(a) 1,426 Less: Insurance profit 566 Add: EFS benefit from taxes 162 Total GE leverage EBITDA - MARKET ALIGNED (Non-GAAP) 7,616 Add: Rating Agency aligned adjustments(b) 132 Total GE leverage EBITDA - RATING AGENCY ALIGNED (Non-GAAP) 7,748 Source: March 2022, Investor Day
  • 101.
    We cannot providea reconciliation of the differences between the non-GAAP expectations and corresponding GAAP measure for Adjusted EPS* in 2022 without unreasonable effort due to the uncertainty of timing of any gains or losses related to acquisitions & dispositions, the timing and magnitude of the financial impact related to the mark-to-market of our remaining investment in AerCap and Baker Hughes, and the timing and magnitude of restructuring expenses. Although we have attempted to estimate the amount of gains and restructuring charges for the purpose of explaining the probable significance of these components, this calculation involves a number of unknown variables, resulting in a GAAP range that we believe is too large and variable to be meaningful. 2022 ADJUSTED EPS (NON-GAAP) * Non-GAAP Financial Measure 101 We cannot provide a reconciliation of the differences between the non-GAAP expectations and corresponding GAAP measure for free cash flows* in 2022 without unreasonable effort due to the uncertainty of timing of deal taxes related to business sales. 2022 FREE CASH FLOWS (NON-GAAP) Source: March 2022, Investor Day