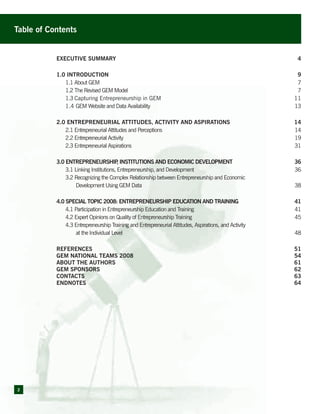
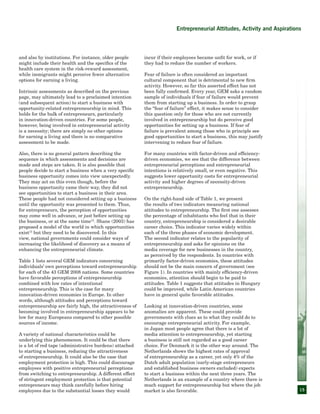
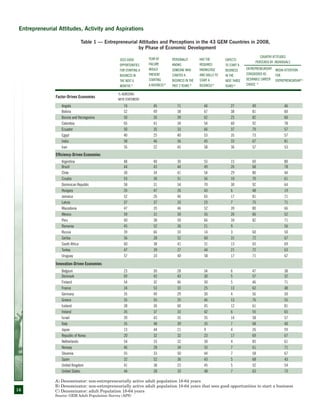
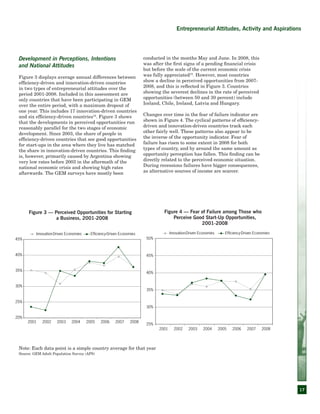
Niels Bosma • Zoltan J. Acs • Erkko Autio • Alicia Coduras • Jonathan Levie
2008 Executive Report
Global Entrepreneurship monitor
Global Entrepreneurship Monitor
2008 Executive Report
	 Niels Bosma, Zoltan J. Acs, Erkko Autio, 	
	 Alicia Coduras, Jonathan Levie
Founding and Sponsoring Institutions
Babson College, Babson Park, MA, US
Lead Sponsoring Institution and Founding Institution
Universidad del Desarrollo, Santiago, Chile
Sponsoring Institution
London Business School, London, UK
Founding Institution
Although GEM data were used in the preparation of this report, their interpretation and use are the sole responsibility of the authors.
The authors also wish to thank Marcia Cole and Sands Creative Group for their exceptional work on this report.
In addition, the authors would like to express their thanks to Chris Aylett (GEM Administrator), Marcia Cole (GEM Project Manager),
Mick Hancock (GEM Project & National Teams Manager), Mark Quill (GEM Data Manager) and all GEM National Teams
for their continued contributions and dedication to GEM.
© 2009 by N. S. Bosma, Z. J. Acs, E. Autio, A. Coduras, J. Levie, and Global Entrepreneurship Research Consortium (GERA).
2
EXECUTIVE SUMMARY	 4
1.0 Introduction	 9
	 1.1 About GEM	 7
	 1.2 The Revised GEM Model	 7
	 1.3 Capturing Entrepreneurship in GEM	 11
	 1.4 GEM Website and Data Availability	 13
2.0 Entrepreneurial Attitudes, Activity and Aspirations	 14
	 2.1 Entrepreneurial Attitudes and Perceptions	 14
	 2.2 Entrepreneurial Activity	 19
	 2.3 Entrepreneurial Aspirations	 31
3.0 Entrepreneurship, Institutions and Economic Development	 36
	 3.1 Linking Institutions, Entrepreneurship, and Development	 36
	 3.2 Recognizing the Complex Relationship between Entrepreneurship and Economic
			 Development Using GEM Data	 38
4.0 Special Topic 2008: Entrepreneurship Education and Training	 41
	 4.1 Participation in Entrepreneurship Education and Training	 41
	 4.2 Expert Opinions on Quality of Entrepreneurship Training	 45
	 4.3 Entrepreneurship Training and Entrepreneurial Attitudes, Aspirations, and Activity
			 at the Individual Level	 48
REFERENCES	 51
GEM NATIONAL TEAMS 2008	 54
ABOUT THE AUTHORS	 61
GEM SPONSORS	 62
CONTACTS	 63
ENDNOTES	 64	
Table of Contents
3
Table of Contents
List of Tables
Table 1	 Entrepreneurial Attitudes and Perceptions in the 43 GEM 2008 Countries, by Phase of Economic Development	 16
Table 2	 Prevalence Rates (in %) of Entrepreneurial Activity and Business Owner-Managers across GEM Countries in 2008,
	 for those Aged 18-64, by Phase of Economic Development	 20
Table 3	 The Correlation Coefficients between GE INDEX and Other Major Indices	 40
Table 4	 Percentage of the Population Aged 18-64 that Received Voluntary or Compulsory Training in Starting a Business
	 During or After School, by Type of Country	 43
Table 5	 Percentage of the Population Aged 18-64 that Received Any Training in Starting a Business After School,
	 by Type of Training Provider	 44
Table 6	 Perceived Need for and Availability and Quality of Entrepreneurship Education and Training,
	 by Country and Country Group (Average Ratings by Experts from 1 to 5)	 46
Table 7	 Percentage of the Population Aged 18-64 Who Are Not Running or Trying to Start a Business and Their Perceptions
	 of Entrepreneurship, by Type of Business Start-Up Training Received and by Type of Country	 49
Table 8	 Percentage of the Population Aged 18-64 Expecting to Start a Business in the Next Three Years or Engaged
	 in Early-Stage Entrepreneurial Activity by Type of Training Received and by Type of Country	 50
List of Figures
Figure 1	 The Revised GEM Model	 10
Figure 2	 The Entrepreneurial Process and GEM Operational Definitions	 11
Figure 3	 Perceived Opportunities for Starting a Business, 2001-2008	 17
Figure 4	 Fear of Failure among Those who Perceive Good Start-Up Opportunities, 2001-2008	 17
Figure 5	 Perceived Skills and Knowledge to Start a New Business, 2001-2008	 18
Figure 6	 Intentions to Start a New Business in the Next Three Years, 2002-2008	 18
Figure 7	 Early-Stage Entrepreneurial Activity (TEA) for 43 Nations in 2008, by Phase of Economic Development,
	 Showing 95% Confidence Intervals	 21
Figure 8	 Early-Stage Entrepreneurial Activity Rates and Per Capita GDP, 2008	 22
Figure 9	 Necessity- and Improvement-Driven Opportunity Motivations as a Percentage of Early-Stage Entrepreneurial Activity,
	 GEM 2008 Countries	 24
Figure 10	 Expressed Reasons behind Discontinuing Businesses, by Age, GEM 2008	 24
Figure 11	 Sector Distribution Early-Stage Entrepreneurial Activity	 25
Figure 12	 Sector Distribution Established Business	 25
Figure 13	 Early-Stage Entrepreneurial Activity Rates for Separate Age Groups, 2008 	 26
Figure 14	 Early-Stage Entrepreneurial Activity Rates by Gender, 2008	 27
Figure 15	 Early-Stage Entrepreneurial Activity (TEA) Rates for 2001-2008, Averages over Efficiency-Driven Countries
	 and Innovation-Driven Countries	 28
Figure 16	 Necessity-Driven TEA Rates for 2001-2008, Averages over Efficiency-Driven Countries
	 and Innovation-Driven Countries	 28
Figure 17	 Prevalence Rates of High-Growth Expectation Early-Stage Entrepreneurship (HEA) in the Adult Population	 31
Figure 18	 Anatomy of High-Growth Expectation Early-Stage Entrepreneurship (HEA): Percentages in TEA	 32
Figure 19	 Percentage of Early-Stage Entrepreneurial Activity with New Product-Market Combination,
	 2002-2008	 32
Figure 20	 Percentage of Early-Stage Entrepreneurial Activity in Technology Sector, 2002-2008	 33
Figure 21	 Innovation Confidence Index for 2007 and 2008 by Country and Country Group	 35
Figure 22	 The Global Entrepreneurship Index in Terms of GDP PPP	 39
Figure 23	 Relationships between the Global Entrepreneurship Index and Economic Freedom Index,
	 Doing Business Index and Global Competitiveness Index	 40
Figure 24	 Percentage of Adults Aged 18-64 Who Have Used Online Training in Starting a Business	 45
4
Executive Summary
Since its inception in 1997 by scholars at Babson College and London Business School, GEM has developed into
one of the world’s leading research consortia concerned with improving our understanding of the relationships
between entrepreneurship and national development. This is the 10th
annual GEM Global Report. Over the past
decade, harmonized data on entrepreneurial attitudes, activity and aspirations have been collected to provide
annual assessments of the entrepreneurial sector for a wide range of countries.
Participating Countries in 2008
In this report a distinction is made between factor-driven countries, efficiency-driven countries and innovation-
driven countries. This classification follows the 2008 Global Competitiveness Report and is relevant to
entrepreneurship in relation to economic development. As previous GEM research has shown, the relationship
between entrepreneurship and economic development differs along phases of economic development. In 2008,
the following 43 countries participated in the GEM project.
Factor-Driven Economies
Angola, Bolivia, Bosnia and Herzegovina*, Colombia*, Ecuador*, Egypt, India, Iran*
Efficiency-Driven Economies
Argentina, Brazil, Chile, Croatia**, Dominican Republic, Hungary**, Jamaica, Latvia, Macedonia, Mexico, Peru,
Romania, Russia, Serbia, South Africa, Turkey, Uruguay
Innovation-Driven economies
Belgium, Denmark, Finland, France, Germany, Greece, Iceland, Ireland, Israel, Italy, Japan, Republic of Korea,
Netherlands, Norway, Slovenia, Spain, United Kingdom, United States
* Transition country: from factor-driven to efficiency-driven
** Transition country: from efficiency-driven to innovation-driven
GEM Data Collection
GEM Adult Population Survey: Measuring Attitudes, Activity and Aspirations
GEM takes a broad view of entrepreneurship and focuses on the role played by individuals in the
entrepreneurial process. The GEM Adult Population Surveys ask a representative sample of at least 2,000
adults in each country about their attitudes to and their involvement in, entrepreneurship. For many
individuals the entrepreneurial process often starts with personal assessments dealing with attitudes and
perceptions to entrepreneurship. GEM therefore collects data on attitudes and perceptions such as perceived
opportunities to start businesses, perceived skills and knowledge to start businesses, and national support for
starting a business as a good career choice. Also, GEM asks adults about intentions to start a business in the
near future.
Unlike most entrepreneurship data sets that measure newer and smaller firms, GEM studies individuals’
activities with respect to starting and managing a business. Furthermore, GEM views entrepreneurship as a
process and considers people in entrepreneurial activity in different phases from the very early phase when the
business is in gestation to the established phase and possibly discontinuation of the business.
Within this context, GEM provides a means by which a wide variety of important entrepreneurial aspirations
such as innovativeness, competitiveness and high-growth aspirations can be systematically and rigorously
studied.
5
GEM National Expert Survey: Measuring
Entrepreneurial Framework Conditions
To see how conditions for entrepreneurship
differ across countries, GEM countries survey
experts in several fields that are important for
entrepreneurship. Examples of such Entrepreneurial
Framework Conditions (EFCs) are national policies
for entrepreneurship, entrepreneurial finance and
the extent to which entrepreneurship is reflected in
education and training.
Key Findings in 2008
Entrepreneurial Attitudes
The GEM 2008 surveys were conducted mostly during
May and June, when the start of the credit crisis
loomed but before the true impact of the current
economic crisis became apparent. Nevertheless, an
overall decline in perceived opportunities to start a
business in 2008 was observed. Countries showing the
severest declines in the rate of perceived opportunities
(between 50 and 30 percent) include Iceland, Chile,
Ireland, Latvia and Hungary.
Perceived skills and knowledge to start a business
were not affected by the business cycle. Also intentions
to start a business within three years do not appear
to have declined as much in 2008 as perceived
opportunities. There are several possible explanations
for this. First, the crisis may actually cause individuals
to seriously consider becoming entrepreneurs in
the near future because they fear they might lose
their jobs. Second, the group of (potential) future
entrepreneurs may be less pessimistic than the total
adult population and may not perceive the financial
crisis as a substantial burden for getting their own
business started – they might for instance draw more
heavily on their own (perceived) capabilities to start a
business. Thirdly, they may have decided to defer the
startup to near the end of the three year period, with
the expectation that the recession will be over within
three years.
Entrepreneurial Activity
In factor-driven economies, with many small-scaled
and local business activities, the rate of involvement
is high for both early-stage entrepreneurial activity
and established business activity. For Angola, however,
the rate of established business activity is very small
compared to the other factor-driven economies, while
the rate of discontinued business is very high. These
findings may reflect Angola’s recent emergence from
prolonged civil war and unrest. For efficiency-driven
economies a clear distinction can be made between
Latin American countries with relatively high early-
stage entrepreneurial activity and Eastern European
countries with relatively low rates of early-stage
entrepreneurial activity.
In the United States there is more early-stage
entrepreneurial activity than in EU countries and
Japan. The rate of early-stage entrepreneurship in
Japan has gradually increased in recent years and is
now around the EU average. Some European countries
– most notably Belgium, Germany and France –
consistently have the lowest rates of entrepreneurial
activity levels. This possibly reflects the relative
risk aversion of European inhabitants and their
declared relative preference for employment over self-
employment. But it also indicates that there are good
income alternatives available, through jobs or social
security.
The overall development of early-stage
entrepreneurial activity in innovation-driven
economies has been quite stable over time. A slight
and gradual rise is observed, from 5.7% in 2002
to 6.4% in 2008. For efficiency-driven economies
the pattern is more sensitive to the business cycle.
Argentina in particular has shown a significant
reaction to its national economic crisis; in 2001-
2003 the Argentinean rate of necessity early-stage
entrepreneurs rose from 3.9 to 7.4 percent.
Entrepreneurial Aspirations
Most of the nascent and new entrepreneurs identified
in GEM show either no or only limited job creation
expectations. High-growth expectation entrepreneurial
activity (HEA) varies widely between countries, as
does the relative prevalence of this activity within
early-stage entrepreneurial activity as a whole. For
example, among innovation-driven economies, there
is a 15-fold difference between the adult-population
prevalence rate of high-expectation early-stage
entrepreneurship of the United States and Greece.
The difference is over five-fold between the two largest
emerging economies in the world, China and India.
Colombia, China, Peru and Chile exhibit the highest
prevalence rates of high-expectation entre­pre­
neur­ship of the factor- and efficiency-driven GEM
countries. The United States, New Zealand, Iceland,
and Canada have the highest levels of high-growth
expectation entrepreneurial activity in innovation-
driven economies. The HEA rate for these countries is
well over 1%. The lowest levels of HEA, at under 0.5%,
occur in Belgium, France, Spain, Japan, Finland and
Greece.
Executive Summary
6
Entrepreneurship: a Complex Relationship with
Institutions and Economic Development
The broad nexus between entrepreneurship, economic
development and institutions is a critical area of
inquiry for understanding entrepreneurship within
or across countries. Not just quantitative measures
of entrepreneurship, but also qualitative measures
of institutional differences are required to estimate
the impact of entrepreneurship on the economic
development of countries.
Chapter 3 introduces a newly constructed complex
index of entrepreneurship that combines GEM
measures on attitudes, activity and aspirations with
other economic indicators that concentrate more on
the institutional characteristics. The relationship
between this Global Entrepreneurship Index (GEI)
and economic development is S-shaped: when factor-
driven economies progress in economic development
beyond a certain threshold, the GEI tends to
increase. The shape of the S-curve broadly matches
the three phases of economic development. The
GEI is also positively related to three other facets
of the “development diamond:” economic freedom,
competitiveness and the ease of doing business.
The insights resulting from such an index could help
policymakers understand how different aspects of
policy can affect productive entrepreneurship through
the major phases of economic development.
GEM Special Topic 2008: Education and
Training
GEM expert surveys in most countries consistently
report that entrepreneurship education and training
is poor or inadequate. This is why entrepreneurship
education and training was chosen as a special topic
for GEM 2008. Thirty nine out of 43 GEM nations
included additional questions in their adult population
surveys and 31 included additional questions in their
expert surveys.
The relationship between training in starting a
business and entrepreneurial attitudes, aspirations
and activity is generally positive, but varies by
phase of economic development. Around one-fifth
of respondents had received some form of training
in starting a business, but this proportion varied
widely by country. For example, among factor-driven
countries, the proportion of individuals who had
received any training in starting a business, either in
school or after school, varied from 40% in Colombia to
8% in Egypt. In efficiency-driven countries, it varied
from 43% in Chile to 6% in Turkey. In innovation-
driven countries, it varied from 48% in Finland to
13% in Israel.
Almost 10% of the respondents had engaged in self-
directed learning, such as reading or observing or
working in other people’s businesses, but this too
varied widely by country. The next most frequent
overall training choice was voluntary formal
education, followed by voluntary training provided
by a college or university but outside the formal
education system. Other sources, such as business
or trade organizations, government agencies, or
employers, typically were used by 3% or less of
individuals. Colombia, Chile, Peru and Finland had
higher than usual usage of all sources.
In factor-driven economies, quality and quantity of
training is associated with higher levels of necessity-
based entrepreneurial activity, while in efficiency-
driven countries, it is associated with higher levels
of market-expansion entrepreneurial activity. In
innovation-driven countries, training levels are
negatively associated with some attitudinal and
activity measures.
Rates of early-stage entrepreneurial activity among
those who had received compulsory training were
around three-quarters of the rate of those who had
received voluntary training, while the “yield” to
training varied from 1.5 times the untrained rate for
compulsory training in factor-driven countries to 2.5
times the untrained rate for voluntary training in
innovation-driven countries.
Executive Summary
7
Introduction
1.1 About GEM
Although it is widely acknowledged that
entrepreneurship is an important force shaping the
changes in the economic landscape, our understanding
of the relationship between entrepreneurship and
development is still far from complete. The quest
to unravel the complex relationship has been
particularly hampered by a lack of cross-national
harmonized data sets on entrepreneurship. Since
1997, the GEM research program has sought to
address this by collecting relevant harmonized data
on an annual basis. GEM focuses on three main
objectives:
•	 To measure differences in the level of
	 entrepreneurial activity among countries
•	 To uncover factors determining national levels
	 of entrepreneurial activity
•	 To identify policies that may enhance the
	 national level of entrepreneurial activity
Traditional analyses of economic growth and
competitiveness have tended to neglect the role
played by new and small firms in the economy. GEM
takes a comprehensive approach and considers the
degree of involvement in entrepreneurial activity
within a country, identifying different types and
phases of entrepreneurship.
The Global Entrepreneurship Monitor (GEM)
was conceived in 1997 by Michael Hay and Bill
Bygrave and a prototype study was funded by the
London Business School and Babson College. The
first GEM Global study was conducted by a group
of 10 nations in 1999 with Paul Reynolds as the
Principal Investigator. Since then GEM has grown
into a consortium of 64 national teams. In 2004,
the London Business School and Babson College
transferred GEM’s intellectual capital to the Global
Entrepreneurship Research Association (GERA),
which is a not-for-profit organization governed
by representatives of the national teams, the two
founding institutions, and sponsoring institutions.
In this 10th
annual report, we present a revised
conceptual model that will be used to further explore
the role of entrepreneurial activity in the economy.
The model has been updated in accordance with
recent insights on entrepreneurship and economic
growth. In this revised model, different phases of the
economic development of nations are recognized and
the role and nature of entrepreneurship is considered
to differ along these major phases. Three major
phases are recognized: factor-driven economies, which
are primarily extractive in nature, efficiency-driven
economies in which scale-intensity is a major driver
of development, and innovation-driven economies1
. As
countries develop economically, they tend to shift from
one phase to the next.
1.2 The revised gem model
There is wide agreement on the importance of
entrepreneurship for economic development2
.
Entrepreneurs drive innovation, they speed up
structural changes in the economy and they force old
incumbent companies to shape up, thereby making
an indirect contribution to productivity. It is widely
accepted that high-impact entrepreneurs in particular
make an outsized contribution to job creation,
sometimes providing for the totality of new net job
creation in the economy3
.
While important, the contribution of entrepreneurs
to an economy also varies according to its phase
of economic development4
. According to “received
wisdom,” the level of necessity-driven self-
employment activity is high particularly at low levels
of economic development, as the economy may not
be able to sustain a high enough number of jobs in
high-productivity sectors. As an economy develops,
the level of necessity-driven entrepreneurial activity
gradually declines as productive sectors grow and
supply more employment opportunities. At the same
time, opportunity-driven entrepreneurial activity
tends to pick up, introducing a qualitative change
in overall entrepreneurial activity. This decline in
necessity entrepreneurship followed by an increase
in opportunity entrepreneurship is known as the
“U-curve” hypothesis.
While there is much anecdotal support for the U-curve
hypothesis, it only demonstrates an association and
does not fully reflect the complexity of the causal
relationship between entrepreneurship and economic
growth. In this year’s GEM report, we introduce a
more nuanced distinction among phases of economic
development, in line with Porter’s typology of “factor-
driven economies,” “efficiency-driven economies” and
“innovation-driven economies” (2002).
8
Entrepreneurship in Factor-Driven Economies
Economic development consists of changes in the
quantity and character of economic value added
(Lewis, 1954). These changes result in greater
productivity and rising per capita incomes, and they
often coincide with migration of labor across different
economic sectors in society, for example from primary
and extractive sectors to the manufacturing sector, and
eventually, services (Gries & Naude, 2008). Countries
with low levels of economic development typically have
a large agricultural sector, which provides subsistence
for the majority of the population who mostly still live
in the countryside. This situation changes as industrial
activity starts to develop, often around the extraction
of natural resources. As extractive industry starts to
develop, this triggers economic growth, prompting
surplus population from agriculture to migrate toward
extractive and emergent scale-intensive sectors, which
are often located in specific regions. The resulting
oversupply of labor feeds subsistence entrepreneurship
in regional agglomerations, as surplus workers seek to
create self-employment opportunities in order to make
a living.
Entrepreneurship in Efficiency-Driven Economies
As the industrial sector develops further, institutions
start to emerge to support further industrialization
and the build-up of scale in the pursuit of higher
productivity through economies of scale. Typically,
national economic policies in scale-intensive economies
shape their emerging economic and financial
institutions to favor large national businesses.
As increasing economic productivity contributes
to financial capital formation, niches may open in
industrial supply chains that service these national
incumbents. This, combined with the opening up
of independent supply of financial capital from the
emerging banking sector, would expand opportunities
for the development of small-scale and medium-sized
manufacturing sectors. Thus, in a scale-intensive
economy, one would expect necessity-driven industrial
activity to gradually fall and give way to an emerging
small-scale manufacturing sector.
Entrepreneurship in Innovation-Driven
Economies
As an economy matures and its wealth increases,
one may expect the emphasis in industrial activity to
gradually shift toward an expanding service sector
that caters to the needs of an increasingly affluent
population and supplies the services normally
expected of a high-income society. The industrial
sector evolves and experiences improvements in
variety and sophistication. Such a development
would be typically associated with increasing
research and development and knowledge intensity,
as knowledge-generating institutions in the economy
gain momentum. This development opens the way
for the development of innovative, opportunity-
seeking entrepreneurial activity that is not afraid
to challenge established incumbents in the economy.
Often, small and innovative entrepreneurial firms
enjoy an innovation productivity advantage over
large incumbents, enabling them to operate as
‘agents of creative destruction.’ To the extent that the
economic and financial institutions created during
the scale-intensive phase of the economy are able
to accommodate and support opportunity-seeking
entrepreneurial activity, innovative entrepreneurial
firms may emerge as significant drivers of economic
growth and wealth creation (Henrekson, 2005).
Entrepreneurship: Attitudes, Activity
and Aspirations
Different opinions on, and therefore different
definitions of, entrepreneurship can be observed in the
recent literature, as well as over time. These historical
views of entrepreneurship are interesting in that they
reflect the roles of entrepreneurship in each of the
three economic phases we have just outlined. Cantillon
(1755) is believed to be the first scholar to define
entrepreneurship. He qualified entrepreneurship as
“as someone who identified the willingness to bear
the personal financial risk of a business venture.”
This definition reflects the role of entrepreneurship
in Europe in the 18th
century. It relates more to the
static notion of entrepreneurship as being a ‘business
owner’ than the more dynamic notion that has to do
with starting new ventures. At the end of the 19th
century, Marshall’s view centered on the class of
entrepreneurs and their importance for the market
economy (Marshall, 1890). He described how industrial
entrepreneurs exploited economies of skill and
economies of scale, and likened the most successful of
them akin to large trees in a forest, towering above
their neighbors, depriving them of light and air. The
“Marshallian” view relates well to the economic view
of scale-intensive entrepreneurship as a reflection of
the efficiency-driven stage. Schumpeter (1934;1942)
was a pioneer in linking the dynamic aspect of
entrepreneurship to innovations and economic
development. His concept of “creative destruction”
can be directly linked to the role of entrepreneurship
in innovation-driven countries. Entrepreneurs
introducing product-market combinations move the
technology frontier forward and destroy economic
activity based on older technology.
Current views on entrepreneurship vary, and
this underlines the multi-faceted nature of
entrepreneurship. Davidsson (2004) lists seven
phenomena associated with entrepreneurship,
while Wennekers and Thurik (1999) provide
thirteen different concepts of entrepreneurship.
Introduction
9
Introduction
In a recent study, Godin and colleagues (2008)
identify six common elements of entrepreneurship.
Looking at the proposed constructs in some
detail, three main components may be identified:
entrepreneurial attitudes, entrepreneurial activity
and entrepreneurial aspiration (Acs and Szerb,
2008). These are interlinked in a complex set of feed-
forward and feedback loops. For example, positive
attitudes towards entrepreneurship may increase
entrepreneurial activity and aspiration, which in turn
positively affect attitudes as more positive role models
appear. Positive aspirations may change the nature of
activity, and in turn, change attitudes.
Entrepreneurial attitudes are attitudes toward
entrepreneurship. For example, the extent to
which people think there are good opportunities
for starting a business, or the degree to which they
attach high status to entrepreneurs, might be termed
entrepreneurial attitudes. Other relevant attitudes
might include the level of risk that individuals might
be willing to bear and individuals’ perception of their
own skills, knowledge and experience in business
creation.
Entrepreneurial attitudes can influence
entrepreneurial activity but can also be influenced by
entrepreneurial activity. For example, the legitimacy
of entrepreneurship in a society, as expressed in
positive entrepreneurial attitudes, can be influenced
by whether people know anyone who has started a
business recently. This can be a function of both levels
of entrepreneurial activity and social networking
activity in the society. Individuals who know other
individuals who recently started a business may,
through familiarity with the process, be more likely
to see it as legitimate.
Entrepreneurial attitudes are important because
they express the general feelings of the population
toward entrepreneurs and entrepreneurship. It
is important for countries to have people who can
recognize valuable business opportunities, and who
perceive they have the required skills to exploit
these opportunities. Moreover, if national attitudes
toward entrepreneurship are positive, this will
generate cultural support, help, financial resources,
and networking benefits to those who are already
entrepreneurs or want to start a business.
Entrepreneurial activity is multi-faceted, but one
important aspect is the extent to which people in a
population are creating new business activity, both
in absolute terms and relative to other economic
activities, such as business closure. Within the
realm of new business activity, different types of
entrepreneurial activity can be distinguished. For
example, business creation may vary by industry
sector, by the size of the founding team, and by
whether the new venture is legally independent
of other businesses, and in terms of founder
demographics, such as gender, age, or education.
Entrepreneurial activity is best seen as a process
rather than an event5
. That is why GEM measures
entrepreneurial intentions, and nascent, new, and
established business activity. Examining multiple
components of entrepreneurial activity also allows
us to explore differences among the entrepreneurial
processes across the three major phases of national
economic development. For example, nascent and new
business activity is expected to be high in factor-driven
economies mainly because much of it is motivated by
economic necessity. In innovation-driven economies,
the proportion of opportunity-driven entrepreneurship
is expected to be higher than in factor- and efficiency-
driven economies.
Entrepreneurial aspiration reflects the qualitative
nature of entrepreneurial activity. For example,
entrepreneurs differ in their aspirations to introduce
new products, new production processes, to engage
with foreign markets, to develop a significant
organization, and to fund growth with external
capital. These aspirations, if they are realized, can
significantly affect the economic impact of these
entrepreneurial activities. Product and process
innovation, internationalization, and ambition for
high growth are regarded as hallmarks of ambitious
or high-aspiration entrepreneurship. GEM has created
measures that capture such aspirations.
Entrepreneurial Framework Conditions
The 2007 GEM Global Report discussed the relevance
of Entrepreneurial Framework Conditions (EFCs)
as indicators of a country’s potential to foster
entrepreneurship (Bosma, et al., 2008). EFCs reflect
major features of a country’s socio-economic milieu
that are expected to have a significant impact on
the entrepreneurial sector. Like the original GEM
model, the revised GEM model maintains that, at the
national level, different framework conditions apply
to established business activity and to new business
activity6
. What is new about the revised model is
that we have related these conditions to a country’s
phase of economic development. The relevant national
conditions for factor-driven economic activity and
efficiency-driven economic activity are adopted from
the Global Competitiveness Report (GCR) 2008 (Porter
and Schwab, 2008). With respect to innovation-driven
economic activity, the revised GEM model makes
a contribution to the GCR perspective on economic
development by identifying framework conditions
that are specific to innovation and entrepreneurship.
As Acs and colleagues (2003) propose, it is the
entrepreneurial mechanism that turns innovation
into economic output. A lack of entrepreneurship can
therefore be seen as a bottleneck for innovation-driven
countries in achieving their growth ambitions.
10
It is important to recognize that all three principal
types of economic activity: factor-driven, efficiency-
driven, and innovation-driven, are present
in all national economies. But their relative
prevalence—and their contribution to economic
development—varies. The GCR proposition is that
each phase of economic development has a different
optimal combination of these three activities. The
three phases are labeled according to the activity
that is most significant for that phase. Thus, the
relative importance of entrepreneurial framework
conditions to a country may vary by phase of economic
development. As the 2004 GEM global report noted,
one size does not fit all (Acs, et al., 2005).
The resulting revised GEM Model is presented in
Figure 1. For factor-driven economies, emphasis is put
on basic requirements: development of institutions,
infrastructure, macroeconomic stability, health, and
primary education. These basic requirements will help
sustain necessity-based entrepreneurship, but may do
little to enable opportunity-based entrepreneurship.
As economies progress and scale economies become
more and more relevant, other conditions, which
ensure a proper functioning of the market and are
called efficiency enhancers, become important. Even
though these conditions are not directly related
to entrepreneurship in the Schumpeterian sense,
they are indirectly related since the development of
markets will also attract more entrepreneurship. For
countries whose economic development is primarily
innovation-driven, EFCs become more important
as levers of economic development than basic
requirements or efficiency enhancers.
Entrepreneurial attitudes, activity, and aspiration as
dynamic interactive components of entrepreneurship
are characterized in detail in Chapter 2, using the
results of the GEM Adult Population Survey. Chapter
3 focuses on the role of institutions in each of the three
phases. Each year, the GEM reports highlights one
aspect of the GEM conceptual model. In Chapter 4 we
focus on one EFC, entrepreneurship education and
training, which was chosen as a special topic for GEM
in 2008. Extra questions on this special topic were
included in the GEM Adult Population Survey and the
standard National Expert Survey (NES) this year, and
the answers are summarized and commented on with
respect to the revised GEM model.
Social,
Cultural,
Political
Context
Basic requirements
- Institutions
- Infrastructure
- Macroeconomic stability
- Health and primary
education Established Firms
(primary economy)
Attitudes:
Perceived opportunities
Perceived capacity
Activity:
Early-stage
Persistence
Exits
Aspirations:
Growth
Innovation
Social value creation
New branches,
firm growth National
Economic
Growth
(Jobs and
Technical
Innovation)
Entrepreneurship
Efficiency enhancers
- Higher education &
training
- Goods market efficiency
- Labor market efficiency
- Financial market
sophistication
- Technological readiness
- Market size
Innovation and
entrepreneurship
- Entrepreneurial finance
- Gov. entrepreneurship
programs
- Entrepreneurship
education
- R&D transfer
- Commercial, legal
infrastructure for
entrepreneurship
- Entry regulation
Figure 1 — The Revised GEM Model
Introduction
11
1.3 Capturing Entrepreneurship
in GEM
The previous section showed that entrepreneurship
is a complex phenomenon which spans a variety of
contexts. In line with its objectives, GEM takes a
broad view of entrepreneurship and focuses on the
role played by individuals in the entrepreneurial
process. Unlike most entrepreneurship data sets
that measure newer and smaller firms, GEM studies
the behavior of individuals with respect to starting
and managing a business. This differentiates GEM
from other data sets, most of which record firm-level
data on (new) firm registrations (see Box 1). New
firms are, most often, started by individuals. Even in
established organizations, individuals have different
entrepreneurial attitudes, activities, and aspirations.
Another guiding principle of GEM research is that
entrepreneurship is a process. Therefore GEM needs
to do more than compare entrepreneurial attitudes
and aspirations of those who are and are not engaging
in entrepreneurship. It also needs to capture attitudes,
activities, and aspirations in different phases of
entrepreneurship, from general intentions to a more
active early or “nascent” phase where businesses are
in gestation, to new businesses that can be identified
as having commenced operations, to the established
phase and possibly discontinuation of the business.
An individual entrepreneur who has succeeded in
creating and sustaining a business has gone through
a process. The entrepreneurial process starts before
the firm is operational. Someone who is just starting
a venture and trying to survive in a very competitive
market is an entrepreneur in spite of not having
high-growth aspirations. On the other hand, a
person may be an established business owner who
has been in business for quite a number of years
and still be innovative, competitive, and growth-
minded. This person is also an entrepreneur. GEM
provides an umbrella under which a wide variety of
entrepreneurial characteristics, such as motivations,
innovativeness, competitiveness, and high-growth
aspirations, can be systematically and rigorously
studied.
Within this context, the GEM data collection covers
the life cycle of the entrepreneurial process and
looks at individuals at the point when they commit
resources to start a business they expect to own
themselves (nascent entrepreneurs); when they
currently own and manage a new business that has
paid salaries for more than three months but not
more than 42 months (new business owners); and
when they own and manage an established business
that has been in operation for more than 42 months
(established business owners). Figure 2 summarizes
the entrepreneurial process and GEM’s operational
definitions.
For GEM, the payment of any wages for more than
three months to anybody, including the owners, is
considered to be the “birth event” of actual businesses.
Thus, the distinction between nascent entrepreneurs
and new business owners depends on the age of the
business. Businesses that have paid salaries and
wages for more than three months and less than 42
months may be considered new. The cut-off point
of 42 months has been made on a combination of
theoretical and operational grounds7
.The prevalence
rate of nascent entrepreneurs and new business
owners taken together may be viewed as an indicator
of early-stage entrepreneurial activity in a country.
It represents dynamic new firm activity. Even if a
fair share of nascent entrepreneurs do not succeed in
getting the business started, their actions may have
a beneficial effect on the economy since the threat
of entry and of new competition can put pressure on
incumbent firms to perform better.
Business owners who have paid salaries and wages
for more than 42 months are classified as “established
business owners.” Their businesses have survived
the liability of newness. High rates of established
business ownership may indicate positive conditions
for firm survival. However, this is not necessarily the
case. If a country exhibits a high degree of established
entrepreneurship combined with a low degree of early-
stage entrepreneurial activity, this indicates a low
level of dynamism in entrepreneurial activity8
.
Potential
entrepreneur:
opportunities,
knowledge, and skills
Nascent
entrepreneur:
involved in setting
up a business
Owner-manager
of a new business
(up to
3.5 years old)
Owner-manager
of an established
business (more
than 3.5 years old)
Conception Firm birth Persistence
Early-stage Entrepreneurial Activity (TEA)
Figure 2 — The Entrepreneurial Process and GEM Operational Definitions
Introduction
12
This year’s GEM report includes 43 countries across the globe. In each of these 43 countries, a survey was held
among a representative sample of at least 2,000 adults. More than 150,000 adults were interviewed between
May and October (outside holiday seasons) and answered questions on their attitudes toward and involvement
in entrepreneurial activity.
Box 1. Main Distinctions between GEM Adult
Population Survey Data and Business
Registration Data
GEM is a social survey directed at individuals. In
GEM’s research perspective, it is individuals who
are primary agents in setting up, starting, and
maintaining new and entrepreneurial businesses.
The main distinctions between GEM data and
business registrations data are as follows:
GEM data are obtained using a research design•	
that is harmonized over all participating
countries. Despite recent initiatives by
Eurostat, OECD, and the World Bank,
the harmonization of national business
registrations has not yet been achieved. GEM
data uniquely enables reliable comparisons
across countries. The robustness of the GEM
method is demonstrated by the stability of
year-on-year comparisons at the country level.
GEM’s research design implies statistical•	
uncertainties in the aggregate (country-
level) results. This is acknowledged by
publishing confidence intervals for the
obtained entrepreneurship indices. Business
registration data are “count data” and as such
do not require confidence intervals. However,
the accuracy of registration data as a measure
of new business activity is unclear for several
countries. For example, in the UK, most
businesses are not (and are not required to be)
registered at all, while in Spain registration is
compulsory before trading can commence. In
some countries, businesses may be registered
purely for tax reasons without entrepreneurial
activity taking place, while in other countries
businesses are deliberately not registered to
avoid paying taxes.
GEM tracks people who are in the process of•	
setting up a business (nascent entrepreneurs),
as well as people who own and manage
running businesses. These also include
freelancers, or other entrepreneurs who in
some jurisdictions need not register. GEM
also measures attitudes and self-perceptions
regarding entrepreneurship. Insight about
the earliest phase of the start-up process and
the entrepreneurial spirit is very relevant for
policy makers.
The primary purpose of GEM is•	 not to
count the number of new businesses in
different countries. It is about measuring
entrepreneurial spirit and entrepreneurial
activity through different phases of the
entrepreneurial process. Therefore, GEM data
may not be the best source for some basic firm-
level characteristics, particularly in countries
that tightly regulate new business activity
and whose citizens have high respect for the
rule of law. For example, to determine sector
distribution of existing firms, registration data
are mostly preferable over GEM data (with
the possible exception of GEM countries with
a large number of respondents, such as Spain
and the UK).
GEM generates more than measures of•	
entrepreneurial activity; it also generates
measures of entrepreneurial attitudes and
aspirations. Examples are motivations for
being self-employed, the degree of innovative
activities, and growth expectation. However,
these characteristics should always be derived
from an adequate sample; to achieve this, one
may need to merge the GEM samples over
several years.
In the Appendix of the GEM Global Report 2005,
measures were derived from GEM data based on
definitions of self-employment rates and start-up
rates as published by the OECD and Eurostat.
The rates based on GEM data appeared to
match the rates on registrations data fairly well.
Nevertheless, one should be aware that the GEM
data are distinctive, and designed to measure
entrepreneurial activity across a wide range of
countries, including those where government
business registration data may not provide a true
and fair reflection of actual business activity.
Introduction
13
Introduction
1.4 GEM Website and Data Availability
GEM is a consortium of national teams, participating in the Global Entrepreneurship Research Association
(GERA—the umbrella organization that hosts the GEM project). Thanks to the effort and dedication of
hundreds of entrepreneurship scholars as well as policy advisors across the globe, the GEM consortium consists
of a unique network building a unique data set. Contact details, GEM 2008 National Summary Sheets, and
national teams’ micro-sites can be found on www.gemconsortium.org. A selection of GEM data is also made
available on this website. The GEM website provides an updated list of the growing number of peer-reviewed
scientific articles based on GEM data.
Glossary of Main Measures and Terminology
Measure Description
Entrepreneurial Attitudes and Perceptions
Perceived opportunities
Percentage of 18-64 population (individuals involved in any stage of entrepreneurial activity excluded)
who see good opportunities to start a firm in the area where they live
Perceived capabilities
Percentage of 18-64 population (individuals involved in any stage of entrepreneurial activity excluded) who
believe they have the required skills and knowledge to start a business
Entrepreneurial intention
Percentage of 18-64 population (individuals involved in any stage of entrepreneurial activity excluded) who
intend to start a business within three years
Fear of failure rate
Percentage of 18-64 population with positive perceived opportunities (individuals involved in any stage of
entrepreneurial activity excluded) who indicate that fear of failure would prevent them from setting up a
business
Entrepreneurship as desirable career choice
Percentage of 18-64 population who agree with the statement that in their country, most people consider starting
a business as a desirable career choice
Media attention for entrepreneurship
Percentage of 18-64 population who agree with the statement that in their country, they will often see stories in
the public media about successful new businesses
Entrepreneurial Activity
Nascent entrepreneurship rate
Percentage of 18-64 population who are currently a nascent entrepreneur, i.e., actively involved in setting up a
business they will own or co-own; this business has not paid salaries, wages, or any other payments to the
owners for more than three months
New business ownership rate
Percentage of 18-64 population who are currently a owner-manager of a new business, i.e., owning and
managing a running business that has paid salaries, wages, or any other payments to the owners for more than
three months, but not more than 42 months
Early-stage entrepreneurial activity (TEA)
Percentage of 18-64 population who are either a nascent entrepreneur or owner-manager of a new business
(as defined above)
Established business ownership rate
Percentage of 18-64 population who are currently owner-manager of an established business, i.e., owning and
managing a running business that has paid salaries, wages, or any other payments to the owners for more than
42 months
Overall entrepreneurial activity rate
Percentage of 18-64 population who are either involved in early-stage entrepreneurial activity or owner-manager
of an established business (as defined above)
Business discontinuation rate
Percentage of 18-64 population who have, in the past 12 months, discontinued a business, either by selling,
shutting down, or otherwise discontinuing an owner/management relationship with the business. Note: This is
NOT a measure of business failure rates.
Improvement-driven opportunity entrepreneurial
activity: relative prevalence
Percentage of those involved in early-stage entrepreneurial activity (as defined above) who (i) claim to be driven
by opportunity as opposed to finding no other option for work; and (ii) who indicate the main driver for being
involved in this opportunity is being independent or increasing their income, rather than just maintaining their
income
Entrepreneurial Aspirations
High-growth expectation early-stage
entrepreneurial activity (HEA)
Percentage of 18-64 population who are either a nascent entrepreneur or owner-manager of a new business (as
defined above) and expect to employ at least 20 employees five years from now
High-growth expectation early-stage
entrepreneurial activity: relative prevalence
Percentage of early-stage entrepreneurs (as defined above) who expect to employ at least 20 employees five
years from now
New product-market oriented early-stage
entrepreneurial activity: relative prevalence
Percentage of early-stage entrepreneurs (as defined above) who indicate that their product or service is new to
at least some customers and indicate that not many businesses offer the same product or service
Early-stage entrepreneurial activity in
technology sectors: relative prevalence
Percentage of early-stage entrepreneurs (as defined above) who are active in the ‘high technology’ or ‘medium high’
technology sector, as classified by OECD (2003)
14
2.0 Entrepreneurial Attitudes, Activity and Aspirations
This chapter provides an assessment of the
characteristics of entrepreneurship in the 43 GEM
2008 countries by presenting several indices that
measure aspects of Entrepreneurial Attitudes,
Activity and Aspirations. The countries included in
this assessment are listed in Box 2. The countries are
grouped into three phases of economic development as
discussed in the Global Competitiveness Report 2008-
2009 (Porter and Schwab, 2008). Phases of economic
development are decided on the level of GDP per
capita and the extent to which countries are factor-
driven in terms of the shares of exports of primary
goods in total exports.
Box 2. Country Groups Used in this
Report for the 43 GEM 2008 Countries
Factor-Driven Economies
Angola, Bolivia, Bosnia and Herzegovina*,
Colombia*, Ecuador*, Egypt, India, Iran*
Efficiency-Driven Economies
Argentina, Brazil, Chile, Croatia**,
Dominican Republic, Hungary**, Jamaica,
Latvia, Macedonia, Mexico, Peru, Romania,
Russia, Serbia, South Africa, Turkey, Uruguay
Innovation-Driven Economies
Belgium, Denmark, Finland, France,
Germany, Greece, Iceland, Ireland, Israel,
Italy, Japan, Republic of Korea, Netherlands,
Norway, Slovenia, Spain, United Kingdom,
United States
* Transition country: from factor-driven to
efficiency-driven
** Transition country: from efficiency-driven
to innovation-driven
2.1 Entrepreneurial Attitudes
and Perceptions
Perceptions about entrepreneurship may affect the
supply side and the demand side of entrepreneurship.
On the supply side, or the “pool” of potential
entrepreneurs, important perceptions include both
willingness and perceived ability to become an
entrepreneur (Davidsson, 1991). Education levels
and the availability of entrepreneurship training
programs are possible determinants of perceived
skills (see Chapter 4).
On the demand side, or “space for” entrepreneurship,
there needs to be opportunities for entrepreneurship,
but equally important is that entrepreneurs perceive
that there are opportunities for starting a business9
.
The quantity and quality of perceived opportunities
may be enhanced by national conditions such as
economic growth, population growth, culture and
national entrepreneurship policy10
.
But there are more factors than these at play. As
people see more and more successful entrepreneurs
in their direct environment, this may enhance
their perception of their own capabilities without
enhancing actual capabilities. This effect may be
stronger when the economic climate is favorable.
Furthermore, there may be demographic differences in
(perceived) entrepreneurial capabilities for historical
socio-economic or cultural reasons. Policy programs
may explicitly target groups exhibiting low shares
of perceived capabilities as well as low shares of
actual capabilities. Thus, several distinct national
conditions may affect perceived capabilities directly
and indirectly.
If an individual exhibits positive perceptions toward
entrepreneurship, it is by no means certain that he
or she will actually get involved in entrepreneurial
activity. There are several assessments to be made,
which may or may not be conscious. First, there is
the assessment of opportunity costs, which involves
comparing the expected returns of entrepreneurship
to the expected returns of an alternative occupation11
.
The most common alternative is “being employed.”
Then, there is a risk-reward assessment: even if
the expected returns from entrepreneurship are
considerably higher than the best alternative, the
(perceived) risks involved may be too high for a
person who is thinking about starting a business.
An individual’s risk-avoidance preference may be a
significant factor in the transition from potential (or
latent) entrepreneurship to entrepreneurial activity
(Khilstrom and Laffont, 1979). At the same time, the
individual may also be influenced by demographic
characteristics such as age, gender, origin, or ethnicity
15
Entrepreneurial Attitudes, Activity and Aspirations
and also by institutions. For instance, older people
might include their health and the specifics of the
health care system in the risk-reward assessment,
while immigrants might perceive fewer alternative
options for earning a living.
Intrinsic assessments as described on the previous
page, may ultimately lead to a proclaimed intention
(and subsequent action) to start a business with
opportunity-related entrepreneurship in mind. This
holds for the bulk of entrepreneurs, particularly
in innovation-driven countries. For some people,
however, being involved in entrepreneurial activity
is a necessity; there are simply no other options
for earning a living and there is no comparative
assessment to be made.
Also, there is no general pattern describing the
sequence in which assessments and decisions are
made and steps are taken. It is also possible that
people decide to start a business when a very specific
business opportunity comes into view unexpectedly.
They may act on this even though, before the
business opportunity came their way, they did not
see opportunities to start a business in their area.
These people had not considered setting up a business
until the opportunity was presented to them. Thus,
for entrepreneurs, the perception of opportunities
may come well in advance, or just before setting up
the business, or at the same time12
. Shane (2003) has
proposed a model of the world in which opportunities
exist13
but they need to be discovered. In this
view, national governments could consider ways of
increasing the likelihood of discovery as a means of
enhancing the entrepreneurial climate.
Table 1 lists several GEM indicators concerning
individuals’ own perceptions toward entrepreneurship
for each of the 43 GEM 2008 nations. Some countries
have favorable perceptions of entrepreneurship
combined with low rates of intentional
entrepreneurship. This is the case for many
innovation-driven economies in Europe. In other
words, although attitudes and perceptions toward
entrepreneurship are fairly high, the attractiveness of
becoming involved in entrepreneurship appears to be
low for many Europeans compared to other possible
sources of income.
A variety of national characteristics could be
underlying this phenomenon. It could be that there
is a lot of red tape (administrative burdens) attached
to starting a business, reducing the attractiveness
of entrepreneurship. It could also be the case that
employment protection is high. This could discourage
employees with positive entrepreneurial perceptions
from switching to entrepreneurship. A different effect
of stringent employment protection is that potential
entrepreneurs may think carefully before hiring
employees due to the substantial losses they would
incur if their employees became unfit for work, or if
they had to reduce the number of workers.
Fear of failure is often considered an important
cultural component that is detrimental to new firm
activity. However, so far this asserted effect has not
been fully confirmed. Every year, GEM asks a random
sample of individuals if fear of failure would prevent
them from starting up a business. In order to grasp
the “fear of failure” effect, it makes sense to consider
this question only for those who are not currently
involved in entrepreneurship but do perceive good
opportunities for setting up a business. If fear of
failure is prevalent among those who in principle see
good opportunities to start a business, this may justify
intervening to reduce fear of failure.
For many countries with factor-driven and efficiency-
driven economies, we see that the difference between
entrepreneurial perceptions and entrepreneurial
intentions is relatively small, or even negative. This
suggests lower opportunity costs for entrepreneurial
activity and higher degrees of necessity-driven
entrepreneurship.
On the right-hand side of Table 1, we present
the results of two indicators measuring national
attitudes to entrepreneurship. The first one assesses
the percentage of inhabitants who feel that in their
country, entrepreneurship is considered a desirable
career choice. This indicator varies widely within
each of the three phases of economic development.
The second indicator relates to the popularity of
entrepreneurship and asks for opinions on the
media coverage for new businesses in the country,
as perceived by the respondents. In countries with
primarily factor-driven economies, these attitudes
should not be the main concern of government (see
Figure 1). In countries with mainly efficiency-driven
economies, attention should begin to be paid to
attitudes. Table 1 suggests that attitudes in Hungary
could be improved, while Latin American countries
have in general quite favorable attitudes.
Looking at innovation-driven countries, some
anomalies are apparent. These could provide
governments with clues as to what they could do to
encourage entrepreneurial activity. For example,
in Japan most people agree that there is a lot of
media attention to entrepreneurship, yet starting
a business is still not regarded as a good career
choice. For Denmark it is the other way around. The
Netherlands shows the highest rates of approval
of entrepreneurship as a career, yet only 4% of the
Dutch adult population (early-stage entrepreneurs
and established business owners excluded) expects
to start a business within the next three years. The
Netherlands is an example of a country where there is
much support for entrepreneurship but where the job
market is also favorable.
16
Entrepreneurial Attitudes, Activity and Aspirations
Factor-Driven Economies
% agreeing
with statement
Angola 74 45 71 44 27 49 46
Bolivia 52 49 38 67 38 81 60
Bosnia and Herzegovina 50 26 39 62 25 82 60
Colombia 65 41 34 54 60 92 78
Ecuador 50 35 33 66 37 79 57
Egypt 40 25 40 53 35 73 57
India 58 46 56 45 33 67 81
Iran 35 22 45 58 36 57 53
Efficiency-Driven Economies
Argentina 48 40 30 53 15 69 80
Brazil 44 43 44 49 26 68 78
Chile 30 34 41 54 29 80 44
Croatia 53 36 51 56 10 70 61
Dominican Republic 58 31 54 70 30 92 64
Hungary 26 47 26 43 6 48 19
Jamaica 52 26 46 65 17 81 71
Latvia 37 37 33 23 7 75 71
Macedonia 47 35 46 52 39 80 66
Mexico 59 31 50 55 26 66 52
Peru 60 38 50 66 34 82 71
Romania 45 52 36 21 9 . 56
Russia 39 66 33 14 3 60 50
Serbia 56 28 52 60 31 72 67
South Africa 60 38 41 31 13 65 69
Turkey 47 39 27 44 21 72 63
Uruguay 57 33 40 58 17 71 67
Innovation-Driven Economies
Belgium 23 30 28 34 6 47 38
Denmark 69 43 43 30 5 57 32
Finland 54 32 46 30 5 46 71
France 34 53 33 25 13 63 48
Germany 35 49 29 30 4 56 50
Greece 35 55 35 46 13 76 55
Iceland 38 36 60 45 12 61 81
Ireland 35 37 33 42 6 55 65
Israel 39 43 35 35 14 58 57
Italy 35 48 30 35 7 68 40
Japan 13 44 21 9 4 26 59
Republic of Korea 20 32 32 23 17 69 67
Netherlands 54 33 32 30 4 85 61
Norway 46 28 34 33 7 61 71
Slovenia 55 33 50 44 7 58 67
Spain 32 52 36 43 5 68 43
United Kingdom 41 38 23 45 5 52 54
United States 44 28 33 48 7 63 73
A) Denominator: non-entrepreneurially active adult population 18-64 years
B) Denominator: non-entrepreneurially active adult population 18-64 years that sees good opportunities to start a business
C) Denominator: adult Population 18-64 years
Source: GEM Adult Population Survey (APS)
Table 1 — Entrepreneurial Attitudes and Perceptions in the 43 GEM Countries in 2008,
by Phase of Economic Development
Sees good
opportunities
for starting a
business in
the next 6
months a)
Fear of
failure
would
prevent
starting
a businessb)
Personally
knows
someone who
started a
business in the
past 2 years a)
Has the
required
knowledge
and skills to
start a
businessa)
Expects
to start a
business
in the
next three
yearsa)
Country attitudes
perceived by individuals
Entrepreneurship
considered as
desirable career
choice c)
Media Attention
for
Entrepreneurshipc)
17
Entrepreneurial Attitudes, Activity and Aspirations
Development in Perceptions, Intentions
and National Attitudes
Figure 3 displays average annual differences between
efficiency-driven and innovation-driven countries
in two types of entrepreneurial attitudes over the
period 2001-2008. Included in this assessment are
only countries that have been participating in GEM
over the entire period, with a maximum dropout of
one year. This includes 17 innovation-driven countries
and six efficiency-driven countries14
. Figure 3 shows
that the developments in perceived opportunities run
reasonably parallel for the two stages of economic
development. Since 2003, the share of people in
efficiency-driven countries that see good opportunities
for start-ups in the area where they live has matched
the share in innovation-driven countries. This finding
is, however, primarily caused by Argentina showing
very low rates before 2003 in the aftermath of the
national economic crisis and showing high rates
afterwards. The GEM surveys have mostly been
conducted in the months May and June. In 2008, this
was after the first signs of a pending financial crisis
but before the scale of the current economic crisis
was fully appreciated15
. However, most countries
show a decline in perceived opportunities from 2007-
2008, and this is reflected in Figure 3. Countries
showing the severest declines in the rate of perceived
opportunities (between 50 and 30 percent) include
Iceland, Chile, Ireland, Latvia and Hungary.
Changes over time in the fear of failure indicator are
shown in Figure 4. The cyclical patterns of efficiency-
driven and innovation-driven countries track each
other fairly well. These patterns also appear to be
the inverse of the opportunity indicator. Fear of
failure has risen to some extent in 2008 for both
types of country, and by around the same amount as
opportunity perception has fallen. This finding can be
directly related to the perceived economic situation.
During recessions failures have bigger consequences,
as alternative sources of income are scarcer.
20%
25%
30%
35%
40%
45%
2001 2002 2003 2004 2005 2006 2007 2008
Innovation-Driven Economies Efficiency-Driven Economies
Figure 3 — Perceived Opportunities for Starting
a Business, 2001-2008
Figure 4 — Fear of Failure among Those who
Perceive Good Start-Up Opportunities,
2001-2008
Note: Each data point is a simple country average for that year
Source: GEM Adult Population Survey (APS)
Innovation-Driven Economies Efficiency-Driven Economies
25%
30%
35%
40%
45%
50%
2001 2002 2003 2004 2005 2006 2007 2008
18
Entrepreneurial Attitudes, Activity and Aspirations
While perceived opportunities have declined and
fear of failure has increased over the period from
2007-2008, perceived skills and knowledge to start
a business have remained stable, as shown in
Figure 5. Individuals’ perceptions about their own
skills do not appear to be affected by the business
cycle. Furthermore, perceived capabilities for
starting a business in efficiency-driven economies
are— on average—higher than in innovation-driven
economies. This is probably because the perception
of an “average” business is different across these
two types of countries (see Bosma and Schutjens,
2009). Therefore the required skills and knowledge to
start a firm generally associated with these “average
businesses” are not completely comparable. If the
average business in Mexico, for example, is associated
with lower required skills in comparison to Norway,
the number of people claiming to have these skills will
obviously be higher.
To find out more about future expectations, since 2002
GEM has asked about intentions to start a business
some time over the next three years. Table 2 shows
the country estimates for this indicator in 2008. Here
the rates of intentions to start a business are expected
to differ between efficiency-driven economies and
innovation-driven economies. In the lower-income
segment of efficiency economies, good job alternatives
are generally more sparsely available. This implies
that more people will intend to start a business.
Indeed we observe this in Figure 6: intention rates are
consistently higher in efficiency-driven countries than
in innovation-driven economies. A second noteworthy
finding is that intentions do not appear to decline
as much in 2008 as perceived opportunities. There
are several possible explanations for this. First, the
crisis may actually cause individuals to seriously
consider becoming entrepreneurs in the near future
because they fear they might lose their jobs. Second,
the group of (potential) future entrepreneurs may be
less pessimistic than the total adult population and
may not perceive the financial crisis as a substantial
burden for getting their own business started—they
might, for instance, draw more heavily on their own
(perceived) capabilities to start a business. Third,
they may have decided to defer the start-up to the end
of the three-year period, in the expectation that the
recession will be over within three years.
Figure 5 — Perceived Skills and Knowledge to
Start a New Business, 2001-2008
30%
32%
34%
36%
38%
40%
42%
44%
46%
48%
50%
2001 2002 2003 2004 2005 2006 2007 2008
Innovation-Driven Economies Efficiency-Driven Economies
Figure 6 — Intentions to Start a New Business
in the Next Three Years, 2002-2008
0%
2%
4%
6%
8%
10%
12%
14%
16%
18%
2001 2002 2003 2004 2005 2006 2007 2008
Innovation-Driven Economies Efficiency-Driven Economies
Note: Each data point is a simple country average for that year
Source: GEM Adult Population Survey (APS)
19
Entrepreneurial Attitudes, Activity and Aspirations
2.2 Entrepreneurial Activity
Table 2 summarizes the involvement in
entrepreneurial activity over several phases of
the entrepreneurial process (see Figure 2) for
each of the 43 GEM 2008 countries. Countries are
grouped according to the major phases of economic
development, consistent with the classification of the
Global Competitiveness Report 2008-2009 (Porter
and Schwab, 2008)16
. Taken together, the numbers
in the table provide a picture of the characteristics
of overall entrepreneurial activity for each country,
i.e., all types of entrepreneurial activity covering
the entire economic spectrum. It is no surprise that
in factor-driven economies, with many small-scale
and local business activities (see Chapter 1), the
rate of involvement is high for both early-stage
entrepreneurial activity and established business
activity. For Angola, however, the rate of established
business activity is very small compared to the
other factor-driven economies, while the rate of
discontinued business is very high. These findings
may reflect Angola’s recent emergence from prolonged
civil war and unrest.
In the United States, there is more early-stage
entrepreneurial activity than in EU-countries and
Japan. The rate of early-stage entrepreneurship in
Japan has gradually increased in recent years and
is now around the EU average. Some European
countries—and most notably Belgium, Germany,
and France—consistently have the lowest rates of
entrepreneurial engagement levels. This possibly
reflects the relative risk aversion of European
inhabitants and their declared relative preference
for employment over self-employment (European
Commission, 2008). But it also indicates that there
are good job alternatives available. It is possible that
in Europe, entrepreneurial behavior manifests itself
more within established firms. This is also known as
“intrapreneurship” and “corporate entrepreneurship.”
Currently little is known about how intrapreneurship
activity differs across countries.
20
Table 2 — Prevalence Rates (in %) of Entrepreneurial Activity and Business Owner-Managers across GEM
Countries in 2008, for those Aged 18-64, by Phase of Economic Development
NASCENT
ENTREPREN-
EURIAL ACTIVITY
NEW BUSINESS
OWNER-MANAGER
EARLY-STAGE
ENTREPRENEURIAL
ACTIVITY (TEA)
ESTABLISHED
BUSINESS-OWNER
MANAGERS
OVERALL
ENTREPREN-
EURIAL ACTIVITY
BUSINESS
DISCONTIN-
UATION RATE
SAMPLE SIZE
18-64 years
Factor-Driven Economies
Angola 19.3 4.1 22.7 4.1 26.0 23.4 1,490
Bolivia 17.4 14.3 29.8 19.1 45.6 10.5 1,879
Bosnia and Herzegovina 6.4 2.7 9.0 8.7 17.1 5.0 1,586
Colombia 13.8 11.7 24.5 14.1 36.7 7.1 2,000
Ecuador 8.7 9.1 17.2 11.9 28.1 5.9 2,142
Egypt 7.9 5.5 13.1 8.0 20.2 6.3 2,603
India 6.9 4.9 11.5 16.5 27.6 10.1 1,919
Iran 5.9 3.4 9.2 6.8 15.7 5.2 3,119
Efficiency-Driven Economies
Argentina 8.5 8.5 16.5 13.5 29.6 10.2 1,731
Brazil 2.9 9.3 12.0 14.6 26.4 3.5 2,000
Chile 8.6 5.8 14.1 6.8 20.2 5.8 4,068
Croatia 4.9 2.8 7.6 4.8 12.3 2.9 1,696
Dominican Republic 11.7 9.8 20.4 8.2 27.9 11.3 2,013
Hungary 3.8 2.8 6.6 5.3 11.8 1.1 1,994
Jamaica 9.0 7.1 15.6 9.1 24.3 8.9 2,399
Latvia 3.9 2.8 6.5 3.0 9.4 1.7 2,011
Macedonia 7.2 7.7 14.5 11.0 24.8 5.3 1,746
Mexico 9.3 4.0 13.1 4.9 17.8 13.6 2,433
Peru 19.7 6.8 25.6 8.3 32.7 10.4 1,990
Romania 2.5 1.6 4.0 2.1 5.9 2.2 1,667
Russia 1.7 2.0 3.5 1.1 4.4 1.1 1,660
Serbia 4.0 3.6 7.6 9.3 16.5 3.7 1,813
South Africa 5.7 2.1 7.8 2.3 9.9 5.8 2,719
Turkey 3.2 3.0 6.0 4.8 10.7 3.9 2,400
Uruguay 7.7 4.4 11.9 7.9 19.3 9.1 1,645
Innovation-Driven Economies
Belgium 2.0 0.9 2.9 2.6 5.3 1.5 1,997
Denmark 2.3 2.3 4.4 4.4 8.4 1.9 2,012
Finland 4.1 3.3 7.3 9.2 16.0 2.1 2,011
France 3.8 1.9 5.6 2.8 8.2 2.2 1,573
Germany 2.4 1.5 3.8 4.0 7.7 1.8 4,751
Greece 5.3 4.6 9.9 12.6 22.0 2.9 1,962
Iceland 6.5 3.6 10.1 7.1 16.7 3.4 2,002
Ireland 3.3 4.3 7.6 9.0 16.3 3.6 1,924
Israel 3.5 3.1 6.4 4.5 10.6 3.2 1,778
Italy 2.0 2.7 4.6 6.5 11.0 1.8 2,970
Japan 3.2 2.3 5.4 7.9 12.7 1.0 1,879
Republic of Korea 3.5 6.5 10.0 12.8 22.6 4.7 2,000
Netherlands 2.1 3.2 5.2 7.2 12.3 1.6 2,534
Norway 5.0 4.0 8.7 7.7 15.8 3.4 1,614
Slovenia 4.1 2.4 6.4 5.6 11.8 1.3 3,019
Spain 3.3 3.9 7.0 9.1 14.8 1.3 30,879
United Kingdom 3.1 2.9 5.9 6.0 11.7 2.1 5,892
United States 5.9 5.0 10.8 8.3 18.7 4.4 3,441
Entrepreneurial Attitudes, Activity and Aspirations
Source: GEM Adult Population Survey (APS)
21
Entrepreneurial Attitudes, Activity and Aspirations
Figure 7 presents early-stage entrepreneurial
activity (TEA) rates for each GEM 2008 country.
The TEA rate is the proportion of people aged 18-64
who are involved in entrepreneurial activity as a
nascent entrepreneur or as an owner-manager of a
new business. The countries are grouped by phase
of economic development and ranked within groups
in ascending order of the national point estimate for
TEA. Note that if the vertical bars on either side of
the point estimates for TEA of any two countries do
not overlap, this means that they have statistically
different TEA rates17
. This figure serves as a
benchmark for countries to see how they compare
to other countries in similar phases of economic
development. It is certainly not the case that higher
TEA rates are always to be preferred. In factor-driven
economies, for example, a reduction in the TEA rate
may be seen as a good sign, and is especially likely
when the general economic climate is doing well
and job opportunities increase. Such reduction in
TEA would typically be due to a decline in the rate
of necessity entrepreneurship. In innovation-driven
economies, a high TEA rate may be specific to regional
economic, demographic, and cultural contexts and may
be composed of entrepreneurs who may vary in type
and aspiration.
GEM reports have demonstrated a consistent
U-shaped association between a country’s level of
economic development and its level and type of
entrepreneurial activity18
. Figure 8 illustrates this
U-shaped relationship between per-capita GDP
levels and TEA rates for 200819
. TEA rates in 2008
are derived from the annual GEM Adult Population
Surveys (APS) administered to representative samples
of the national adult population in 43 countries.
The measure is described in more detail in the
Introduction.
The U-shape pattern can be explained as follows: in
countries with low levels of per capita income the
national economy is characterized by the prevalence
of many very small businesses. As per capita income
increases, industrialization and economies of scale
allow larger and established firms to satisfy the
increasing demand of growing markets and to increase
their relative role in the economy. An important
factor for achieving growth is the presence of macro-
economic and political stability, which is reflected by
the development of strong institutions. The increase
in the role of large firms may be accompanied by a
reduction in the number of new businesses, since a
growing number of people find stable employment in
large industrial plants.
0%
5%
10%
15%
20%
25%
30%
35%
BosniaandHerz.
Iran
India
Egypt
Ecuador
Angola
Colombia
Bolivia
Russia
Romania
Turkey
Latvia
Hungary
Croatia
Serbia
SouthAfrica
Uruguay
Brazil
Mexico
Chile
Macedonia
Jamaica
Argentina
DominicanRep.
Peru
Belgium
Germany
Denmark
Italy
Netherlands
Japan
France
UnitedKingdom
Slovenia
Israel
Spain
Finland
Ireland
Norway
Greece
RepublicofKorea
Iceland
UnitedStates
Factor-Driven
Economies
Efficiency-Driven Economies Innovation-Driven Economies
PercentageofAdultPopulationbetween18-64Years
Figure 7 — Early-Stage Entrepreneurial Activity (TEA) for 43 Nations in 2008, by Phase of Economic
Development, Showing 95% Confidence Intervals
Source: GEM Adult Population Survey (APS)
22
Thus, for countries with low levels of per capita
income, a decrease in prevalence rates of
entrepreneurial activity may be a good sign, especially
if this is accompanied by economic growth and
political stability. As further increases in income are
experienced, the role played by the entrepreneurial
sector may increase, as more individuals can access
the resources to go into business for themselves in an
economic environment that allows the exploitation
of opportunities. Although the annual “snapshot”
of early-stage entrepreneurial activity consistently
shows the shape of the fitted line over the years, it
does not imply that all countries follow this pattern
over time. This is because there are also other
important national conditions that determine the
rate of early-stage entrepreneurial activity. Also,
the upward slope for high-income countries is only
partially explored because the number of countries
with very high per capita income is limited. There is
no reason to expect that the upward slope will be as
steep as the downward slope.
The dispersion of TEA country estimates around
the line of best fit in Figure 8 demonstrates that
entrepreneurship rates are not just a function of
differences in economic development (or welfare) but
also of other factors. Entrepreneurship is not just an
economic event; it is a socio-economic phenomenon.
National societies and their economies are to a
large extent shaped by historical developments. The
rapidly expanding body of entrepreneurship studies
as well as ten years of GEM research indicates that
entrepreneurial activity rates may differ across
countries for cultural, institutional, economic, and
demographic reasons. For example, motivations,
regulations, and enforcement of regulations for setting
up a business can be vastly different across the globe.
Geographical patterns can also be witnessed in Figure
8: it shows that countries with similar geographic
backgrounds and traditions tend to cluster together. A
group of EU-15 countries is situated close together at
the lower end of early-stage entrepreneurial activity.
Countries in Eastern Europe and Central Asia are
mainly situated at the left hand side, below the fitted
curve —even though over the years they appear to
move toward the curve. People in these countries are
not as much engaged in entrepreneurial activity as
citizens of Latin American countries, the Caribbean,
and Angola with similar levels of per capita GDP.
Wealthier countries at the upper right-hand side are
industrialized countries outside the EU—with Ireland
0%
5%
10%
15%
20%
25%
30%
0 10,000 20,000 30,000 40,000 50,000 60,000
GDP Per Capita, in Purchasing Power Parities (PPP)
IN
BO
EG
BA
YU
EC
PE
CO
AO
DO
MK
JM AR
BR UY
MX
CL
IR
ZA
RO
TR
RU
HR
LV HU
KR
GR
SI
IT
FR
IL
JP
BE
DE
DK
NL
ES
FI
UK
IS
IE
US
NO
PrevalenceRateofEarly-StageEntrepreneurialActivity
AO: Angola
AR: Argentina
BA: Bosnia & Herz.
BE: Belgium
BO: Bolivia
BR: Brazil
CL: Chile
CO: Colombia
DE: Germany
DK: Denmark
DO: Dominican Rep.
EC: Ecuador
EG: Egypt
ES: Spain
FI: Finland
FR: France
GR: Greece
HR: Croatia
HU: Hungary
IE: Ireland
IL: Israel
IN: India
IR: Iran
IS: Iceland
IT: Italy
JM: Jamaica
JP: Japan
KR: Rep.of Korea
LV: Latvia
MK: Macedonia
MX: Mexico
NL: Netherlands
NO: Norway
PE: Peru
RO: Romania
RU: Russia
SI: Slovenia
TR: Turkey
UK: United Kingdom
US: United States
UY: Uruguay
YU: Serbia
ZA: South Africa
Source: GEM Adult Population Survey (APS) and IMF: World Economic Outlook Database (October 2008 edition)
Figure 8 — Early-Stage Entrepreneurial Activity Rates and Per Capita GDP, 2008
Entrepreneurial Attitudes, Activity and Aspirations
23
as a notable exception. Japan’s rate of early-stage
entrepreneurial activity has, over the years, been
consistently lower than the fitted curve, but has been
increasing in recent years and is now very similar to
the EU-average.
As the 2007 GEM report demonstrated, institutional
characteristics, demography, entrepreneurial culture,
and the degree of economic welfare all shape a
country’s entrepreneurial landscape. The factors
of culture, demography, institutions, and economic
welfare are linked. For example, national institutions
reflect the national culture, since they are designed
to formalize norms and values of the country. Also,
countries with well-developed institutions generally
exhibit higher degrees of welfare. Chapter 3 further
explores the role of institutions in enhancing high
impact entrepreneurship.
Entrepreneurial Motivations
Although most individuals are pulled into
entrepreneurial activity because of opportunity
recognition, others are pushed into entrepreneurship
because they have no other means of making a living
or because they fear becoming unemployed in the near
future. For those who are pulled to entrepreneurship,
two major drivers of opportunity entrepreneurship can
be identified: those who are pulled primarily because
they desire independence, and those who are primarily
pulled to entrepreneurship because they want to
increase their income as compared to, for instance,
being an employee. The remaining share includes
people who maintain that they have no other way of
earning a living (necessity-motivated entrepreneurs)
and people who became involved in entrepreneurial
activity primarily to maintain their income20
. We
should note that GEM may underestimate necessity
entrepreneurship and overestimate opportunity
entrepreneurship. The relevant question in the
GEM survey forces respondents to choose between
“no better options for work” and “exploit business
opportunities”. That is, there is little room for choosing
an option between these extremes and those who find
themselves in between may opt for the latter option
more frequently—even if they are in fact closer to the
former.
In 2007, the calculation method for opportunity-driven
early-stage entrepreneurial activity (opportunity-TEA)
was refined. It includes only those who are pulled to
entrepreneurship by opportunity and because they
desire independence or to increase their income, not
those who are pushed to entrepreneurship out of
necessity or those who sought only to maintain their
income. Relative prevalence rates are shown in Figure
9 in black. The countries with high relative prevalence
of improvement-driven opportunity entrepreneurship
are primarily innovation-driven countries. In these
countries, opportunities may be expected to be
more abundant, and individuals may have more
alternatives to make a living. Therefore, the trend of
the degree of opportunity TEA in relation to GDP per
capita gradually slopes upward in Figure 9. The green
line describes the pattern of the degree of necessity
entrepreneurship and is downward sloping21
. Thus,
when countries progress in economic development,
their rate of necessity entrepreneurship decreases.
This is a clear example of economic development
impacting the TEA rate and not the other way
around. The different slopes of the two trend lines
give support for the interpretation of the U-shaped
pattern in Figure 8 as outlined above. An important
implication is that when linking entrepreneurship to
economic development, the phase of national economic
development should be taken into account.
Discontinuing Business
Business discontinuation is an important feature of
dynamic economies and entries and exits of businesses
are closely correlated22
. Table 2 displays prevalence
rates of people who discontinued, sold, or quit a
business in the twelve months preceding the GEM
survey. It can be seen that business discontinuance
rates are relatively high in factor-driven economies
(in Angola, for example, the reported rate is as much
as 23%) and relatively low in innovation-driven
economies. Among high-income countries, Norway, the
United States, Republic of Korea, Iceland and Ireland
have the highest rates of business discontinuation.
This suggests that in some countries, there is a rapid
turnover of business experiments.
Many businesses that are discontinued are not failed
businesses. In a study by Headd (Headd, 2003),
owners of about one-third of all firms that closed
said their firm was successful at closure. In 2008,
GEM respondents who said they had discontinued
a business in the last 12 months were asked if their
business continued. It appears that, on average, about
one-third of the businesses that were discontinued
by a GEM respondent continued in another form
or with different ownership. The respondents who
discontinued a business in the last 12 months were
also asked to state the most important reason for
doing so. Figure 20 shows that the discontinuation
of a business does not necessarily mean the business
failed.
Financial problems were cited as the reason for
quitting the business by no more than 55% of all
respondents; it was cited more often by respondents in
the factor- and efficiency-driven economies (just over
50%) than innovation-driven countries (just over 40%).
The business itself not being profitable was the most
reported financial problem. Problems with raising
finance were considerably lower in innovation-driven
Entrepreneurial Attitudes, Activity and Aspirations
24
R2= 0.41
R2= 0.55
0%
10%
20%
30%
40%
50%
60%
70%
80%
90%
100%
0 10,000 20,000 30,000 40,000 50,000 60,000
GDP Per Capita, in Purchasing Power Parities (PPP)
Improvement-driven opportunity Necessity; no better options for work
Linear trend Exponential trend
Opportunity&NecessityMotivations,in%ofTEA
Source: GEM Adult Population Survey (APS) ) and IMF: World Economic Outlook Database (October 2008 edition)
Figure 9 — Necessity- and Improvement-Driven Opportunity Motivations as a Percentage of Early-Stage
Entrepreneurial Activity, GEM 2008 Countries
0%
10%
20%
30%
40%
50%
60%
70%
80%
90%
100%
Factor-Driven
Economies
Efficiency-Driven
Economies
Innovation-Driven
Economies
Incident
Personal reasons
Retirement
Exit was planned in
advance
Other job or business
opportunity
Opportunity to sell
Problems getting
finance
Business not profitable
Figure 10 — Expressed Reasons Behind Discontinuing Businesses, by Age, GEM 2008
Source: GEM Adult Population Survey (APS)
Entrepreneurial Attitudes, Activity and Aspirations
25
countries where the Entrepreneurial Framework
Condition “Entrepreneurial Finance” is generally
more developed. “The opportunity to sell” and in
particular “retirement,” were mentioned more often
in innovation-driven countries as the most important
reason to discontinue the business. Personal reasons
caused around 20 – 25% of all discontinuations. Such
reasons could include sickness, family, or business
partner bereavement, divorce, the need to finance
an event such as a wedding through sale of business
assets rather than the business itself, or simply
boredom. They were more prevalent in factor- and
efficiency-driven countries.
For many entrepreneurs who exit a business, it is
not the end of their entrepreneurial career, but a
new beginning. “Entrepreneurial recycling” (Mason
and Harrison, 2006) manifests itself in two main
ways. First, exited entrepreneurs may start again.
This phenomenon is more than twice as prevalent
in factor-driven and efficiency-driven economies
than in innovation-driven economies. Seventeen
percent of nascent entrepreneurs in both factor-
driven economies and efficiency-driven economies had
stopped running a business in the past year, compared
with 8% of nascent entrepreneurs in innovation-
driven economies. Second, exited entrepreneurs are
more likely to invest in other people’s businesses than
the rest of the population. Almost a fifth of exited
entrepreneurs in all three country groups were recent
informal investors: around four to five times that of
other people in factor-driven and efficiency-driven
economies and seven times that of other people in
innovation-driven economies.
Sector Distributions
Figures 11 and 12 show the distribution of early-
stage entrepreneurial activity and established
business owner-managers by industry sector and
phase of economic development. This distribution is
different in each of the three major phases of economic
development. Extraction businesses (farming, forestry,
fishing, mining) are more prevalent in factor-driven
economies, transforming businesses (manufacturing
and construction) are more prevalent in efficiency-
driven economies, and business services are more
prevalent in innovation-driven economies. The
reducing prevalence of consumer services across the
three major phases is particularly noticeable. Such
services tend to have relatively low resource needs
and are often local in nature, particularly in countries
with poorly developed transportation and commercial
infrastructure.
0% 20% 40% 60% 80% 100%
Factor-Driven
Economies
Efficiency-Driven
Economies
Innovation-Driven
Economies
Extractive Transforming Business Services Consumer oriented
0% 20% 40% 60% 80% 100%
Extractive Transforming Business Services Consumer Oriented
Factor-Driven
Economies
Efficiency-Driven
Economies
Innovation-Driven
Economies
Figure 11 — Sector Distribution Early-Stage
Entrepreneurial Activity
Figure 12 — Sector Distribution
Established Business
Source: GEM Adult Population Survey (APS)
Entrepreneurial Attitudes, Activity and Aspirations
26
Age and Gender Structure
Figure 13 demonstrates that in each phase of
economic development, prevalence rates of early-stage
entrepreneurial activity differ across age groups.
The shapes of the age distributions are very similar
across country groups. The 25-34 years age group
has the highest prevalence rate for every phase of
economic development. Thereafter the prevalence
rates decrease as age increases. This inverted U-shape
pattern reflects the interaction between desire to
start a business, which tends to reduce with age, and
perceived skills, which tends to increase with age.
Figure 14 displays the differences in female and
male participation for each country in GEM 2008,
ordered by major phase of economic development and
female participation rate23
. The ratio of female to
male participation varies considerably in each phase,
reflecting different culture and customs regarding
female participation in economic activity. In some
factor-driven economies, for example Ecuador and
Bolivia, female TEA rates are just below male TEA
rates. In Angola, women are actually more likely
to be involved in early-stage activity than to men.
The situation is very different for Egypt, reflecting
different culture and customs. For efficiency-driven
economies, the gender gap in TEA rates is also quite
low in many Latin American countries and Jamaica.
In many, but not all, eastern European countries male
TEA rates are substantially higher than female TEA
rates. In innovation-driven countries, the general rule
of thumb is that men are twice as likely to be involved
in early-stage entrepreneurial activity than women.
However, this gap is lower in Germany, Spain, Greece,
and the United States.
Trend in Early-Stage Entrepreneurial Activity
2001-2008
According to classic economic thinking, one would
expect that when the business cycle is less favorable,
fewer people will be involved in entrepreneurial
activity because the expected returns are lower in
comparison to times of economic prosperity. A counter
argument is the so-called “refugee” hypothesis
(Storey, 1991; Thurik et al.,, 2008). This hypothesis
implies that when recessions loom, the number of
people involved in TEA should become higher because
employees either fear that their salaries are at risk,
or they have already been let go and self-employment
is the last resort. Figure 9 showed that necessity
entrepreneurship played a relatively small role in
innovation-driven countries in 2008; all high-income
countries fall under the category of innovation-driven
countries. In fact, a large share of TEA consists of
people whose main driver for starting up a business
is the fact that they can work independently. If one
accepts that desire to be independent is the main
driver, little difference over time can be expected for
national TEA rates in innovation-driven countries.
0%
5%
10%
15%
20%
25%
30%
Factor-Driven
Economies
Efficiency-Driven
Economies
Innovation-Driven
Economies
PercentageofAdultPopulationinAgeGroup
18-24 YRS
25-34 YRS
35-44 YRS
45-54 YRS
55-64 YRS
Figure 13 — Early-Stage Entrepreneurial Activity for Separate Age Groups, 2008
Source: GEM Adult Population Survey (APS)
Entrepreneurial Attitudes, Activity and Aspirations
27
Factor-Driven
Economies
Efficiency-Driven Economies Innovation-Driven Economies
Percentageof(Fe)MalePopulationbetween18-64Years
RepublicofKorea
Figure 14 — Early-Stage Entrepreneurial Activity Rates by Gender, 2008
Note: Countries are ordered along phase of economic development and female early-stage entrepreneurial
activity rates
Source: GEM Adult Population Survey (APS)
Figure 15 displays the trend in average annual TEA
rates from 2001 to 2008 for a subset of GEM efficiency-
driven and innovation-driven countries. These are all
countries that have been part of GEM since 2001 and
have missed at most one year of data collection24
. Data
is available for only six efficiency-driven economies:
Argentina, Brazil, Chile, Croatia, Hungary and South
Africa, so the results should be interpreted with
some care. A total of 17 innovation-driven economies
had sufficient data to be included. Figure 15 shows
that the overall development over time of TEA in
innovation-driven economies is quite stable. A slight
and gradual rise is observed, from 5.7% in 2002 to
6.4% in 2008. The rates of necessity-driven TEA
are shown in Figure 16 and have, on average, been
very stable as well. For efficiency-driven economies,
the pattern is more sensitive to the business cycle.
Argentina, in particular, has shown a significant
reaction to its national economic crisis; in 2001-
2003, the Argentinean rate of necessity early-stage
entrepreneurs rose from 3.9 to 7.4 percent. It leveled
off afterwards as the national economy recovered, but
has been increasing again in recent years.
It remains an unanswered question how much the
current global economic crisis will impact necessity-
driven TEA rates in efficiency-driven countries
and innovation-driven countries. Even though the
collapse of the internet bubble in 2001 did not seem
to significantly affect overall TEA rates in innovation-
driven countries, the current crisis clearly poses more
threats to entrepreneurial activity and economic
activity in general. Those looking to GEM data for
guidance should bear in mind that the TEA rate covers
several phases of the start-up process. It includes
the pre-start-up phase—from the moment of actively
starting a business—and the post-start-up phase, up
to the moment a business is up and running for 42
months. In addition, most of the GEM 2008 surveys
were conducted before the summer, when the true
size of the crisis had not manifested itself yet. This
means that the impact of the crisis on TEA rates has
not yet become apparent. This will to a large extent
also hold for the 2009 results; for example, individuals
who started their business in 2007 will still be seen
as early-stage entrepreneurs. However, it is expected
that in due course the crisis will impact both the pre-
start-up phase and the post-start-up phase of early-
stage entrepreneurship in some ways (see Box 3).
Entrepreneurial Attitudes, Activity and Aspirations
28
Figure 15­— Early-Stage Entrepreneurial Activity (TEA) Rates for 2001-2008, Averages
over Efficiency-Driven Countries and Innovation-Driven Countries
Innovation-Driven Economies Efficiency-Driven Economies
Figure 16 — Necessity-Driven TEA Rates for 2001-2008,
Averages over Efficiency-Driven Countries and Innovation-Driven Countries
Note: Each data point is a simple country average for that year
Source: GEM Adult Population Survey (APS)
Innovation-Driven Economies Efficiency-Driven Economies
Entrepreneurial Attitudes, Activity and Aspirations
29
Box 3. How Does the Current Economic Crisis
Affect Entrepreneurship?
It is clear that the current economic crisis will have
a substantial impact on entrepreneurship. The
crisis started off in the financial sector but has—at
the time this report went into print—already hit
many other parts of the economy severely and
production growth has come to a halt in many
industries, in many countries. In this insert, we
discuss some important implications of the crisis
for entrepreneurship along the three identified
components of attitudes, activity, and aspiration.
The crisis may have different effects on different
types and phases of entrepreneurship, resulting
in both negative and positive trends in activity.
Entrepreneurship is thought to be one of the
mechanisms that helps turn around recessions by
reallocating resources in such a way that promising
new activities replace obsolete economic activities.
However, this only works well if institutions,
captured by the Entrepreneurial Framework
Conditions (EFCs) in Figure 1, are conducive to
this particular entrepreneurship mechanism and
do not, for instance, artificially keep alive obsolete
types of economic activity.
Attitudes and Perceptions
The GEM Adult Population Survey measures
several perceptions toward entrepreneurship of a
representative sample of adults. As a result of the
recession, their perceived opportunities for starting
a business will be lower because of (i) declining
demand for products and thus declining expected
returns, and (ii) lower supply of entrepreneurial
finance caused by banks being more risk averse.
This GEM publication already reports a decline
in perceived opportunities for starting a business.
Fear of failure is also higher because the
implications of failure are higher: there are fewer
alternatives available on the job market for those
who will not be able to make their start-up venture
sustainable.
The issue of access to entrepreneurial finance
is especially important for entrepreneurs who
envision a sizeable new venture. The GEM
2006 Financing Report demonstrates that most
business founders expect to finance their venture
themselves, and for those who do seek external
sources of funding, relatively small sums are
involved (Bygrave and Quill, 2007). There may
be a trade-off between accessibility of external
funding and the cost of resources. In a recession,
under-used assets will be released by failing
businesses and recycled at a relatively low cost by
other businesses, including new businesses. Also,
the decision to become an entrepreneur is not only
about expected financial returns versus risk, it is
also about (self-perceived) abilities (Davidsson,
1991). Perceived skills are not likely to be affected
by the crisis. The GEM perceived start-up skills
and knowledge indicator—in contrast to perceived
opportunities and fear of failure—was stable in
2008.
National attitudes towards entrepreneurship in
general are unlikely to change dramatically. Such
attitudes include the degree to which people view
entrepreneurship as a good career choice, and
the degree to which the media pays attention to
entrepreneurship.
Activity
Entrepreneurial activity comprises a static
component (in GEM, this is represented by
economic activity in “established” businesses)
and a dynamic component that focuses on early-
stage entrepreneurial activity, but it also includes
new economic activities conducted by established
businesses. Many established businesses in
established sectors may see their turnover dropping
due to a reduction in demand. Their profits may
decrease and the resources for investments may
decrease sharply. Expansion may be more difficult
for cash-poor businesses. Factories will stop their
production or might even close permanently.
Established businesses operating in niche markets,
or serving the lower-ends of the market, may be
less harmed, and businesses that are cash-rich may
find good opportunities for growth by acquisition as
the value of business assets drops.
The static component of entrepreneurship is
important for preserving economic stability.
Governments may seek to support the existing
stock of businesses to some extent and help to
preserve big and important companies, as well as
help the small business sector to survive. In fact,
many small businesses’ existence is dependent on
the needs of larger businesses. However, companies
that find themselves in trouble not only due to the
financial crisis, but also because their products and
services are essentially outdated, should perhaps
not be supported unless they adjust their economic
strategy. It is unavoidable that the number of
discontinuations will increase. The challenge for
governments is to keep alive those firms that still
have good potential to do well in the longer run.
While established businesses are important for
preserving stability, early-stage entrepreneurship
Entrepreneurial Attitudes, Activity and Aspirations
30
is important for creating dynamism in economic
activity. Of course, pessimistic economic projections
may lead to fewer people starting up a business.
However, (pending) job losses may also result in
more necessity-motivated entrepreneurship. In this
particular recession, the first group of people to be
affected in this way, those in the financial sector,
exhibit high levels of human capital and financial
capital relevant to entrepreneurship. Thus, the
recession could trigger teams of bright individuals
in the financial sector to start their own companies
based on new but commonly shared principles. This
would in effect be a bottom-up process of reshaping
the financial sector to fit the needs of the current
globalized economy. It is up to national authorities
to recognize and support such new initiatives
where they can.
Most individuals who planned to start a business
just before the crisis emerged are unlikely to
change these intentions, especially if they are
driven by the wish to work independently—which
is the case with most entrepreneurs in innovation-
driven countries. Figure 15 confirms that on
average, there has been no significant change
in TEA in innovation-driven countries over the
past year. Many individuals involved in the pre-
start-up phase, however, may have to rethink
their products and strategies. It is often easier
to adjust a business model in the pre-start-up
phase than in the established stage. Banks and
other investors, being less eager to lend money,
will ensure a very thorough selection of new
business activities. In conclusion, the dynamic
component of entrepreneurship, in the form of not
only early-stage entrepreneurial activity but also
new business activities carried out by established
businesses, may be important for the change
in economic activity that is needed to overcome
recessions.
Aspirations
Since many early-stage entrepreneurs lean on
their own skills and knowledge when setting
up their businesses, the impact of the crisis on
growth expectations may be rather low. However,
some new realism may be found among nascent
entrepreneurs. In general, nascent entrepreneurs
tend to overestimate their expected growth
(Koellinger, 2008), but it has also been observed
that those who expect to grow significantly
will, after a few years, exhibit such expansion
more often than low-expectation entrepreneurs
(Davidsson and Wiklund, 1997).
To some extent, the recession can stimulate
innovative entrepreneurship. In economic booms,
much money is spent on research and development,
but the resulting innovations have often not yet
been implemented in new business activities
because the “old” products and processes are
still generating good returns. Times of recession
are often used to actually implement changes in
businesses. This especially goes for established
business activities because there is always much
internal resistance to organizational changes.
Innovations in recessions often pave the way
for a new period of prosperity. For example, the
first supermarket in America started up at the
beginning of the Great Depression (Hirooka, 2003).
Economic downturns trigger economic activity that
is directed toward the future, rather than activity
merely prolonging established routines.
Entrepreneurial Attitudes, Activity and Aspirations
31
Source: GEM Adult Population Survey (APS).
Entrepreneurial Attitudes, Activity and Aspirations
2.3 Entrepreneurial Aspirations
High-Growth Expectation Entrepreneurship
Studies show that relatively few early-stage
entrepreneurial firms contribute a disproportionate
share of all new jobs created by new firms (Autio,
2007). In the following analysis, seven years of GEM
data (years 2002-2008) are combined to take a closer
look at how growth ambitions differ among early-
stage entrepreneurs25
. The GEM method enables
the categorization of early-stage start-up attempts
according to their growth ambition. GEM asks all
identified early-stage entrepreneurs how many
employees they expect to have within five years’ time.
Expectations of high-growth are rare among nascent
and new entrepreneurs. Seventy percent of all start-
up attempts expected any job creation. Only 8% of
all start-up attempts expected to create 20 or more
jobs. In the remainder of this section, we focus on the
prevalence of new and nascent entrepreneurs who
expect their business will employ at least 20 people
in five years’ time. This is known as high-growth
expectation early-stage entrepreneurial activity, or
HEA.
Figure 17 presents the HEA rate in GEM countries
for which a sufficient sample size was available,
grouped on the basis of per capita GDP. The vertical
bars indicate the 95% confidence interval. If vertical
bars overlap between two countries, the difference
between those countries is not considered statistically
significant.
Figure 17 is broadly consistent with the notion that
national HEA rates vary with economic context. The
United States, New Zealand, Iceland, and Canada
have higher levels of HEA than other innovation-
driven economies. The HEA rate for these countries
is well over 1%. In the United Kingdom, Switzerland,
Germany, Slovenia, Norway, and Denmark, the HEA
rate is between 0.5 and 0.8%. The lowest levels of
HEA, at under 0.5%, occur in Belgium, France, Spain,
Japan, Finland, and Greece. Within innovation-driven
economies, the differences in prevalence rates of HEA
are considerable, ranging from the United States and
Iceland’s mean of over 1.5%, to approximately 0.3% in
Belgium.
HEA rates can vary even among broadly similar high-
income countries. Among the large EU economies, the
United Kingdom and Germany clearly exhibit higher
levels of HEA than France and Spain. In the Benelux
countries, the Dutch HEA rate is higher than the
Belgian HEA rate. In Scandinavia, the level of HEA in
Iceland is four times higher than that of Finland.
Of the factor- and efficiency-driven countries,
Colombia, China, Peru, and Chile exhibit the highest
prevalence rates of high-expectation entre­pre­neur­
ship26
. In fact, the HEA rate for China is the highest
of any GEM country, even though it is not statistically
different from that of the United States, New Zealand,
and Iceland. Most other middle- and low-income
countries in the sample exhibit lower HEA rates than
most high-income countries. It is notable that India’s
HEA rate is less than one-fifth that of China.
0.0%
0.5%
1.0%
1.5%
2.0%
2.5%
3.0%
3.5%
4.0%
India
China
Colombia
Mexico
Hungary
SouthAfrica
Brazil
Croatia
Thailand
Latvia
Turkey
Argentina
Chile
Peru
Belgium
France
Spain
Japan
Finland
Greece
Netherlands
Sweden
Italy
Germany
Slovenia
Norway
Switzerland
Denmark
UnitedKingdom
Australia
HongKong
Ireland
Singapore
Canada
NewZealand
UnitedStates
Iceland
Factor-
Driven Efficiency-Driven Innovation-Driven
Percentage of adult population between 18-64 years
PercentageofAdultPopulationbetween18-64Years
Figure 17 — Prevalence Rates of High-Growth Expectation Early-Stage
Entrepreneurship (HEA) in the Adult Population
32
Efficiency-Driven Innovation-Driven
PercentageofEarly-StageEntrepreneurs
Factor-
Driven
Figure 18 — Anatomy of High-Growth Expectation Early-Stage Entrepreneurship (HEA):
Percentages in TEA
Efficiency-Driven Innovation-Driven
PercentageofEarly-StageEntrepreneurs
Factor-
Driven
Figure 19 — Percentage of Early-Stage Entrepreneurial Activity with New Product-Market
Combination, 2002-2008
Entrepreneurial Attitudes, Activity and Aspirations
Source: GEM Adult Population Survey (APS)
33
An analysis of the anatomy of entrepreneurial
activity (defined as the relative prevalence of HEA
entrepreneurs among all TEA entrepreneurs) reveals
a slightly different pattern to that shown in Figure 17.
Figure 18 shows that the countries with arguably the
“healthiest” entrepreneurial anatomies, in this sample
of nations, are Singapore, Latvia, Hong Kong, China
and Turkey. In Singapore and Hong Kong, over 20%
of nascent and new entrepreneurs aspire for rapid
growth, the highest relative prevalence of HEA of
all innovation-driven countries in the sample. Thus,
in spite of their low overall rate of entrepreneurial
activity, the contribution of entrepreneurs to
these two densely populated economies may be
quite significant27
. Greece and Spain stand out
as countries where very few nascent and new
entrepreneurs (around 5%) anticipate creating a
business of significant size. Also France, Finland,
Belgium, Australia, and Norway exhibit low levels of
entrepreneurial growth ambition, with less than 10%
of all start-up attempts expecting high-growth.
Among factor-driven and efficiency-driven economies,
China’s nascent and new entrepreneurs appear to be
the most growth-oriented, with nearly 20% of them
anticipating high-growth. Early-stage entrepreneurial
activity in India and Mexico, on the other hand, is
marked by low levels of growth expectation.
In summary, innovation-driven economies typically
have a higher relative prevalence of HEA than
efficiency-driven and factor-driven economies. There
are notable exceptions to this overall pattern, however.
Some high-income countries have low relative
prevalence of HEA and some middle- and low-income
economies have high relative prevalence.
Innovation- and Technology- Oriented
Entrepreneurial Activity
The essence of Schumpeter’s (1942) theory of
creative destruction is that entrepreneurs distort
the market equilibrium by introducing new product-
market combinations or innovations. Sometimes
they use new technologies to do so. By innovating,
entrepreneurs drive less productive firms out of
the market and advance the production frontier.
Innovation is therefore an important means by which
entrepreneurial firms contribute to economic growth.
GEM assesses innovation in entrepreneurial
businesses in a variety of ways. First, there are
assessments of early-stage entrepreneurs and
established business owner-managers concerning
the novelty (or unfamiliarity) of their products or
services relative to customers’ current experience. A
second way that GEM assesses the innovativeness of
entrepreneurial businesses is by measuring the degree
of competition faced by the business, or whether the
owner-manager perceives that many, few, or no other
businesses offer similar products or services.
Figure 19 evaluates GEM countries on an index that
combines the two measures of innovation discussed
above (product novelty and degree of competition), and
Efficiency-Driven Innovation-Driven
PercentageofEarly-StageEntrepreneurs
Factor-
Driven
Figure 20 — Percentage of Early-Stage Entrepreneurial Activity Active
in Technology Sector, 2002-2008
Entrepreneurial Attitudes, Activity and Aspirations
Source: GEM Adult Population Survey (APS)
34
Entrepreneurial Attitudes, Activity and Aspirations
ranks countries in their country groups on the relative
prevalence of innovative early-stage entrepreneurial
activity. In essence, this index measures the
percentage of early-stage entrepreneurs with novel
product-market combinations. These entrepreneurs
offer a product or service they believe is new to some
or all customers and they also believe that there are
few or no businesses offering the same product. In
order to derive more precise estimates, we combined
GEM data from 2002-2008.
Looking at the country groups, it is apparent that
in each group there are countries with high and
low relative prevalence of innovative early-stage
entrepreneurial activity. Interestingly, within the
innovation-driven country group, the EU-countries
emerge as having—on average—the highest relative
prevalence. The figure shows, however, a wide
variation in relative prevalence, even within the
EU block. For example, Greece, Spain, and Italy
have relatively few new product-market oriented
entrepreneurs in early-stage entrepreneurial activity,
whereas Denmark, Slovenia, France, and Ireland have
high rates. Among other innovation-driven countries,
it is striking that Asian countries have low relative
prevalence.
Turning to factor-driven and efficiency-driven
countries, Figure 19 demonstrates that factor-driven
countries tend to have lower rates of innovative
early-stage entrepreneurial activity, and that some
efficiency-driven countries appear to have the highest
rates of all countries in the sample of GEM nations.
In considering these patterns, it is important to
bear in mind that this index works well if both
the availability of new products and services and
the strength of competition are evenly distributed
throughout the world. This is a big assumption to
make. By comparing within country groups, we control
to some extent for differences in product availability
and ferocity of competition. But it may be that some
countries score high on this index merely because
relatively few new products are available in them and
competition is weak.
Information on the business activities of nascent
entrepreneurs and owner-managers is available in
some detail from the GEM Adult Population Surveys28
.
For example, the share of early-stage entrepreneurs
who are active in technology sectors according to
the OECD definition can be estimated29
. Figure 20
presents these percentages for the selected set of GEM
2008 countries. This figure confirms that countries
in the innovation-driven stage have higher shares
of technology-related early-stage entrepreneurial
activity. Also here, some European countries tend
to score high, although some can also be found at
the lower end of the ranking of innovation-driven
economies on this measure. Chile, Russia, and Latvia
score high among efficiency-driven economies. India,
Thailand, and Brazil have the lowest scores.
35
Entrepreneurial Attitudes, Activity and Aspirations
In 2007, the IIIP Innovation Confidence Index
was developed by the Institute for Innovation &
Information Productivity (IIIP) in association with
GERA. This year, 26 GEM countries collected
data on personal innovation confidence through
the Adult Population Survey (APS), more than
doubling the number of participating countries30
.
The premise behind the Index is that innovative
entrepreneurs need customers who are willing
to buy new products and services and to try
products and services that utilize new technology
(Bhidé, 2006). Consumers who are receptive to
such innovations tend to believe that they will
improve their life. The index captures these three
dimensions of innovation confidence: willingness
to buy new products or services, willingness to try
products or services that involve new technology,
and the belief that new products or services will
improve one’s life. Each dimension is measured
using a five-point scale and then combined into
an index at the country level31
. The final IC
Index is the average percentage of the sample
agreeing to each item. Figure 21 plots the results
in rank order by country. It shows that innovation
confidence varies widely, even among countries
at similar stages of economic development, but
tends to be lower in more developed economies.
The IC Index correlates positively with early-stage
entrepreneurial activity (r = .642, p = .000) and
negatively with the mean age of the working age
(18-64) population (r = -.603, p = .001).
Seven countries participated in both 2007 and
2008, enabling an estimate of the stability of the
index. The correlation of the 2007 and 2008 IC
indices for all seven nations was .966 (p = .000).
The index does not appear to be just measuring
consumer confidence. AC Nielsen found that
consumer confidence in April 2008 dropped by
10 to 20% of the point estimate for April 2007 in
five of these seven countries. In one country, it
remained unchanged and the other country was
not measured. By contrast, the IC Index in six of
these nations dropped by only around 2 to 4% of the
2007 value; only in the UK did it drop by as much
as 9% of the previous year’s point estimate. The
IC Indices and annual changes were uncorrelated
with their respective GCC Indices and their annual
changes. This suggests that the IC Index is stable
and does not track consumer confidence. For more
details on the IIIP Innovation Confidence Index,
see www.iii-p.org.
Where innovation and productivity meet...
0%
10%
20%
30%
40%
50%
60%
70%
80%
China
Iran
Ecuador
Angola
India
Colombia
Countryaverage2008
Turkey
Croatia
Mexico
Macedonia
Chile
Argentina
Brazil
SouthAfrica
Jamaica
Peru
Uruguay
Countryaverage2008
Japan
Netherlands
Finland
RepublicofKorea
Israel
Slovenia
UnitedKingdom
Iceland
Italy
UnitedStates
Ireland
Spain
UnitedArabEmirates
Countryaverage2008
Efficiency-Driven Econnomies
IC Index 2007 IC Index 2008 Country Average IC Index 2008
Innovation-Driven EconomiesFactor-Driven Economies
Figure 21 — Innovation Confidence Index for 2007 and 2008 by Country and Country Group
Box 4. The Institute for
Innovation & Information
Productivity
36
The interdependence of economic development and
socio-political change is generally recognized by
social scientists (Adelman and Morris, 1965). Joseph
Schumpeter provided an early statement on this
(Schumpeter, 1934). In recent years, economists have
come to recognize what Leibenstein (1968) termed
the “input-completing” and “gap-filling” capacities of
potential entrepreneurial activity in innovation and
growth, and the significant contribution of innovation
and growth to prosperity and economic welfare (Acs
and Armington, 2006; Schramm, 2006; Audretsch,
2007). Entrepreneurship is considered to be an
important mechanism for economic development
through employment, innovation, and welfare effects
(Wennekers and Thurik, 1999; Baumol, 2002).
The environment shaping the economy affects
the dynamics of entrepreneurship within any
given country. This environment is marked by
interdependencies between economic development
and institutions, which affect other characteristics
such as quality of governance, access to capital, and
other resources, and the perceptions of entrepreneurs.
Institutions are critical determinants of economic
behavior and economic transactions in general, and
they can impose direct and indirect effects on both the
supply and demand of entrepreneurs. Therefore, if
one is interested in understanding entrepreneurship
within or across countries, the broad nexus among
entrepreneurship, economic development, and
institutions is a critical area of inquiry. This nexus is
especially important in helping understand why the
relative contributions of entrepreneurship can vary
significantly across countries and regions.
Understanding this nexus is crucial to gain insight
into what can work for economic development. This is
for the following two reasons. First, the international
economic development community has learned that
a one-size-fits-all approach simply does not work
(Easterly, 2001). Second, economic importance
attributed to “the entrepreneur” and concurrent
policy interest in his/her activities has exploded in
recent years. This combination suggests that public
policy needs to be informed by the dynamics of
entrepreneurship and economic development, as well
as relevant local institutional conditions and context-
specific variables. In fact, one of the main goals of the
GEM project is to measure differences in the level of
entrepreneurial activity among countries. The purpose
of this section is to outline the relationship between
entrepreneurship and economic development and to
sketch the beginnings of a Global Entrepreneurship
Index to measure and understand this relationship.
3.1 Linking Institutions,
Entrepreneurship, and
Development
For over a century, there has been a trend in economic
activity, exhibited in virtually every developed
industrialized country, away from small firms and
toward larger organizations. It was, therefore,
particularly striking when a series of studies identified
that this trend had not only ceased sometime during
the mid-1970s, but had actually begun to reverse
(Blau, 1987; Evans and Leighton, 1989). More recent
studies have confirmed this result for most developed
countries in the 1970 and 1980s (Acs, Audretsch, and
Evans, 1994). The empirical evidence clearly shows
that firm size distribution in developed countries
began to shift away from larger corporations and
toward entrepreneurial activity.
There are three reasons why entrepreneurial activity
rises in countries in the innovation-driven phase
of economic development: First, the innovation-
driven phase is marked by decreases in the share
of manufacturing in the economy. Virtually all
industrialized market economies experienced a
decline in manufacturing over the last thirty years.
The business service sector expanded relative to
manufacturing. Service firms are smaller on average
than manufacturing firms, therefore, economy-wide,
average firm size may decline. Moreover, service firms
provide more opportunities for entrepreneurship. This
is clearly the case in the United States, as well as in
several EU countries, including Germany and Sweden.
Second, technological change during the postwar
period has been biased toward industries in which
entrepreneurial activity is important (Jorgenson,
2001). Improvements in information technologies
such as telecommunications may increase returns to
entrepreneurship. Express mail services, photocopying
services, personal computers, the internet, web
services, and mobile phones services make it less
expensive and less time consuming for geographically
separate individuals to exchange information.
Third, some theorists suggest that the easier it is
to substitute capital for labor, the richer countries
become, and the easier it is to become an entrepreneur
(Aquilina, Klump, and Pietrobelli, 2006).
Thus in countries in the early phases of economic
development, the factor-driven and efficiency-driven
phases, entrepreneurial activity would be negatively
related to economic development since most people
would be trying to move from subsistence self-
employment to wage employment. In developed
3.0 Entrepreneurship, Institutions and Economic Development
37
economies, we would expect entrepreneurial activity
to be positively related to economic development
as people shift from wage work to entrepreneurial
activity. These economies have entered the innovation-
driven phase.
This framework seems to imply that the relationship
between entrepreneurial activity and economic
development in the global economy may be U-shaped.
Figure 8 shows that countries with very low levels
of per capita income like Angola, Peru, and Ecuador
all have high levels of early-stage entrepreneurial
activity. As per capita income increases,
entrepreneurial activity tends to decrease, but then
levels off. At the bottom of the U are countries that
appear to be transitioning from efficiency-driven
economies to innovation-driven economies, including
many Eastern European countries. Many innovation-
driven countries such as Germany, France, Belgium
and Italy have relatively low levels of entrepreneurial
activity, but the richest, such as the US, Norway, and
Iceland do tend to have higher levels.
Research on the relationship between
entrepreneurship and economic development
has greatly expanded in the past decade. For
example, in 2002, Carree and colleagues examined
the relationship between economic development
and business ownership for OECD countries and
reaffirmed the existence of a U-shaped relationship.
In 2005, Wennekers and colleagues were the first
to regress GEM data for nascent entrepreneurship
on the level of economic development. They also
found support for the U-shaped relationship among
countries at different stages of development.
However, this line of research is not without
limitations for the study of entrepreneurship and
development. For example, it considers the quantity
rather than the quality of entrepreneurship, and does
not take into account institutional differences between
countries in the same phase of economic development.
It is hard to use this U-shape relationship for
policy purposes, since it seems to suggest that less
entrepreneurship is better for developing countries,
while more is better for developed countries. In
this chapter, we consider a composite measure
of entrepreneurship that could be more useful in
understanding entrepreneurship in both developed
and developing countries. There are at least three
composite measures that have been used to measure
different aspects of economic development in the
global economy. These are briefly reviewed in the
following paragraphs.
The Ease of Doing Business Index (EDBI) was created
by the World Bank to measure the simplicity of
regulations for businesses and the level of protection
of property rights. It was designed to evaluate the
effect of improving regulations on economic growth
and to determine the optimal levels of business
regulation. Fewer and simpler regulations generate
higher rankings. The index is based on the study of
expert opinion on laws and regulations and ranks
nations based on the average of 10 sub-indices. The
Index of Economic Freedom (IEF), created by the Wall
Street Journal and The Heritage Foundation, uses
10 economic measures to evaluate degree of economic
freedom.
It is based on economic theories of liberty, with the
objective of creating basic institutions that protect
individual liberties in pursuit of economic interests for
greater economic prosperity.
Economic freedom is defined as “the absolute right
of property ownership, fully realized freedom of
movement for labor, capital, and goods, and an
absolute absence of coercion or constraint of economic
liberty beyond the extent necessary for citizens to
protect and maintain liberty itself." The IEF, therefore,
evaluates the economic environment or set of policies
for their conduciveness to economic freedom, with
absolute freedom the ideal target. The index uses
statistics from the World Bank, the IMF, and the
Economist Intelligence Unit to score countries.
The Global Competitiveness Index (GCI) is an annual
report by the World Economic Forum, covering about
131 countries. It "assesses the ability of countries to
provide high levels of prosperity to their citizens,”
which is dependent on how productively a country
uses available resources (allocative efficiency). The
GCI measures the set of institutions, policies, and
factors that determine short- and medium-term
sustainable levels of economic prosperity. The Index is
based on theoretical and empirical research and made
up of about 90 variables, two-thirds of which come
from the Executive Opinion Survey and one-third from
publicly available data sources such as the United
Nations. It classifies the variables into nine pillars,
each representing an area considered an important
determinant of competitiveness.
Together with GEM, these three projects represent
a sort of “development diamond” focusing on
freedom, competitiveness, cost of doing business, and
entrepreneurship. There are natural connections
between these facets of the development diamond.
For example, as Carl J. Schramm has argued, “In
the past two years…essays on entrepreneurship and
labor freedom have evinced a growing recognition
that developments on the micro level are centrally
important to economic freedom,” (Schramm, 2008,
p. 15). These facets are being measured with some
regularity but there is not a well-developed overall
measure of entrepreneurial adaptation. Much of the
material required to develop the components of such a
measure can be drawn from existing GEM data.
Entrepreneurship, Institutions and Economic Development
38
3.2 Recognizing the Complex
Relationship between
Entrepreneurship and Economic
Development Using GEM Data
In the 2004 Global Entrepreneurship Report,
GEM started to pursue the idea of using the
opportunity-necessity ratio as a composite indicator of
entrepreneurial activity and economic development.
Over the years, GEM researchers began to collect
data on both opportunity entrepreneurship
(starting a business to exploit a perceived business
opportunity) and necessity entrepreneurship
(starting a business because you were pushed into
it). However, both measures show higher levels in
developing countries than in developed countries.
A clearly discernible trend occurs between the ratio
of opportunity to necessity entrepreneurship and
the per capita income of a country. Opportunity to
necessity entrepreneurship ratio is a short-hand
approach to describe the importance of the desirable,
opportunity entrepreneurship relative to the
necessity- induced entrepreneurship. Countries where
more entrepreneurship is motivated more through
the recognition of an economic opportunity than by
necessity have higher levels of income. Complex
measures such as this point the way to a more
nuanced understanding of the relationship between
entrepreneurship and economic development.
Acs and Szerb (2008), Acs and Stenholm (2008),
Ahmad and Hoffmann (2008), and Klapper, Amit,
Guillén and Quesada (2007), among others, are
developing a new family of global entrepreneurship
indices. In this chapter, one such attempt is
summarized: the Global Entrepreneurship Index
(GEI) (Acs and Szerb, 2008). The GEI uses 32
variables (19 from GEM) to create 14 indicators
and three sub indices that measure entrepreneurial
activity, entrepreneurial aspiration and
entrepreneurial attitudes for all 64 countries that
have participated in the GEM project, including
developed and developing countries across the years
2003-2008. The index takes a value from 0 to 1 and is
plotted against income per capita based on purchasing
power parity in U.S. dollars.
Acs and Szerb propose a four level index building
logic: variables and weights, indicators, sub-indices,
and finally, the super-index. All three sub-indices
contain several indicators; they can be interpreted
as quasi-independent building blocks of this
entrepreneurship index. The three sub-indices of
attitudes, activity, and aspiration are combined to
produce an entrepreneurship super-index, the Global
Entrepreneurship Index. In this way, the design of
GEI is consistent with the revised GEM model.
Entrepreneurial attitudes are defined as the general
attitude of a country population toward recognizing
opportunities, knowing entrepreneurs personally,
attaching high status to entrepreneurs, accepting the
risk associated with business start-up, and possessing
the skills required to create successful start-ups.
Entrepreneurial attitudes are important because
they express the general feelings of the population
toward entrepreneurs and entrepreneurship.
Those people that can recognize valuable business
opportunities, who have the necessary skills to
exploit these opportunities, who attach high status to
entrepreneurs, can bear and handle start-up risk, and
know entrepreneurs personally can be considered as
the reserve army of future entrepreneurial activity.
Moreover, these people can provide the cultural
support, help, financial resources, and networking
potential to those who are already entrepreneurs or
want to start a business.
Entrepreneurial activity is defined as the new venture
start-up rate, adjusted for the churning effect of
business closures, initiated by educated entrepreneurs
and launched because of opportunity motivations. For
the calculation of start-up rate, Acs and Szerb use
the GEM TEA index that captures both independent
and “corporate” start-ups. The churning effect
measures the net change of businesses; it is based
on the assumption that a high rate of discontinued
businesses can be harmful. Quality differences in
start-ups are quantified by education, i.e., having
at least post-secondary education. Opportunity
motivation is assumed to be a sign of better planning,
sophisticated strategy, and higher-growth expectations
as compared to necessity motivation.
Entrepreneurial aspiration is defined as the effort
of the entrepreneur to engage in introducing new
products or new production processes, to open
foreign markets, to plan to increase the number of
employees substantially, and to be able to finance the
business with formal and/or informal venture capital.
Product and process innovation, internationalization
and, high growth are considered to be the heart of
entrepreneurship. The benchmark businesses are
those that sell product/services considered to be new
to at least some of the customers, use a technology
less than five years old, and have sales from foreign
markets. Also included in this sub-index is a finance
variable that serves to capture the informal and
formal venture capital potential vital for innovative
start-ups and high-growth firms.
The weakness of these sub-indices is that they capture
a limited number of aspects of attitudes, activity, and
aspiration. However, it is logical to expect that these
missing variables have a high correlation with the
chosen variables. Figure 22 shows that when these
sub-indices are combined into one super-index, the
picture of the relationship between entrepreneurship
Entrepreneurship, Institutions and Economic Development
39
and economic development turns out to be mildly
S-shaped rather than U-shaped. Measures such
as this can enable comparisons of developed and
developing countries in the same analysis (Acs and
Szerb, 2008).
The GEI is broadly consistent with the three-
phase model of factor-driven, efficiency-driven
and innovation-driven economic development
(Porter, et al., 2002). In the efficiency-driven stage,
entrepreneurial activity is mildly increasing or
relatively flat as necessity entrepreneurship is steadily
reduced and innovation comes from the outside, since
developing countries are far from the technological
frontier (Acemoglu, Aghion, and Filibotti, 2006). This
has been demonstrated in the case of Latin America
by Acs and Amoros (2008). The role of foreign direct
investment becomes critical in creating efficiency in
the efficiency-driven countries. In innovation-driven
countries, knowledge spills over to move a country to
the technological frontier, enabling a further intensity
of entrepreneurial activity (Baumol, et al., 2007).
Figure 23 shows the relationship between the GEI
Index, the Ease of Doing Business Index, the Index of
Economic Freedom and the Global Competitiveness
Index. The results in Figure 23 demonstrate that
entrepreneurship complements and rounds out
the other facets of the development diamond. In
other words, while we do not imply causation
entrepreneurship, ease of doing business, economic
freedom and competitiveness are all correlated. Table
3 provides a correlation matrix of the GEI along with
the other four major measures of institutions and
development. The correlation 0.79 between the GEI
and the Doing Business Index and 0.79 between the
GEI and the Index of Economic Freedom suggests
that the different facets of the “development diamond”
move together with economic development.
R
2
= 0.65
0
0.1
0.2
0.3
0.4
0.5
0.6
0.7
0.8
0 10,000 20,000 30,000 40,000 50,000 60,000
2007-2008 GDP PPP Average
GlobalEntrepreneurshipIndex
Figure 22 — The Global Entrepreneurship Index in Terms of GDP PPP
Source: Acs and Szerb, 2008
Entrepreneurship, Institutions and Economic Development
40
Figure 23 — Relationships between the Global Entrepreneurship Index and Economic Freedom Index,
Doing Business Index and Global Competitiveness Index
Entrepreneurship, Institutions and Economic Development
Note: All coefficients are significant at p< 0.001
Source: Acs and Szerb, 2008
Table 3 — The Correlation Coefficients between GE INDEX and Other Major Indices
1 2 3 4 5 6
1 Global Entrepreneurship Index 1 0.82 0.79 0.79 0.89 0.79
2 Global Competitiveness Index 1 0.82 0.76 0.88 0.83
3 Doing Business Rank (normalized) 1 0.84 0.82 0.74
4 Index of Economic Freedom 1 0.85 0.74
5 Corruption Perception Index 1 0.86
6 Per Capita GDP in PPP 2008 World Bank 1
R2
= 0.68
0
0.1
0.2
0.3
0.4
0.5
0.6
0.7
0.8
0 0.2 0.4 0.6 0.8 1
Doing Business Index 2008
GlobalEntrepreneurshipIndex
R2
= 0.64
0
0.1
0.2
0.3
0.4
0.5
0.6
0.7
0.8
40 60 80 100
Economic Freedom Index 2008
R2
= 0.69
0
0.1
0.2
0.3
0.4
0.5
0.6
0.7
0.8
3 3.5 4 4.5 5 5.5 6
Global Competitiveness Index 2008
To conclude, this section introduced a complex index
of entrepreneurship, the Global Entrepreneurship
Index that goes beyond the standard GEM measure of
early-stage entrepreneurial activity. The relationship
between the GEI and the wealth of nations is a mild
S shape rather than U-shape. The GEI supports
both the revised GEM model and the notion of a
“development diamond” composed of four main facets:
economic freedom, competitiveness, the cost of doing
business, and entrepreneurship. These four facets are
positively correlated and appear to move together as
an economy develops, but associate in subtly different
ways. These new insights could help policymakers
understand how different aspects of policy can affect
productive entrepreneurship through the major
phases of economic development.
41
From 10 years of GEM data on expert perceptions
of the environment for entrepreneurship, one theme
stands out. Consistently, GEM expert surveys in every
country demonstrate a general perception that the
provision of entrepreneurship education and training
at school is inadequate. In most countries, experts
also perceive that the provision of entrepreneurship
education and training after school is poor. Yet
several studies have demonstrated links between
provision of entrepreneurship education and levels
of entrepreneurial activity32
. This makes the topic of
entrepreneurship education and training worthy of
more detailed examination, and it was chosen by GEM
national teams as a special topic subject for 2008.
The GEM model identifies Entrepreneurship
Education and Training as an entrepreneurial
framework condition that affects levels of
entrepreneurial attitudes, aspirations and activity,
which then affect the level of new enterprises in
the economy. This chapter uses new data collected
in order to shed light on these relationships, while
recognizing how country-level contexts can change
how individuals calculate their allocation of effort into
productive entrepreneurship rather than into other
forms of economic activity.
In 2008, 38 GEM countries collected additional data
on entrepreneurship education and training through
their Adult Population Survey33
. Every respondent
was asked if they had had training in starting a
business during or after school, and whether this was
voluntary or compulsory. For after-school training,
the nature of the training provider was also obtained.
This provided national-level estimates of the quantity
of entrepreneurship education and training in each
nation, and of the relative importance of different
types of provider.
In addition, entrepreneurship experts in 31 countries
were asked, as usual, to rate the provision of
entrepreneurship education and training in their
country. This year they were also asked to rate
their country on two additional items: the extent to
which startup entrepreneurs in their country needed
help with their plans and the extent to which such
help was available outside the education system.
These ratings provided estimates of the quality of
entrepreneurship education and training. Data was
available for both quantity and quality of education/
training in 28 countries. Six of these were factor-
driven nations, 13 were efficiency-driven nations, and
nine were innovation-driven nations.
4.1 Participation in
Entrepreneurship Education
and Training
Table 4 shows the percentage of working age adults
who received training in starting a business in each
country, by country groups. Overall levels of trained
individuals varied greatly by country within country
groups. For example, among factor-driven countries,
the proportion of individuals who had received any
training in starting a business, either in school or
after school, varied from 40% in Colombia to 8% in
Egypt. In efficiency-driven countries, it varied from
43% in Chile to 6% in Turkey. In innovation-driven
countries, it varied from 48% in Finland to 13% in
Israel. This range of training quantity across countries
with similar levels of economic development is
remarkable.
In most countries, the proportion of individuals ever
having had training in starting a business decreased
with age. However, there was no significant decrease
with age in Jamaica, Greece, Iceland and Israel, while
in Japan there was a significant increase in training
levels with age34
. In India, the Dominican Republic
and Germany, training levels were highest among
adults aged 25-34. Among 18-24 year olds, diffusion of
training ranged from over 60% in Chile and Finland
to under 10% in the Dominican Republic and Turkey.
This gap was much smaller in older age groups.
Among 55-64 year olds, the gap varied from 33% in
Finland to 4% in Egypt.
Women were significantly more likely to have received
training in starting a business than men in only
one country: Latvia. In all factor-driven countries,
men were significantly more likely to have received
training in starting a business than women. In
only nine, or just over half of the efficiency-driven
countries, men were significantly more likely to
have received such training. However, 11 or 73% of
innovation-driven countries had significantly higher
levels of training among men than women. These
differences by country groups may reflect differences
in attendance rates at school and workforce
participation rates among males and females at
different levels of economic development, as well as
differences in entrepreneurial attitudes, aspirations
and activity rates.
Table 5 shows the percentage of individuals who
participated in training in starting a business after
primary or secondary school, by type of training
provider and whether the training was voluntary or
compulsory. It shows that the most frequent source of
training was self-directed learning, such as reading
or observing or working in other people’s businesses,
followed by voluntary formal education and by
4.0 Special Topic 2008: Entrepreneurship Education and Training
42
Special Topic 2008: Entrepeneurship Education and Training
voluntary training provided by a college or university
but outside the formal education system. Other
sources, such as business or trade organizations,
government agencies, or employers, typically were
used by 3% or less of individuals, although Colombia,
Chile, Peru, and Finland stood out as having higher
than usual usage of all sources. Exceptions to these
general trends include Iran, where government
agencies were the most frequent source of training
after self-directed learning, Germany, where chambers
of commerce was the most frequent source of training
after self-directed learning, and Belgium, where
compulsory training was more frequently reported
than voluntary training for most types of training
provider.
Compulsory training was rarely reported by more
than 1% of individuals. However, at least 5% of
individuals in Chile, Latvia, Finland, and Slovenia
reported participating in compulsory training in
starting a business as part of their formal post-school
education.
A striking feature of the patterns in Table 5 is the
contrast in training take-up between close neighbors.
For example, Brazil has one of the lowest rates of
training across all providers, while Chile has one of
the highest. Slovenia and Croatia have relatively
high rates while Hungary, Romania, and Serbia have
relatively low rates.
Those who had participated in training in starting
a business after school were also asked if they had
taken online training. Figure 24 shows the frequency
of use of this form of training by country and country
type. Chile stands out as having a very high rate of
online training usage, with a fifth of the population
of working age adults noting they have taken this
form of training. This is probably due to integration
of online training into online registration systems in
Chile.
43
Special Topic 2008: Entrepeneurship Education and Training
Table 4 — Percentage of the Population Aged 18-64 that Received Voluntary or Compulsory Training in Starting
a Business During or After School, by Type of Country
School
voluntaryi
School
compulsory
School
any
After
school
voluntaryi
After school
compulsory
After
school
any
Any
training
Factor-Driven Economies
Bolivia 8.2 2.4 10.6 10.3 3.9 14.2 19.1
Bosnia and Herzegovina 12.7 0.8 13.5 8.1 2.5 10.6 19.9
Colombia 19.2 4.0 23.2 20.7 8.7 29.4 40.0
Ecuador 16.1 4.3 20.4 8.3 7.3 15.6 27.2
Egypt 3.8 0.9 4.7 2.1 2.1 4.2 7.5
India 3.3 1.7 5.0 3.8 7.0 10.8 13.1
Iran 8.9 6.6 15.4 9.2 10.3 19.5 28.9
Country average 10.3 3.0 13.3 8.8 6.2 14.9 22.2
Efficiency-Driven Economies 
Argentina 6.4 3.2 9.6 7.3 3.6 10.9 17.4
Brazil 4.5 0.8 5.3 1.6 5.0 6.6 9.4
Chile 16.8 8.5 25.3 18.9 13.8 32.7 42.5
Croatia 8.6 11.1 19.7 8.0 7.6 15.6 27.6
Dominican Republic 4.7 0.6 5.3 1.9 2.1 4.0 7.7
Hungary 2.8 14.2 17.1 1.4 8.6 10.0 24.4
Jamaica 6.8 9.2 16.0 2.9 6.4 9.3 21.0
Latvia 6.1 8.4 14.5 9.0 10.1 19.1 28.0
Macedonia 10.3 2.3 12.6 7.2 3.7 10.9 19.1
Mexico 5.8 3.6 9.5 3.6 5.9 9.5 15.5
Peru 11.5 2.9 14.4 12.2 12.5 24.7 29.6
Romania 3.3 2.2 5.5 2.8 1.8 4.6 8.0
Serbia 1.5 1.5 3.0 2.6 4.9 7.6 10.2
South Africa 6.6 2.7 9.3 3.8 5.2 9.0 13.8
Turkey 1.9 0.6 2.5 1.9 2.3 4.2 6.3
Uruguay 9.7 1.0 10.7 9.5 8.9 18.4 24.1
Country average 6.7 4.6 11.3 5.6 6.3 12.3 19.0
Innovation-Driven Economies
Belgium 17.8 7.0 25.0 3.0 15.2 18.2 33.3
Denmark 2.4 7.1 9.5 2.1 11.9 14.0 22.0
Finland 10.1 7.8 17.9 19.6 20.8 40.4 47.9
France 5.3 4.9 10.2 5.9 6.6 12.5 18.1
Germany 10.3 2.0 12.3 8.4 4.7 13.2 21.0
Greece 5.0 1.2 6.1 6.4 6.5 12.9 17.0
Iceland 6.5 5.3 11.8 11.3 6.5 17.8 26.7
Ireland 8.1 5.8 14.0 9.9 7.6 17.5 26.1
Israel 4.1 1.7 5.8 4.5 4.1 8.6 12.8
Italy 6.0 4.2 10.2 5.3 3.7 9.1 16.5
Japan 2.8 2.1 4.9 10.1 5.6 15.7 17.4
Republic of Korea 2.7 3.2 5.9 3.8 5.4 9.2 13.6
Slovenia 13.0 11.3 24.3 10.3 12.3 22.6 35.7
Spain 9.5 3.0 12.5 7.9 6.8 14.7 21.9
United Kingdom 5.8 3.1 8.9 7.7 6.1 13.8 19.5
Country average 7.3 4.6 11.9 7.7 8.3 16.0 23.3
i: “Voluntary” includes those reporting voluntary training or a mix of voluntary and compulsory training.
44
Type of training provider
College,
formal
College,
informal
Chamber of
of commerce
gov. agency Employer Other
Self
directed
learning
Voluntary or compulsory training V C V C V C V C V C V C
Factor- Driven Economies
Bolivia 9 1 5 1 3 0 2 0 3 0 4 0 11
Bosnia and Herzegovina 6 0 3 0 2 0 1 0 4 0 2 0 9
Colombia 20 2 10 1 6 0 5 0 4 1 7 0 24
Ecuador 10 2 4 1 4 0 2 0 3 1 3 0 10
Egypt 2 0 1 0 1 0 1 0 1 0 0 0 2
India 3 2 2 1 2 1 2 1 1 1 3 1 5
Iran 6 2 3 2 2 0 8 2 3 1 2 0 10
Country average 8 1 4 1 3 0 3 1 3 1 3 0 10
Efficiency-Driven Economies 
Argentina 5 1 5 0 5 0 2 0 3 1 2 0 9
Brazil 1 1 1 0 4 0 1 0 1 1 0 0 2
Chile 13 5 10 1 8 1 10 1 9 3 15 0 26
Croatia 6 4 4 1 3 1 1 0 3 1 2 0 12
Dominican Republic 2 0 1 0 1 0 1 0 1 0 0 0 2
Hungary 3 1 2 0 1 0 1 0 1 0 0 0 1
Jamaica 4 3 2 1 1 0 2 1 1 1 0 0 4
Latvia 9 5 4 1 2 0 3 0 3 1 1 0 13
Macedonia 5 1 3 0 3 0 2 0 3 1 2 0 8
Mexico 2 0 1 0 2 0 1 0 2 0 0 0 4
Peru 13 2 11 1 6 0 5 1 6 2 6 1 16
Romania 2 0 1 0 1 0 0 0 1 0 1 0 3
Serbia 1 0 1 0 1 0 2 0 1 0 0 0 3
South Africa 4 2 3 1 2 1 2 1 2 1 2 1 6
Turkey 1 0 1 0 0 0 0 0 1 0 1 0 3
Uruguay 9 2 9 1 8 1 3 0 5 2 4 0 13
Country average 5 2 4 1 3 0 2 0 3 1 2 0 8
Innovation-Driven Economies
Belgium 7 3 2 3 1 2 1 3 1 1 1 2 8
Denmark 3 4 1 1 2 1 0 1 0 0 2 1 8
Finland 16 14 9 1 5 0 6 1 3 1 6 1 30
France 4 2 1 1 5 1 4 1 1 0 4 0 8
Germany 6 1 2 0 7 1 3 1 4 1 3 0 10
Greece 8 1 1 0 4 0 2 0 2 1 1 0 8
Iceland 7 3 4 1 2 0 2 0 4 1 4 0 14
Ireland 6 3 6 1 4 0 6 1 3 2 1 0 14
Israel 4 1 3 1 3 0 3 0 2 0 1 0 6
Italy 6 1 2 0 3 0 1 0 2 1 1 0 6
Japan 6 2 7 1 2 0 2 0 3 1 2 0 12
Republic of Korea 4 1 3 1 2 0 1 0 1 0 1 0 4
Slovenia 9 6 8 1 5 1 4 1 4 2 3 0 15
Spain 9 1 7 1 6 0 5 1 4 1 7 0 10
United Kingdom 6 2 4 1 3 1 3 0 2 1 1 0 10
Country average 7 3 4 1 4 1 3 1 2 1 2 0 11
Table 5 — Percentage of the Population Aged 18-64 that Received Any Training in Starting a Business
After School, by Type of Training Provideri
Special Topic 2008: Entrepeneurship Education and Training
45
4.2 Expert Opinions on Quality
of Entrepreneurship Training
We now turn to a different source of evidence on the
state of entrepreneurship education and training
in GEM nations. The GEM national expert survey
contains several measures of quality of training
provision, and these are shown in Table 6. It should
be borne in mind that measures of quality refer to
perceptions of current quality, whereas the quantity
measures displayed in the previous tables refer to
training activities in the past—up to 50 years ago in
the case of older adults. For this reason, there may be
no relationship between current quality of provision
and current outcomes.
Table 6 shows average ratings on a 1 to 5 scale by
entrepreneurship experts in each country on the need
for, availability of, and quality of entrepreneurship
education and training by country and country
group35
. Within each country group, average
scores varied little from country to country. The
average scores by country type suggest that start-
up entrepreneurs’ need for external help reduces
slightly as countries develop economically, and the
availability of that help increases. The perceived level
of help is insufficient in factor-driven countries and
generally sufficient in innovation-driven countries.
The perceived quality of school-level entrepreneurship
education and training increases with economic
development, but perceived quality of post-school
entrepreneurship education does not, and is seen as
inadequate in almost all innovation-driven countries.
This suggests that experts in most innovation-driven
countries see plenty of help available, but question its
quality.
Among the six factor-driven countries, there was
a high correlation in average ratings by experts of
the quality of school and after-school education and
training in the country (r = .833, p = .039). There
was also a high correlation between the perceived
quality of school-based and after school-based
entrepreneurship education in the country as rated by
country experts and the proportion of individuals who
had voluntarily taken after-school training in starting
a business (r = .825, p = .043; r = .966, p = .002). There
was a high correlation between the proportion of
individuals who had taken compulsory school-based
training and the proportion of individuals who had
taken compulsory after-school-based training (r = .967,
p = .002).
Among males, the quality of post-school
entrepreneurship education and training correlated
significantly with levels of necessity-driven TEA
(r = .880, p = .021) across countries with factor-
driven economies. For females in these countries, it
correlated significantly with opportunity perception
(r = .875, p = .023) and start-up expectation over the
next three years (r = .845, p = .034), and with two
measures of high-growth expectation36
(r = .881, p =
.02; r = .818, p = .047). Levels of voluntary after-school
training for males and females produced similar
high and significant correlations. National levels of
opportunity perception among females correlated
highly with overall TEA rates (r = .847, p = .033),
necessity entrepreneurship (r = .963, p = .002), and
entrepreneurship aimed at developing and expanding
new markets (r = .879, p = .021).
0%
5%
10%
15%
20%
25%
Egypt
India
Iran
BosniaandHerz.
Ecuador
Bolivia
Colombia
Countryaverage
Jamaica
Hungary
DominicanRep.
Brazil
Romania
Turkey
SouthAfrica
Serbia
Mexico
Macedonia
Argentina
Croatia
Uruguay
Peru
Latvia
Chile
Countryaverage
Germany
Israel
Rep.ofKorea
Belgium
UnitedKingdom
Denmark
Ireland
Greece
Italy
France
Japan
Finland
Spain
Iceland
Slovenia
Countryaverage
Factor-Driven Economies Efficiency-Driven economies Innovation-Driven Economies
PercentageofAdultsbetween18-64Years
Figure 24 — Percentage of Adults Aged 18-64 Who Have Used Online Training in Starting a Business
Special Topic 2008: Entrepeneurship Education and Training
46
Special Topic 2008: Entrepeneurship Education and Training
Entrepreneurs in
general need help
with their plans
before startup
Enough help
available outside
education system
Quality of
entrepreneurship
education and training
at school
Quality of
entrepreneurship
education and training
after school
Factor-Driven Economies
Bolivia 3.9 2.3 1.7 2.6
Bosnia and Herzegovina 4.1 2.7 1.9 2.4
Colombia 4.3 2.6 2.0 3.2
Ecuador 3.8 2.3 1.6 2.6
Egypt 4.3 2.1 1.3 1.8
Iran 4.5 3.2 1.7 2.4
Country averages 4.2 2.5 1.7 2.5
Efficiency-Driven Economies
Argentina 4.2 2.8 2.1 3.4
Brazil 4.2 2.9 1.6 2.8
Chile 4.1 2.6 1.6 2.9
Croatia 4.2 3.1 2.2 2.8
Dominican Republic 4.2 2.3 1.7 3.2
Jamaica 3.8 2.7 2.0 2.8
Macedonia 4.3 3.1 2.2 2.8
Mexico 4.4 2.9 1.7 3.0
Peru 3.9 2.5 1.9 2.9
Russia n.a. n.a. 2.5 3.1
Serbia 3.9 3.1 2.0 2.9
South Africa 4.1 2.4 1.9 2.5
Turkey 4.1 2.6 1.9 2.7
Uruguay 3.9 3.2 2.1 2.9
Country average 4.2 2.8 2.1 3.4
Innovation-Driven Economies
Denmark 4.3 3.1 2.4 2.4
Finland 4.0 3.7 2.5 2.8
Germany 3.6 3.9 1.9 2.7
Greece 3.7 2.4 1.8 2.5
Ireland 4.1 3.6 2.5 3.0
Italy 4.0 2.8 1.8 2.8
South Korea 3.9 3.6 2.4 2.9
Norway 4.3 2.9 2.6 2.9
Slovenia 3.8 3.5 2.4 3.0
Spain 4.3 3.3 1.9 2.9
United States 3.9 3.3 2.1 2.9
Country averages 4.0 3.3 2.2 2.8
Table 6 — Perceived Need for and Availability and Quality of Entrepreneurship Education and Training,
by Country and Country Group (Average Ratings by Experts from 1 to 5)
47
Special Topic 2008: Entrepeneurship Education and Training
These patterns make sense; for factor-driven
economies, where necessity entrepreneurship is an
important source of economic self-sufficiency in the
absence of other job opportunities, the quality and
quantity of training available might be expected to
increase the rate of entrepreneurship and the extent
to which individuals can create new and growing
markets where none previously existed. Perhaps
after-school education has a more indirect effect, via
increased opportunity perception, on females than
on males in factor-driven countries. Multi-level,
multivariate analysis would be required to analyze
this in greater detail.
Among the 13 efficiency-driven countries, there
were no significant correlations between average
expert assessments of the state of school-based
entrepreneurship education and training in their
country and country-level rates of entrepreneurial
attitudes, aspirations or activity. Expert perceptions
of post-school-based entrepreneurship education and
training correlated mildly with overall entrepreneurial
activity levels for both males and females (r = .606,
p = .028; r = .555, p = .049), and with opportunity
entrepreneurship for males (r = .563, p = .045) and
necessity entrepreneurship for females (r = .703, p =
.007). It also correlated with two measures of growth
expectation among females (r = .680, p = .011; r =
.730, p = .005). For both males and females, levels of
after-school training in starting a business (whether
voluntary or compulsory) correlated highly with
voluntary training at school level (males: r = .920, p
= .000; r = .813, p = .001; females: r = .893, r = .000;
r = .822, p = .001) but not with compulsory training
at school level, with the exception of females and
after-school compulsory training (r = .677, p = .011).
Voluntary school level training levels also correlated
significantly with levels of entrepreneurship with
profound market expansion intentions among males
and females, (r = .774, p = .002; r= .713, p = .006),
and correlated mildly with growth expectation
entrepreneurship among females (r = .554, p = .049).
Among the innovation-driven countries, there
were significant correlations between the
perceptions of experts on the quality of school-based
entrepreneurship education and training and both
opportunity perception rates (r = .727, p = .026)
and fear of failure rates (r = -.880, p = .009). These
correlations were similar for both males and females.
Countries with more favorable expert perceptions of
school-based entrepreneurship education and training
also tended to have higher growth expectations among
their startup entrepreneurs for the first of the two
growth measures employed in this analysis (r = .803,
p = .009). There was a high correlation between the
proportion of individuals who took any school-based
training in starting a business and those who took
voluntary training after school (r = .824, p = .006).
There was a high level of correlation between the
proportion of individuals who took voluntary and
compulsory training after school (r=.729, p=.026).
There was also a significant correlation between the
proportion of individuals who took any school-based
and any after school-based training (r = .775, p = .014).
In general, neither high levels of training nor high
levels of positive entrepreneurial attitudes were
significantly correlated with entrepreneurial activity
rates across countries in this group. Exceptions
included a significant correlation between male
necessity TEA rates and skills perception rates (r =
.885, p = .001), and a significant negative correlation
between compulsory school-based training rates
for females and female necessity entrepreneurship
rates (r = -.711, p = .032). High rates of school-
based training among females were associated with
lower rates of future startup intention (r = -.785, p
= 0.012). High rates of voluntary school and after-
school training were associated with lower rates
of entrepreneurial activity involving profound
market expansion (r = -.709, p = .032; r = -.683, p
= .042). These negative correlations may reflect
the efforts of some governments in innovation-led
countries with low entrepreneurship rates to provide
entrepreneurship education as part of the school
curriculum, in an effort to boost entrepreneurial
activity.
In summary, the quality and level of entrepreneurship
education and training may have different impacts
on attitudes, aspirations, and activity in countries
at different stages of economic development. In
factor-driven economies, the higher the quality
and quantity of after-school training, the higher
the levels of necessity entrepreneurship; this effect
may be indirect in the case of females. This is
because factor-driven economies provide few other
opportunities for employment. In efficiency-driven
economies, the more post-school training in starting
a business, the higher the levels of market-expansion
entrepreneurship, reflecting the growth of these
economies. In innovation-driven economies, several
negative correlations are apparent, possibly because
governments with low levels of entrepreneurial
activity have been investing more in entrepreneurship
education and training in an effort to increase
entrepreneurial activity.
48
Special Topic 2008: Entrepeneurship Education and Training
4.3 Entrepreneurship Training
and Entrepreneurial Attitudes,
Aspirations, and Activity at the
Individual Level
In this final section, we consider the attitudes,
aspirations, and activities of those who have and have
not had training in starting a business. Table 7 shows
the proportions of working age individuals who are not
running or actively trying to start a business who 1)
perceive good opportunities for starting a business in
their local area and 2) perceive they have the skills,
knowledge, and experience to start a business, by
type of training received. By removing those who are
currently nascent, new or established entrepreneurs,
we remove the possibility of biased response. The
patterns are different for each attitude, with a more
mixed picture on opportunity perception than on
skills perception. Each country seems to have its own
unique pattern of relationships between training
and attitudes, and the country group averages can
be misleading. For example, in India and Greece,
only compulsory training had a positive effect on
opportunity perception, but it had a negative effect
in Colombia. Only voluntary training had a positive
effect in Romania and Finland. Both voluntary and
compulsory training had similar and positive effects in
Argentina, Hungary, Peru, Turkey, Germany, Japan,
Spain, and Slovenia.
In every country except Jamaica and the Dominican
Republic, those who had taken either voluntary
or compulsory training were more likely to have
positive self-perceptions than those who had not
taken training. In five of the nine innovation-driven
countries (Italy and Spain excepted), those who had
taken voluntary training were most likely to perceive
they had the skills to start a business. In Italy and
Spain, voluntary and compulsory training appeared
to deliver similar and positive effects, but in Belgium
and Israel, those with compulsory training were more
likely to have positive skills self-perception. In most
factor-driven and efficiency-driven countries, both
voluntary and compulsory training produced similar
elevated levels of skills perception. Overall, levels
of skills perception were higher in factor-driven and
efficiency-driven countries than in innovation-driven
countries.
Table 8 shows the proportion of individuals aged
18-64 who expected to start a business in the next
three years and the proportion who were currently
actively trying to start a business or were running a
new business. In most countries, individuals who had
taken either voluntary or compulsory training were
significantly more likely to expect to start a business
in the next three years, and generally those with
voluntary training had the highest levels. In Bosnia,
India, Iran, Hungary, Mexico, Romania, Turkey,
France, and the United Kingdom, both voluntary and
compulsory training produced similar elevated levels
of start-up aspiration. In Chile and Japan, those with
compulsory training were no more likely to expect to
start a business in the next three years than those
who had taken no training at all, while in Belgium,
those who had taken compulsory training had the
highest start-up aspirations. Neither voluntary nor
compulsory training appeared to make any difference
to aspiration in Jamaica or Greece.
The relationship between type of training and early-
stage entrepreneurial activity rates tended to track
the relationship with aspiration, but at a much lower
level. In some countries, including Bolivia, Iran,
and Argentina, compulsory training had no effect
on activity, although it did have a significant effect
on aspiration. However, in Brazil, Turkey, Uruguay,
Iceland, and Italy, compulsory training appeared
to have a stronger effect and voluntary training
appeared to have a weaker effect on activity than
would have been predicted on the basis of aspiration.
In conclusion, the relationship between training in
starting a business and entrepreneurial attitudes,
aspirations, and activity is generally positive, but
complex. Some differences are apparent between
country groups, in line with theory and the GEM
model. However, each country seems to have a unique
training footprint, which is a function of current and
past quality and quantity of training, of demand, of
regulations, and of employment choice. The “yield”
from training, or the ratio of activity among the
trained to that among the non-trained, varies from
country to country, but on average the yield from
compulsory training is slightly more than half that of
voluntary training. Some countries, such as France
and Latvia, appear to have yields from voluntary
training as high as 5, while others have very low
yields.
Further analysis of this topic will be provided by a
special report on entrepreneurship entrepreneurship
education and training to be published later in 2009.
49
Special Topic 2008: Entrepeneurship Education and Training
Perceive good opportunities in the local area in the
next six months
Have skills, knowledge, experience to start a business
Voluntary
trainingi
Compulsory
training
No training
Voluntary
trainingi
Compulsory
training
No training
Factor-Driven Economies
Bolivia 52.5 47.6 46.0 81.5 63.2 64.5
Bosnia and Herzegovina 57.1 50.0 39.1 81.8 87.5 56.9
Colombia 64.7 42.1 52.6 73.4 53.8 45.3
Ecuador 38.3 47.2 35.4 81.9 77.2 60.7
Egypt 31.7 44.4 30.1 70.2 75.0 51.1
India 47.8 81.8 52.8 64.0 86.7 42.3
Iran 34.0 32.6 29.1 76.1 73.1 51.9
Country average 46.6 49.4 40.7 75.6 73.8 53.2
Efficiency-Driven Economies
Argentina 56.6 50.0 39.0 80.8 62.5 48.4
Brazil 50.0 37.0 37.9 76.5 75.0 46.5
Chile 30.8 26.4 21.0 78.1 68.5 41.7
Croatia 61.3 52.1 35.6 77.4 75.2 48.1
Dominican Republic 56.5 53.8 51.2 85.2 78.6 69.0
Hungary 22.2 25.7 14.0 67.7 65.5 36.4
Jamaica 55.1 47.5 48.3 67.0 64.5 64.6
Latvia 41.9 28.6 16.0 70.9 46.8 13.3
Macedonia 50.6 46.2 43.1 74.1 71.4 47.8
Mexico 49.4 54.4 43.0 76.1 59.5 53.4
Peru 63.5 66.7 47.5 78.4 79.1 61.5
Romania 51.5 27.8 23.8 70.7 44.4 19.1
Serbia 73.7 56.4 50.9 84.2 85.7 57.2
South Africa 57.7 50.0 31.3 81.0 60.0 25.9
Turkey 53.8 50.0 33.4 71.9 76.2 42.8
Uruguay 45.2 61.0 48.7 78.5 75.0 53.2
Country average 51.2 45.9 36.5 76.2 68.0 45.6
Innovation-Driven Economies
Belgium 12.2 18.9 12.0 41.6 66.4 25.0
Denmark 57.1 65.9 60.8 50.8 45.3 25.9
Finland 56.5 48.0 45.6 57.1 36.7 16.2
France 35.7 25.0 20.5 75.8 39.0 20.3
Germany 36.2 38.0 17.7 59.9 37.5 24.8
Greece 21.5 43.6 23.9 58.8 50.0 44.0
Iceland 38.7 37.2 32.3 76.5 61.4 36.5
Ireland 29.6 28.9 24.4 66.7 56.6 34.7
Israel 41.5 52.0 21.7 55.9 73.3 31.0
Italy 33.0 35.8 28.1 53.3 53.6 32.3
Japan 13.0 16.3 6.2 34.5 19.1 6.3
Republic of Korea 36.8 19.2 10.8 39.5 20.0 21.8
Slovenia 53.9 52.9 36.5 73.6 53.8 34.0
Spain 29.7 27.5 23.4 53.2 51.4 40.2
United Kingdom 39.8 31.1 26.2 74.2 59.6 40.0
Country average 35.7 36.0 26.0 58.1 48.2 28.9
i: “Voluntary” includes those reporting voluntary training or a mix of voluntary and compulsory training.
Figures in bold denote statistically significant differences in proportions of attitude by type of training, p<.05.
Table 7 — Percentage of the Population Aged 18-64 Who Are Not Running or Trying to Start a Business and
Their Perceptions of Entrepreneurship, by Type of Business Start-Up Training Received and by Type of Country
50
Expect to start a business in the next three years Actively trying to start or running a new business (TEA)
Voluntary
trainingi
Compulsory
training
No training
Voluntary
trainingi
Compulsory
training
No training
Bolivia 65.7 50.7 38.0 39.1 25.0 28.3
Bosnia and Herzegovina 55.6 61.3 25.9 12.8 23.5 7.8
Colombia 81.2 72.5 58.4 34.6 26.2 19.0
Ecuador 60.2 52.3 36.6 25.7 23.0 14.3
Egypt 73.5 60.5 38.1 25.5 22.0 12.2
India 50.0 48.3 30.3 34.2 21.1 9.1
Iran 50.8 46.0 32.9 18.1 7.3 7.5
Country average 62.4 55.9 37.2 27.1 21.2 14.0
Argentina 43.2 30.3 19.7 26.1 12.1 15.5
Brazil 52.7 30.6 23.0 19.5 21.9 11.1
Chile 54.7 32.1 31.1 18.4 14.2 10.4
Croatia 22.4 15.3 9.5 16.7 10.7 5.3
Dominican Republic 71.6 58.5 34.6 41.1 34.1 18.7
Hungary 13.5 13.5 4.4 10.8 10.9 5.2
Jamaica 20.0 25.6 20.6 16.8 14.2 15.5
Latvia 33.9 17.8 4.3 20.1 8.7 3.5
Macedonia 68.3 61.1 40.8 22.9 19.0 12.7
Mexico 43.5 40.9 28.1 22.2 19.0 12.0
Peru 58.5 50.8 34.0 38.1 30.1 21.6
Romania 41.1 36.8 9.2 25.9 12.2 2.5
Serbia 67.1 42.2 31.6 17.6 13.6 6.7
South Africa 43.5 29.5 13.3 22.6 17.8 5.6
Turkey 41.5 42.2 22.6 10.5 21.2 5.3
Uruguay 41.2 27.7 18.7 16.7 19.8 10.0
Country average 44.8 34.7 21.6 21.6 17.5 10.1
Belgium 10.4 15.6 5.4 4.3 5.6 1.9
Denmark 17.1 10.4 6.2 7.1 5.0 4.1
Finland 15.5 8.9 3.7 14.1 6.4 4.4
France 31.9 30.4 11.7 20.3 12.0 3.3
Germany 17.8 10.3 3.6 8.0 8.0 2.6
Greece 18.2 19.5 16.1 10.0 16.7 9.2
Iceland 34.5 20.9 12.8 16.8 16.4 7.4
Ireland 23.2 14.5 6.5 16.4 9.1 5.5
Israel 42.6 34.1 15.1 16.9 13.1 5.1
Italy 22.8 12.6 7.4 10.6 8.6 3.6
Japan 24.9 6.4 5.8 15.6 7.8 3.9
Republic of Korea 44.8 25.5 20.6 14.3 11.3 9.5
Slovenia 24.2 12.2 5.6 13.5 7.0 4.2
Spain 12.3 8.7 6.7 9.8 7.3 6.5
United Kingdom 15.8 12.6 5.2 14.7 9.1 4.3
Country average 23.7 16.2 8.8 12.8 9.6 5.0
i: “Voluntary” includes those reporting voluntary training or a mix of voluntary and compulsory training.
Figures in bold denote statistically significant differences in proportions of aspiration or activity by type of
training, p<.05
Table 8 — Percentage of the Population Aged 18-64 Expecting to Start a Business in the Next Three Years or
Engaged in Early-Stage Entrepreneurial Activity by Type of Training Received and by Type of Country
Special Topic 2008: Entrepeneurship Education and Training
51
References
Acemoglu, D., P. Aghion and F.Zilibotti (2007).
“Distance to Frontier, Selection and Economic
Growth,” Journal of the European Economic
Association, 4, 37-74.
Acs, Z. J. (2006). “How is Entrepreneurship Good for
Economic Growth?” Innovations 1(1), 97-107.
Acs, Z. J., P. Arenius, M. Hay and M. Minniti (2005).
Global Entrepreneurship Monitor 2004 Executive
Report. London, U.K.: London Business School and
Babson Park, MA: Babson College.
Acs, Z. J., D. B.Audretsch, P. Braunerhjelm and B.
Carlsson (2003). “The Missing Link: The Knowledge
Filter and Endogenous Growth,” Center for Business
and Policy Studies. Stockholm, Sweden.
Acs, Z. J., D. B. Audretsch and D. Evans (1994).
“Why Does the Self-Employment Rate Vary across
Countries and over Time?” CEPR Discussion Paper
No. 871. Center for Economic Policy Research.
Acs, Z. J. and J. E. Amorós (2008). “Entrepreneurship
and Competitiveness Dynamics in Latin America.”
Small Business Economics, 31(3), 305-322.
Acs, Z. J. and C. Armington (2006). Entrepreneurship,
Geography and American Economic Growth.
Cambridge: Cambridge University Press.
Acs, Z. J. and P. Stenholm (2008). “A Global
Entrepreneurship Index Using GEM Data.” Mimeo,
School of Public Policy, George Mason University.
Acs, Z. J. and L. Szerb (2008). “Gearing Up to
Measure Entrepreneurship in a Global Economy,”
Mimeo, Faculty of Business and Economics,
University of Pecs.
Acs, Z. J., N. S. Bosma and R. Sternberg (2008). “The
Entrepreneurial Advantage of World Cities,” EIM
Scales Paper H200810, Zoetermeer: EIM.
Acs, Z. J., W. Parsons and S. Tracy (2008). “High
Impact Firms: Gazelles Revisited.” Office of Advocacy,
U.S. Small Business Administration.
Adelman, I. and C. T. Morris (1965). “Factor Analysis
of the Interrelationships between Social and Political
Variables and Per Capita GNP,” Quarterly Journal of
Economics 79, 555-78.
Ahmad, N. and A. N. Hoffmann (2008). “A
Framework for Addressing and Measuring
Entrepreneurship,” OECD Statistics Working Paper,
2. Retrieved May 9, 2008, from: http://ssrn.com/
abstract=1090374.
Aquilina, M., R. Klump and C. Pietrobelli (2006).
“Factor Substitution, Average Firm Size and
Economic Growth,” Small Business Economics, 26(3),
203-214.
Audretsch, D. B. (2007). “Entrepreneurship Capital
and Economic Growth,” Oxford Review of Economic
Policy, 23(1), 63-78.
Audretsch, D. B. (2007). The Entrepreneurial Society.
Oxford: Oxford University Press.
Autio, E. (2007). Global Entrepreneurship
Monitor 2007 Global Report on High Growth
Entrepreneurship. London, U.K.: London Business
School and Babson Park, MA: Babson College.
Baumol, W. J. (2002). The Free-market Innovation
Machine: Analyzing the Growth Miracle of
Capitalism. Princeton: Princeton University Press.
Baumol, W. J., R. E. Litan and C. J. Schramm (2007).
Good Capitalism, Bad Capitalism, and the Economics
of Growth and Prosperity. New Haven and London:
Yale University Press.
Béchard, J.-P. and D. Grégoire (2005).
“Entrepreneurship Education Research Revisited:
The Case of Higher Education,” Academy of
Management Learning and Education, 4(1), 22-49.
Bergmann, H. and R. Sternberg (2007). “The
Changing Face of Entrepreneurship in Germany,”
Small Business Economics, 28 (2), 205-221.
Blau, D. (1987). “A Time-Series Analysis of Self-
Employment in the United States,” Journal of
Political Economy, 95 (3), 445-67.
Bosma, N. S. and V. A. J. M. Schutjens (2007).
“Outlook on Europe: Patterns of Promising
Entrepreneurial Activity in European Regions,”
Tijdschrift voor Economische en Sociale Geografie, 98
(5), 675-686.
Bosma, N. S. and V. A. J. M. Schutjens (2009).
“Mapping Entrepreneurial Activity and
Entrepreneurial Attitudes in European Regions,”
International Journal of Entrepreneurship and Small
Business 7 (2), forthcoming.
Bosma, N. S., K. Jones, E. Autio and J. Levie (2008).
Global Entrepreneurship Monitor 2007 Executive
Report. London, U.K.: London Business School and
Babson Park, MA: Babson College.
Bygrave, W. D. with M. Quill (2007). Global
Entrepreneurship Monitor 2006 Financing Report.
London, U.K.: London Business School and Babson
Park, MA: Babson College.
52
References
Cantillon, R. (1755). Essai sur la Nature du
Commerce en Général (The Nature of Trade
in General), Paris: Institut National D'études
Démographiques.
Carree, M. A. and R. A. Thurik (2003). “The Impact
of Entrepreneurship on Economic Growth.” In:
Z. J. Acs and D. B. Audretsch (Eds.). Handbook
of Entrepreneurship Research. Boston: Kluwer
Academic Publishers, 437-471.
Carree, M. A., A. J. van Stel, A. R. Thurik and
A. R .M. Wennekers (2002). “Economic Development
and Business Ownership: An Analysis Using Data of
23 OECD Countries in the Period 1976-1996,” Small
Business Economics, 19, 271-290.
Davidsson, P. (1991). “Continued Entrepreneurship
– Ability, Need, and Opportunity as Determinants of
Small Firm Growth,” Journal of Business Venturing,
6 (6), 405-426.
Davidsson, P. (2004). Researching Entrepreneurship.
New York: Springer.
DeTienne, D. and G. Chandler (2004). “Opportunity
Identification and its Role in the Entrepreneurial
Classroom: A Pedagogical Approach and Empirical
Test,” Academy of Management Learning and
Education, 3(3), 242-257.
Easterly, W. (2001). “The Lost Decade: Developing
Countries’ Stagnation in Spite of Policy Reform
1980-1998,” Journal of Economic Growth, 6, 135.
Evans, D. and L. S. Leighton (1989). “The
Determinants of Changes in U.S. Self-Employment,
1968-1987,” Small Business Economics 1(2), 111-119.
Fiet, J. O. and P. C. Patel (2008). “Entrepreneurial
Discovery as Sustained, Systematic Search,” Small
Business Economics, 30, 215-229.
Gartner, W. B. (1985). “A Framework for Describing
and Classifying the Phenomenon of New Venture
Creation,” Academy of Management Review, 10(4),
696-706.
Godin, K., J. Clemens, and N. Veldhuis (2008).
“Measuring Entrepreneurship: Conceptual
Frameworks and Empirical Indicators,” Studies in
Entrepreneurship and Markets, 7. Fraser Institute.
Gries, T. and W. Naude (2008). “Entrepreneurship
and Structural Economic Transformation,”
UNU-Wider Research Papers. Helsinki.
Headd, B. (2003). “Redefining Business Success:
Distinguishing Between Closure and Failure,” Small
Business Economics 21, 51-61.
Henrekson, M. (2005). “Entrepreneurship: A Weak
Link in the Welfare State?” Industrial and Corporate
Change, 14(3), 437-467.
Hills, G. E. and R. P. Singh (2004). “Opportunity
Recognition.” In: Gartner, W. B., K G. Shaver, N.
M. Carter and P. D. Reynolds (Eds.), Handbook of
Entrepreneurial Dynamics; The Process of Business
Creation, London: Sage Publications.
Hirooka, M. (2003). “Nonlinear Dynamism of
Innovation and Business Cycles,” Journal of
Evolutionary Economics, 13, 549–576.
Holmes, K. R., E. J. Feulner and M. A. O’Grady
(2008). 2008 Index of Economic Freedom.
Washington, D.C.: The Heritage Foundation
and New York: Wall Street Journal.
Honig, B. (2004). “Entrepreneurship Education:
Toward a Model of Contingency-Based Business
Planning,” Academy of Management Learning
and Education, 3(3), 258-273.
Jorgenson, D. W. (2001). “Information Technology
and the U.S. Economy,” American Economic Review,
91 (1), 1-32.
Kihlstrom, R. E. and J J. Laffont (1979). “A General
Equilibrium Entrepreneurial Theory of Firm
Formation Based on Risk Aversion,” Journal of
Political Economy, 87, 719–49.
Kirzner, I. (1973). Competition and Entrepreneurship.
Chicago: University of Chicago Press.
Koellinger, P. (2008). “Why are Some Entrepreneurs
More Innovative than Others?” Small Business
Economics, 31, 21-37.
Kuznets, S. (1966). Modern Economic Growth. New
Haven: Yale University Press.
Leibenstein, H. (1968). “Entrepreneurship and
Development,” American Economic Review, 58 (2),
72-83.
Levie, J. and E. Autio (2008). “A Theoretical
Grounding and Test of the GEM Model,” Small
Business Economics, 31(3), 235-263.
Lewis, W. A. (1954). “Economic Development with
Unlimited Supplies of Labour,” The Manchester
School, 28(2), 139-191.
Lucas, R. E. Jr. (1978). “On the Size Distribution of
Business Firms,” Bell Journal of Economics, 9,
508-523.
53
References
Marshall, A. (1890). Principles of Economics. London:
Macmillan and Co.
Mason, C. and R. Harrison (2006). “After the Exit:
Acquisitions, Entrepreneurial Recycling and Regional
Economic Development,” Regional Policy, 40(1),
55-73.
OECD (2003). Science, Technology and Industry
Scoreboard. Paris: OECD.
Parker, S. C. (2004). The Economics of Self-
employment and Entrepreneurship. Cambridge:
Cambridge University Press.
Peterman, N. and J. Kennedy (2003). “Enterprise
Education: Influencing Students' Perceptions of
Entrepreneurship,” Entrepreneurship Theory and
Practice, 28, 129-144.
Porter, M. E., J. J. Sachs, and J. McArthur (2002).
“Executive Summary: Competitiveness and Stages of
Economic Development.” In: Porter, M, J. Sachs, P.K.
Cornelius, J.W. McArthur, and K. Schwab (Eds), The
Global Competitiveness Report 2001-2002, New York:
Oxford University Press, 16-25.
Porter, M. E. and K. Schwab (2008). The Global
Competitiveness Report 2008-2009. Geneva,
Switzerland: World Economic Forum.
Reynolds, P. D., N. S. Bosma, E. Autio, S. Hunt, N.
De Bono, I. Servais, P. Lopez-Garcia and N. Chin
(2005). “Global Entrepreneurship Monitor: Data
Collection Design and Implementation, 1998-2003,”
Small Business Economics, 24(3), 205-231.
Robinson, C., B. O’Leary, and A. Rincon (2006).
Business Start-Ups, Closures and Economic Churn:
A Review of the Literature. Final report prepared
for the Small Business Service, 23 August. London:
National Institute of Economic and Social Research.
Schramm, C. J. (2006). The Entrepreneurial
Imperative. New York: Harper Collins.
Schramm, C. J. (2008). “Economic Fluidity: A Crucial
Dimension of Economic Freedom.” In: Holmes, K. R.,
E. J. Feulner, and M. A. O’Grady (Eds.), 2008 Index of
Economic Freedom. Washington, D.C.: The Heritage
Foundation and New York: Wall Street Journal,
15-22.
Schumpeter, J. A. (1934). The Theory of Economic
Development. Cambridge MA: Harvard University
Press.
Schumpeter, J. A. (1942). Capitalism, Socialism and
Democracy, New York: Harper and Row.
Shane, S. and S. Venkataraman (2000). “The
Promise of Entrepreneurship as a Field of Research,”
Academy of Management Review, 25, 217-226.
Shane, S. (2003). A General Theory of
Entrepreneurship: The Individual-Opportunity
Nexus. Aldershot, UK: Edward Elgar.
Storey, D. J. (1991). “The Birth of New Firms – does
unemployment matter? A Review of the evidence,”
Small Business Economics, 3(3), 167-178.
Thurik, A.R., M.A. Carree, A. van Stel and D.B.
Audretsch (2008). “Does Self-Employment Reduce
Unemployment?” Journal of Business Venturing,
23(6), 673-686.
Wennekers, A.R.M. and A.R. Thurik (1999). “Linking
Entrepreneurship and Economic Growth,” Small
Business Economics, 13(1), 27-55.
Wennekers, A.R.M., A. van Stel, A.R. Thurik and P.D.
Reynolds. (2005). “Nascent entrepreneurship and
the level of economic development,” Small Business
Economics, 24(3), 293-309.
Wiklund, J., P. Davidsson and F. Delmar (2003).
“What Do They Think and Feel About Growth?
An Expectancy-Value Approach to Small
Business Managers’ Attitudes Towards Growth,”
Entrepreneurship Theory and Practice, 27 (3),
247-266.
54
GEM National Teams 2008
Team Institution
National Team
Members
Financial Sponsors
APS
Vendor
Angola
Universidade Católica de Angola
(UCAN)
Sociedade Portuguesa de
Inovação (SPI)
Alves da Rocha
Salim Abdul Valimamade
Augusto Medina
Sara Medina
Douglas Thompson
Anders Hyttel
João Medina
Banco de Fomento S.A.
Centro de
Pesquisas,
Sondagens e
Estudos de
Opinião
(CENSOP
- Dr. Bernardo
Vieira)
Argentina
Center for Entrepreneurship
IAE Management and
Business School
Universidad Austral
Silvia Torres Carbonell
Leticia Arcucci
Hector Rocha
Juan Martin Rodriguez
Center for Entrepreneurship,
IAE Management and Business School,
Universidad Austral
Banco Santander Rio
Subsecretaría de Desarrollo Económico,
Ministerio de Desarrollo Económico -
Gobierno de la Ciudad de Buenos Aires
Prosperar, Agencia Nacional de Desarrollo
de Inversiones
MORI Argentina
Belgium Vlerick Leuven Gent
Management School
Hans Crijns
Miguel Meuleman
Olivier Tilleuil
Flemisch Government, Steunpunt
Ondernemen en Internationaal Ondernemen
(STOIO)
TNS Dimarso
Bolivia Maestrias para el Desarrollo
-Universidad Catolica
Boliviana
Marco Antonio Fernandez
Gover Barja
Mario Avila
Fundación Nuevo Norte
USAID/Bolivia
Fundacion Avina
Red Bolivia Emprendedora
Fundación para la Producción
Cima Group/
Synovate
Bosnia and Herzegovina
Entrepreneurship Development
Center from Tuzla in
partnership with Tuzla
University
Bahrija Umihanic
Admir Nukovic
Boris Curkovic
Esmir Spahic
Rasim Tulumovic
Senad Fazlovic
Sladjana Simic
Entrepreneurship Development Center Tuzla
Government of Tuzla Canton
City of Tuzla
Government of Brcko District of Bosnia and
Herzegovina
PULS BH d.o.o.
Sarajevo
Brazil
IBQP - Instituto Brasileiro da
Qualidade e Produtividade
Simara Maria S. S. Greco
Paulo Alberto Bastos Junior
Joana Paula Machado
Rodrigo G. M. Silvestre
Carlos Artur Krüger Passos
Júlio César Felix
Marcos Mueller Schlemm
Instituto Brasileiro da Qualidade e
Produtividade – IBQP
Serviço Brasileiro de Apoio às Micro e
Pequenas Empresas – SEBRAE
Serviço Nacional de Aprendizagem
Industrial - SENAI / PR
Serviço Social da Indústria - SESI / PR
Universidade Positivo
Bonilha
Comunicação e
Marketing S/C
Ltda.
55
Team Institution
National Team
Members
Financial Sponsors
APS
Vendor
Chile
Regional Teams:
Antofagasta
Coquimbo
Valparaíso
Bío-Bío
Araucanía
Universidad del Desarrollo
Universidad Adolfo Ibáñez
Univ. Católica del Norte
Univ. Técnica Federico
Santa María
Univ. del Desarrollo
Univ. de la Frontera -INCUBATEC
José Ernesto Amorós
Massiel Guerra
Miguel Carrillo
Bárbara Harris
Gianni Romaní
Miguel Atienza
Karla Soria
Cristóbal Fernández Robin
Juan Tapia Gertosio
Jorge Cea Valencia
Olga Pizarro Stiepovic
José Ernesto Amorós
Carlos Isaacs Bornand
Claudina Uribe Bórquez
Franklin Valdebenito Godoy
Gerardo Lagos Wietsenfeld
Pedro Araneda Reyes
InnovaChile de CORFO
Universidad Católica del Norte, DGIP.
Gobierno Regional,
Agencia Regional Desarrollo Productivo.
Universidad Católica del Norte, DGIP.
Gobierno Regional,
Agencia Regional Desarrollo Productivo.
Departamento de Industrias
Y Centro de Ingeniería de Mercados, CIMER,
de la Univ. Técnica Federico Santa María
El Mercurio de Valparaíso
UDD-Facultad de Economía y Negocios.
Dirección de Innovación y Transferencia
Tecnológica de la Universidad de La Frontera
Opina S.A.
Colombia Universidad de los Andes
Universidad ICESI
Universidad del Norte
Pontificia Universidad
Javeriana Cali
Rafael Vesga
Lina Devis
Rodrigo Varela
Luis Miguel Alvarez
Liyis Gomez
Fernando Pereira
Raúl Quiroga
Alberto Arias
SENA
Comfenalco Valle
Centro Nacional
de Consultoría
Croatia
J.J. Strossmayer University in
Osijek
Slavica Singer
Natasa Sarlija
Sanja Pfeifer
Djula Borozan
Suncica Oberman Peterka
Ministry of Economy, Labour and
Entrepreneurship
SME Policy Centre – CEPOR, Zagreb
J.J. Strossmayer University in Osijek – Faculty
of Economics, Osijek
Puls, d.o.o.,
Zagreb
Denmark
University of Southern Denmark
Thomas Schøtt
Torben Bager
Hannes Ottossen
Kim Klyver
Kent Wickstrøm Jensen
Majbritt Rostgaard Evald
Suna Sørensen
International Danish Entrepreneurship
Academy (IDEA)
Institute for
Business Cycle
Analysis
Dominican Republic
Pontificia Universidad Católica
Madre y Maestra (PUCMM)
Guillermo van der Linde
Cecilia Pérez
Maribel Justo
Alina Bello
José Rafael Pérez
Tania Canaán
Grupo Vicini
International Financial Centre of the Americas
Consejo Nacional de Competitividad
Gallup República
Dominicana
Ecuador
Escuela Superior Politécnica
del Litoral (ESPOL)- ESPAE
Graduate School of
Management
Virginia Lasio
Ma. Elizabeth Arteaga
Guido Caicedo
Edgar Izquierdo
Escuela Superior Politécnica del Litoral
(ESPOL)
Survey Data
GEM National Teams 2008
56
Team Institution
National Team
Members
Financial Sponsors
APS
Vendor
Egypt
The British University in Egypt
(BUE)
Egyptian Junior Business
Association (EJB)
David Kirby
Nagwa Ibrahim
Hala Hattab
Amr Gohar
Ahmed Nafie
Industrial Modernization Center, Ministry
of Trade & Industry
ACNielsen
ACNielsen
Finland Turku School of Economics
Anne Kovalainen
Tommi Pukkinen
Jarna Heinonen
Pekka Stenholm
Pia Arenius
Erkko Autio
Ministry of Employment and the Economy
Ministry of Education
The European Union under the European
Regional Development Fund and the
European Social Fund
Turku School of Economics
Taloustutkimus
Oy
France EMLYON Business School
Olivier Torres
Danielle Rousson
Caisse des Depots CSA
Germany
University of Hannover
Institute of Labour Market
Research, Nuremberg
Rolf Sternberg
Udo Brixy
Christian Hundt
Heiko Stüber
Institute of Labour Market Research,
Nuremberg
INFAS
Greece
Foundation for Economic and
Industrial Research (IOBE)
Stavros Ioannides
Takis Politis
Aggelos Tsakanikas
Evaggelia Valavanioti
Hellenic Bank Association Datapower SA
Hungary
University of Pécs, Faculty of
Business and Economics
László Szerb
Zoltan J. Acs
Attila Varga
József Ulbert
Siri Terjesen
Péter Szirmai
Gábor Kerékgyártó
Ministry for National Development and
Economy
University of Pécs, Faculty of
Business and Economics
Ohio University (USA)
Szocio-Gráf
Piac-és
Közvélemény
kutató
Intézet
Iceland
RU Centre for Research
on Innovation and
Entrepreneurship
(Reykjavik University)
Rögnvaldur Sæmundsson
Silja Björk Baldursdóttir
Reykjavik University
Prime Minister’s Office
Capacent Gallup
India
Pearl School of Business,
Gurgaon
Ashutosh Bhupatkar
I. M. Pandey
Janakiraman Moorthy
Gour C. Saha
Pearl School of Business,
Gurgaon
Metric
Consultancy
Iran University of Tehran
M .Ahamadpour Daryani
Abbas Bazargan
Nezameddin Faghih
Caro Lucas
A. A. Moosavi-Movahedi
A. Kord Naeij
S.Mostafa Razavi
Leyla Sarafraz
Jahangir Yadollahi Farsi
Mohammad Reza Zali
Ministry of Labour
and Social Affairs
Dr.
Mohammad
Reza Zali
GEM National Teams 2008
57
GEM National Teams 2008
Team Institution
National Team
Members
Financial Sponsors
APS
Vendor
Ireland Dublin City University
Paula Fitzsimons
Colm O’Gorman
Enterprise Ireland
Forfás
Allied Irish Bank
IFF
Israel
The Ira Center of Business,
Technology & Society, Ben
Gurion University of the
Negev
Ehud Menipaz
Yoash Avrahami
Miri Lerner
The Ira Center of Business,
Technology & Society,
Ben Gurion University of the Negev
The Brandman
Institute
Italy
Bocconi University
Guido Corbetta
Alexandra Dawson
Ernst & Young
Atradius Credit Insurance
Target Research
Jamaica
University of Technology,
Jamaica
Vanetta Skeete
Claudette Williams-Myers
Garth Kiddoe
Girjanauth Boodraj
Joan Lawla
Louise Marcelle-Peart
Faculty of Business and Management,
University of Technology, Jamaica
Koci Market
Research and
Data Mining
Services
Japan
Keio University
Musashi University
Shobi University
Takehiko Isobe
Noriyuki Takahashi
Tsuneo Yahagi
Venture Enterprise Center
Ministry of Economy, Trade
and Industry
Social Survey
Research
Information
Co.,Ltd (SSRI)
Latvia
The TeliaSonera Institute at
the Stockholm School of
Economics in Riga
Olga Rastrigina
Vyacheslav Dombrovsky TeliaSonera AB SKDS
Macedonia
University “Ss. Cyril and
Methodius” – Business
Start-Up Centre
Macedonian Enterprise
Development Foundation
(MEDF)
Radmil Polenakovik
Aleksandar Kurciev
Bojan Jovanoski
Tetjana Lazarevska
Gligor Mihailovski
Lazar Nedanoski
Macedonian Enterprise Development
Foundation (MEDF)
Austrian Development Agency
Macedonian Agency for Promotion of
Entrepreneurship
GfK Skopje
Mexico Tecnológico de Monterrey
Alejandro González
Berenice Ramírez
César Godínez
Tecnológico de Monterrey
Alduncin Y
Asosiados, SA
De CV
Netherlands
EIM Business and Policy
Research
Jolanda Hessels
Sander Wennekers
Chantal Hartog
André van Stel
Niels Bosma
Roy Thurik
Ingrid Verheul
Dutch Ministry of Economic
Affairs
Stratus
marktonderzoek
bv
Norway
Bodo Graduate School of
Business
Lars Kolvereid
Erlend Bullvaag
Bjorn Willy Aamo
Erik Pedersen
Ministry of Trade and Industry
Innovation Norway
The Knowledge Fund, at Bodo
Knowledge Park ltd.
TNS Gallup
Peru Centro de Desarrollo
Emprendedor,
Universidad ESAN
Jaime Serida Nishimura
Liliana Uehara-Uehara
Jessica Alzamora Ruiz
Universidad ESAN Imasen
Republic of Korea Jinju National University
Sung-Sik Bahn
Yong-Sam Lee
Sanggu Seo
Hyunsuk Lee
Donna Kelley
Small and Medium Business Administration
(SMBA)
Hankook Research
Co.
58
Team Institution
National Team
Members
Financial Sponsors
APS
Vendor
Romania
Faculty of Economics and
Business Administration,
Babes-Bolyai University
Stefan Pete
Lehel-Zoltán Györfy
Ágnes Nagy
Dumitru Matis
László Szerb
Liviu Ilies
Comsa Mircea
Annamária Benyovszki
Tünde Petra Petru
Ana Eugenia Matis
Mustatã Rãzvan
Nagy Zsuzsánna-Ágnes
Pro Oeconomica Association
Babes-Bolyai University, Faculty of
Economics and
Business Administration
Metro Media
Transilvania
Russia
Saint Petersburg Team
Graduate School of
Management,
Saint Petersburg
Moscow Team
State University - Higher School
of Economics, Moscow
Olga Verhovskaya
Valery Katkalo
Maria Dorokhina
Alexander Chepurenko
Olga Obraztsova
Tatiana Alimova
Maria Gabelko
Graduate School of Management
at Saint Petersburg State
University
State University - Higher School
of Economics
O+K Marketing &
Consulting
Levada-Center
Serbia
The Faculty of Economics
Subotica
Dusan Bobera
Bozidar Lekovic
Stevan Vasiljev
Pere Tumbas
Sasa Bosnjak
Slobodan Maric
Executive Council of Vojvodina Province,
Department for Economy
Marketing Agency
“Drdrazen” d.o.o.
Subotica
Slovenia
Institute for Entrepreneurship
and Small Business
Management, Faculty of
Economics & Business,
University of Maribor
Miroslav Rebernik
Polona Tominc
Ksenja Pušnik
Ministry of the Economy
Slovenian Research Agency
Smart Com
Finance – Slovenian Business
Daily
RM PLUS
South Africa
University of Cape Town
-Graduate School of
Business
Mike Herrington
Jacqui Kew
Penny Kew
Tonia Overmeyer
Department of Trade and Industry
Swiss South Africa Cooperation Initiative
South African Breweries
Standard Bank
SEDA
Nielsen South
Africa
GEM National Teams 2008
59
Team Institution
National Team
Members
Financial Sponsors
APS
Vendor
Spain
Regional Teams:
Andalucía
Asturias
Aragón
Canary I.
Cantabria
Castille Leon
Castille la Mancha
Catalonia
C. Valenciana
Extremadura
Galicia
Madrid
Murcia
Navarra
Basque Country
Ceuta
Melilla
Instituto de Empresa
Regional Universities:
Cádiz
Oviedo
Univ. de Zaragoza
Las Palmas & La Laguna
Univ. De Cantabria
León
Castille la Mancha
Autónoma de Barcelona
Miguel Hernández
Fundación Xavier de Salas
Santiago de Compostela
Autónoma de Madrid
Univ. de Murcia
Pública de Navarra
Deusto & Basque Country
Univ. de Granada & Escuela de
Negocios de Andalucía
Ignacio de la Vega
Alicia Coduras
Isabel Gonzalez
Cristina Cruz
Rachida Justo
Regional Team Directors:
José Ruiz Navarro
Juan Ventura Victoria
Lucio Fuentelsaz
Rosa M. Batista Canino
Fco. Javier Martínez
Mariano Nieto Antolín
Miguel Ángel Galindo Martín
Carlos Guallarte
José Mª Gómez Gras
Ricardo Hernández Mogollón
J. Alberto Díez de Castro
Eduardo Bueno Campos
Antonio Aragón Sánchez
Iñaki Mas Erice
Iñaki Peña Legazkue
Lázaro Rodríguez Ariza
María del Mar Fuentes
DGPYMES
Fundación Cultural Banesto
Fundación Incyde
IE Business School
Junta de Andalucía
Gob. de Aragón
Gob. del Principado de Asturias
Gob. de Canarias, Cabildo
Fondo Social Europeo
Gob. de Cantabria
Centros de Innovación
Europeos (Navarra, Murcia, C
y León)
Generalitat de Catalunya
Junta de Extremadura
Air Nostrum, CEG, BIC Galicia
IMADE, FGUAM
Fundación Caja Murcia
Eusko Ikaskuntza
Instituto Vasco de Competitividad
FESNA
Universidad de Granada and many others
Instituto
Opinòmetre
S.L.
Turkey
Yeditepe University
Nilüfer Egrican
Esra Karadeniz
Endeavor, Turkey Country Office
Akbank
Akademetre
Research
& Strategic
Planning
United Kingdom
 
 
Hunter Center for
Entrepreneurship,
University of Strathclyde
Economics & Strategy Group,
Aston Business School,
Aston University
Jonathan Levie
Mark Hart
BERR Enterprise Directorate
InvestNI
Department of Enterprise, Trade
and Investment (NI)
Belfast City Council
Enterprise Northern Ireland
Hunter Centre for
Entrepreneurship, University of
Strathclyde
Scottish Enterprise
Welsh Assembly Government
One North East
North West Development Agency
Yorkshire Forward
Advantage West Midlands
East Midlands Development
Agency
South West of England Development Agency
South East Development
Agency
Enterprise Insight
Wessex Enterprise
IFF
GEM National Teams 2008
60
GEM National Teams 2008
Team Institution
National Team
Members
Financial Sponsors
APS
Vendor
United States
Babson College
Baruch College, City University
of New York
I. Elaine Allen
Marcia Cole
Monica Dean
Ivory Phinisee
Joseph Onochie
Edward Rogoff
Babson College
Baruch College
Opinion
Search
Uruguay
Instituto de Estudios
Empresariales de Montevideo
(IEEM)
Leonardo Veiga
Pablo Regent
Fernando Borraz
Alejandro Gaidana
Adrián Edelman
Cecilia Gomeza
IEEM Business School -
Universidad de Montevideo
Mori, Uruguay
GEM Global
Coordination
Team
London Business School
SMU - Cox School of Business
Babson College
Utrecht University
IE Business School
Michael Hay
Mark Quill
Chris Aylett
Jackline Odoch
Mick Hancock
Maria Minniti
William D. Bygrave
Marcia Cole
Jeff Seaman
Niels Bosma
Alicia Coduras
Universidad del Desarrollo
Babson College
N/A
61
About the Authors
Niels BosMa
Niels Bosma is a member of the Urban and Regional research centre Utrecht, section of Economic Geography,
Utrecht University. He is the Research Director for GERA, the research organization that hosts the Global
Entrepreneurship Monitor. He has an MSc in Econometrics from the University of Groningen and was
previously an entrepreneurship researcher at EIM Business & Policy Research in the Netherlands. He has
published several articles in entrepreneurship journals.
ZOLTAN J. ACS
Zoltan J. Acs is University Professor at the School of Public Policy and Director of the Center for
Entrepreneurship and Public Policy. He is also a Research Scholar at the Max Planck Institute for Economics
in Jena, Germany, and Scholar-in-Residence at the Kauffman Foundation. He is coeditor and founder of
Small Business Economics, the leading entrepreneurship and small business publication in the world. Dr.
Acs is a leading advocate of the importance of entrepreneurship for economic development. He received the
2001 International Award for Entrepreneurship and Small Business Research, on behalf of The Sweedish
National Board for Industrial and Technical Development. He has published more than 100 articles and
20 books, including articles in the American Economic Review, Review of Economics and Statistics, Kyklos,
Journal of Urban Economics, Economica, Research Policy and Science Policy. His most recent publication is
Entrepreneurship, Geography and American Economic Growth, Cambridge University Press.
ERKKO AUTIO
Erkko Autio is QinetiQ-EPSRC Chair Professor of technology transfer and entrepreneurship at the Imperial
College Business School in London. He has published widely in high-growth entrepreneurship, international
entrepreneurship, and technology-based venturing. He has served on the boards of several technology-based
ventures and VC funds and advised several governments on entrepreneurship policy. Currently chairing EU DG
Innovation’s advisory panel on high-growth entrepreneurship policy, he is a founding coordination team member
of the Global Entrepreneurship Monitor.
ALICIA CODURAS
Alicia Coduras is a research professor in the Department of Entrepreneurial Management in the Instituto
de Empresa Business School, Madrid, Spain. She is a member of the GEM Coordination Team and Technical
Director of GEM Spain. She holds a doctorate in Political Sciences from the University of Pompeu Fabra and a
degree in Economic and Business Sciences from the University of Barcelona. She has published more than 30
articles and book chapters based on GEM data and led the regional development of GEM Spain.
JONATHAN LEVIE
Jonathan Levie is a senior lecturer at the Hunter Centre for Entrepreneurship in the University of Strathclyde,
Glasgow, UK, where he was Director from 2000 to 2005. He was previously Associate Coordinator of Global
Entrepreneurship Monitor, based at London Business School. He has a PhD from London Business School and
MSc and BSc from the National University of Ireland. He has been teaching and researching entrepreneurship
for more than 25 years.
62
GEM Sponsors
GERA and GEM
The Global Entrepreneurship Research Association (GERA) is, for formal constitutional
and regulatory purposes, the umbrella organization that hosts the GEM project. GERA is
an association formed of Babson College, London Business School, and representatives of
the Association of GEM national teams.
The GEM program is a major initiative aimed at describing and analyzing entrepreneurial
processes within a wide range of countries. The program has three main objectives:
•	 To measure differences in the level of entrepreneurial activity between countries.
•	 To uncover factors leading to appropriate levels of entrepreneurship.
•	 To suggest policies that may enhance the national level of entrepreneurial activity.
New developments, and all global, national, and special topic reports, can be found at
www.gemconsortium.org. The program is sponsored by Babson College and London
Business School.
BABSON COLLEGE
Babson College in Wellesley, Massachusetts, USA, is recognized internationally as a
leader in entrepreneurial management education. Babson grants BS degrees through its
innovative undergraduate program, and grants MBA and custom MS and MBA degrees
through the F.W. Olin Graduate School of Business at Babson College. Babson Executive
Education offers executive development programs to experienced managers worldwide.
For information, visit www.babson.edu.
Universidad del desarrollo
Universidad del Desarrollo, UDD, Educational project was driven by outstanding leaders
of the Chilean public and business scene and is today one of the top three prestigious
private universities in Chile. Success came quickly, after just eighteen years, its rapid
growth has become an expression of the University’s main facet: entrepreneurship. UDD
MBA is rated one of the best in Latin America and number one in Entrepreneurship,
according to AméricaEconomîa magazine, and achievement that once again represents
the “entrepreneurial” seal that is embedded in the spirit of the University. For more
information visit www.udd.cl.
63
Contacts
For more information on this report, contact Niels Bosma at:
nbosma@gemconsortium.org
To download copies of the GEM Global Report(s), GEM National Team Reports, and to access select
data sets, please visit the GEM Web site:
www.gemconsortium.org
Nations not currently represented in the GEM Consortium may express interest in joining and ask
for additional information by e-mailing:
Mick Hancock at mhancock@gemconsortium.org
Marcia Cole at colema@gemconsortium.org, or
Chris Aylett at Caylett@london.edu
64
Endnotes
i
These phases coincide with the classification by the most recent Global Competitiveness Report into factor-
driven, efficiency-driven and innovation-driven economies. See Porter and Schwab (2008).
ii
Evidence is documented by e.g. Carree and Thurik (2003), Acs (2006), Audretsch, (2007).
iii
See Acs, Parsons and Tracy (2007).
iv
See Wennekers and colleagues (2005), Gries & Naude (2008).
v
See e.g. Gartner (1986) and Shane and Venkataraman (2000).
vi
See Levie and Autio (2008) for a more detailed discussion.
vii
Most new businesses do not survive beyond three or four years. This is the main rationale for the choice of
42 months as the cut-off period. However, the choice of 42 months reflects also operational issues. According to
Reynolds and colleagues (2005), “The relevant interview question asked only the year when salary and wage
payments were initiated and most surveys occurred in the summer months; so the alternatives for choosing
a “new firm age” were 1.5 years, 2.5 years, 3.5 years, etc. The shortest time frame that would provide enough
cases for stable prevalence rates with a total sample of 2,000 seemed to occur at 3.5 years. Conceptually, any
time period under five years seemed satisfactory so this age was considered an appropriate trade-off between
conceptual and operational considerations in the early years of the project. There has been no compelling reason
to adjust this criterion and a desire for a stable time series has led to its continued use. It should be considered a
procedure to capture existing firms less than three or four years old."
viii
The sample sizes in the GEM 2008 study typically range from 2,000 to 3,500. Notable exceptions are Spain
(31,000 respondents) and the UK (8,000 respondents).
ix
See Kirzner (1973) and Shane (2003).
x
This report focuses on country comparisons. For many countries, regional differences in entrepreneurial
behavior are also significant. This has been documented for Europe, using GEM data, by Bosma and Schutjens
(2007) and for Germany by Bergmann and Sternberg (2007). The relationships described in this section are also
applicable to regional differences.
xi
For literature on opportunity costs of entrepreneurship see e.g. Lucas (1978), Shane and Venkataraman (2000)
and Parker (2005).
xii
Hills and Singh (2004) report that among 472 US nascent entrepreneurs in 1998, for 37% the opportunity
discovery came before the desire to start a business, while for 42% the desire to start came before the
recognition of an opportunity. For the remaining 21% opportunity recognition and desire to start came at about
the same time.
xiv
The model proposed by Shane focuses on entrepreneurial behavior without necessarily linking to owning and
managing a business.
xv
This concerns the following efficiency-driven countries: Argentina, Brazil, Chile, Croatia, Hungary and
South Africa. Innovation-driven economies included in this analysis are Belgium, Denmark, Finland, France,
Germany, Iceland, Ireland, Italy, Japan, Netherlands, Norway, Slovenia, Spain, Sweden, United Kingdom,
United States.
xv
For instance, on 25 March 2008 the Financial Times reported that Iceland’s banking system was in trouble, see
http://www.ft.com/cms/s/0/5f9301dc-fa51-11dc-aa46-000077b07658.html?nclick_check=1.
xvi
In the Global Competitiveness Reports the countries are classified in three major phases and two ‘transition’
phases. To create three country groups, we assigned countries in a transition phase to the major phase they
were emerging from..
xvii
“Statistical significance” refers to a calculation of where the range within which the average value of 95 out
of 100 replications of the survey would be expected to lie. This range is shown in Figure 2 by vertical bars on
either side of each data point. If the ‘confidence intervals’ (denoted by the vertical bars) of two national TEA
65
rates do not overlap, the difference between the TEA rates is not statistically significant at the 0.05 level.
Reference in this report to significant differences implies statistically significant difference at the 0.05 level.
xviii
See the Global Entrepreneurship Monitor reports from 2004-2006 available at www.gemconsortium.org.
xix
The R-squared of the fitted curve (third order polynomial) equals 0.49.
xx
The calculation of opportunity-driven early-stage differs somewhat from pre-2007 reports. GEM identifies
these different motivations in two stages. First, respondents involved in early-stage entrepreneurial activity are
asked whether they are involved because they recognized an opportunity, or because they had no better options
for work. Recognizing that this question is polyvalent and that people operating somewhere in between these
extremes tend to answer the first option, those who chose recognition of an opportunity were asked whether the
main driver behind pursuing this opportunity was: (a) to increase their own income, (b) to be independent; or
(c) to maintain their income. The latter category was not considered as a genuine opportunity for the measures
shown in Figure 11.
xxi
As argued further above, the necessity rates are probably a conservative estimation. For the remaining group,
i.e. the individuals involved in TEA who were not classified in either of the categories “improvement-driven
opportunity” or “necessity,” no statistical pattern could be discerned.
xxii
Robinson, C., B. O’Leary, and A. Rincon, (2006). Business start-ups, closures and economic churn: A review of
the Literature. Final report prepared for the Small Business Service, 23 August. London: National Institute of
Economic and Social Research.
xxiii
More detailed information can be found in the special GEM reports on Women and Entrepreneurship,
available on the GEM website (www.gemconsortium.org).
xxiv
Missing data have been estimated as a function of the existing data.
xxv
In total, we had 678, 714 adult-population interviews for the combined 2006 – 2008 data set.
xxvi
An over-sample for the Shenzhen region was excluded from China’s data because of its anomalous nature.
xxvii
In general world cities exhibit higher aspiration levels in early-stage entrepreneurial activity in comparison
to the rest of the country, see Acs and colleagues 2008.
xxviii
Business activities are reported in answer to an open-ended question. The open-ended questions are coded
into the ISIC coding classification (4-digits).
xxix
This classification includes ‘medium high’ and ‘high’ technology sectors in Manufacturing and Services. See
OECD (2003).
xxx
Data for Hungary is not reported here because of an unusually high “don’t know” response rate.
xxxi
Factor analysis was conducted on the total sample and country by country. Across the 25 nations, the three
original items loaded onto one factor which explained 67% of the variance with acceptable reliability (0.754)
and sampling adequacy (.676). Country level reliability and sampling adequacy were similar. This suggests that
these three items are capturing different dimensions of one underlying construct.
xxxii
Researchers have suggested that education and training for entrepreneurship should positively impact
entrepreneurial activity by enhancing instrumental skills required to startup and grow a business (Honig,
2004), by enhancing cognitive ability of individuals to manage the complexities involved in opportunity
recognition and assessment (DeTienne and Chandler, 2004), and by affecting their cultural attitudes and
behavioral dispositions (Peterman and Kennedy, 2003). Demonstrating these effects, however, has been a
challenge. First, there may be considerable self-selection into entrepreneurship education. Secondly, the effects
may be long term rather than instantaneous. For example, in the short term, graduates of entrepreneurship
education may recognize the need to amass specific knowledge (Fiet and Patel, 2008) and decide to defer
action. Thirdly, there is the need for adequate control groups to demonstrate effects. Fourthly, individuals may
receive such education and training at several points in their lives, such as at school, university, or after formal
education, and it may take the form of traditional learning or experiential immersion in the phenomenon,
Endnotes
66
Endnotes
through a placement, for example. As a result of these issues, population-level evidence concerning the influence
of entrepreneurship training and education on entrepreneurial activity is still lacking (Béchard and Grégoire,
2005). See Levie and Autio (2008) for a wider discussion.
xxxiii
A small subset of respondents in Angola were also asked these questions. As this sample was too small for
the analysis undertaken here, Angola is not included in this chapter.
xxxiv
Chi-square tests were used to test for significant differences in proportions of training by age group for each
country. Chi-square statistics returning p values of less than 0.05 were regarded as evidence of significant
differences in proportions.
xxxv
Typically, between 18 and 36 experts completed a structured questionnaire containing statements about
aspects of entrepreneurship education and training in the country. They rated each statement on a 5-point scale,
where a score of 1 would be “not true,” of 3 would be neutral, and of 5 “completely true.”
xxxvi
The two measures of high-growth expectation were: expect to create at least 10 jobs and at least double
current employment in 5 years time, and expect to create at least 20 jobs in 5 years time. These two measures
were highly correlated across the 28 countries (r = .961, p = .000).
Gem Global 08

Gem Global 08

  • 1.
    Niels Bosma •Zoltan J. Acs • Erkko Autio • Alicia Coduras • Jonathan Levie 2008 Executive Report Global Entrepreneurship monitor
  • 2.
    Global Entrepreneurship Monitor 2008Executive Report Niels Bosma, Zoltan J. Acs, Erkko Autio, Alicia Coduras, Jonathan Levie Founding and Sponsoring Institutions Babson College, Babson Park, MA, US Lead Sponsoring Institution and Founding Institution Universidad del Desarrollo, Santiago, Chile Sponsoring Institution London Business School, London, UK Founding Institution Although GEM data were used in the preparation of this report, their interpretation and use are the sole responsibility of the authors. The authors also wish to thank Marcia Cole and Sands Creative Group for their exceptional work on this report. In addition, the authors would like to express their thanks to Chris Aylett (GEM Administrator), Marcia Cole (GEM Project Manager), Mick Hancock (GEM Project & National Teams Manager), Mark Quill (GEM Data Manager) and all GEM National Teams for their continued contributions and dedication to GEM. © 2009 by N. S. Bosma, Z. J. Acs, E. Autio, A. Coduras, J. Levie, and Global Entrepreneurship Research Consortium (GERA).
  • 3.
    2 EXECUTIVE SUMMARY 4 1.0Introduction 9 1.1 About GEM 7 1.2 The Revised GEM Model 7 1.3 Capturing Entrepreneurship in GEM 11 1.4 GEM Website and Data Availability 13 2.0 Entrepreneurial Attitudes, Activity and Aspirations 14 2.1 Entrepreneurial Attitudes and Perceptions 14 2.2 Entrepreneurial Activity 19 2.3 Entrepreneurial Aspirations 31 3.0 Entrepreneurship, Institutions and Economic Development 36 3.1 Linking Institutions, Entrepreneurship, and Development 36 3.2 Recognizing the Complex Relationship between Entrepreneurship and Economic Development Using GEM Data 38 4.0 Special Topic 2008: Entrepreneurship Education and Training 41 4.1 Participation in Entrepreneurship Education and Training 41 4.2 Expert Opinions on Quality of Entrepreneurship Training 45 4.3 Entrepreneurship Training and Entrepreneurial Attitudes, Aspirations, and Activity at the Individual Level 48 REFERENCES 51 GEM NATIONAL TEAMS 2008 54 ABOUT THE AUTHORS 61 GEM SPONSORS 62 CONTACTS 63 ENDNOTES 64 Table of Contents
  • 4.
    3 Table of Contents Listof Tables Table 1 Entrepreneurial Attitudes and Perceptions in the 43 GEM 2008 Countries, by Phase of Economic Development 16 Table 2 Prevalence Rates (in %) of Entrepreneurial Activity and Business Owner-Managers across GEM Countries in 2008, for those Aged 18-64, by Phase of Economic Development 20 Table 3 The Correlation Coefficients between GE INDEX and Other Major Indices 40 Table 4 Percentage of the Population Aged 18-64 that Received Voluntary or Compulsory Training in Starting a Business During or After School, by Type of Country 43 Table 5 Percentage of the Population Aged 18-64 that Received Any Training in Starting a Business After School, by Type of Training Provider 44 Table 6 Perceived Need for and Availability and Quality of Entrepreneurship Education and Training, by Country and Country Group (Average Ratings by Experts from 1 to 5) 46 Table 7 Percentage of the Population Aged 18-64 Who Are Not Running or Trying to Start a Business and Their Perceptions of Entrepreneurship, by Type of Business Start-Up Training Received and by Type of Country 49 Table 8 Percentage of the Population Aged 18-64 Expecting to Start a Business in the Next Three Years or Engaged in Early-Stage Entrepreneurial Activity by Type of Training Received and by Type of Country 50 List of Figures Figure 1 The Revised GEM Model 10 Figure 2 The Entrepreneurial Process and GEM Operational Definitions 11 Figure 3 Perceived Opportunities for Starting a Business, 2001-2008 17 Figure 4 Fear of Failure among Those who Perceive Good Start-Up Opportunities, 2001-2008 17 Figure 5 Perceived Skills and Knowledge to Start a New Business, 2001-2008 18 Figure 6 Intentions to Start a New Business in the Next Three Years, 2002-2008 18 Figure 7 Early-Stage Entrepreneurial Activity (TEA) for 43 Nations in 2008, by Phase of Economic Development, Showing 95% Confidence Intervals 21 Figure 8 Early-Stage Entrepreneurial Activity Rates and Per Capita GDP, 2008 22 Figure 9 Necessity- and Improvement-Driven Opportunity Motivations as a Percentage of Early-Stage Entrepreneurial Activity, GEM 2008 Countries 24 Figure 10 Expressed Reasons behind Discontinuing Businesses, by Age, GEM 2008 24 Figure 11 Sector Distribution Early-Stage Entrepreneurial Activity 25 Figure 12 Sector Distribution Established Business 25 Figure 13 Early-Stage Entrepreneurial Activity Rates for Separate Age Groups, 2008 26 Figure 14 Early-Stage Entrepreneurial Activity Rates by Gender, 2008 27 Figure 15 Early-Stage Entrepreneurial Activity (TEA) Rates for 2001-2008, Averages over Efficiency-Driven Countries and Innovation-Driven Countries 28 Figure 16 Necessity-Driven TEA Rates for 2001-2008, Averages over Efficiency-Driven Countries and Innovation-Driven Countries 28 Figure 17 Prevalence Rates of High-Growth Expectation Early-Stage Entrepreneurship (HEA) in the Adult Population 31 Figure 18 Anatomy of High-Growth Expectation Early-Stage Entrepreneurship (HEA): Percentages in TEA 32 Figure 19 Percentage of Early-Stage Entrepreneurial Activity with New Product-Market Combination, 2002-2008 32 Figure 20 Percentage of Early-Stage Entrepreneurial Activity in Technology Sector, 2002-2008 33 Figure 21 Innovation Confidence Index for 2007 and 2008 by Country and Country Group 35 Figure 22 The Global Entrepreneurship Index in Terms of GDP PPP 39 Figure 23 Relationships between the Global Entrepreneurship Index and Economic Freedom Index, Doing Business Index and Global Competitiveness Index 40 Figure 24 Percentage of Adults Aged 18-64 Who Have Used Online Training in Starting a Business 45
  • 5.
    4 Executive Summary Since itsinception in 1997 by scholars at Babson College and London Business School, GEM has developed into one of the world’s leading research consortia concerned with improving our understanding of the relationships between entrepreneurship and national development. This is the 10th annual GEM Global Report. Over the past decade, harmonized data on entrepreneurial attitudes, activity and aspirations have been collected to provide annual assessments of the entrepreneurial sector for a wide range of countries. Participating Countries in 2008 In this report a distinction is made between factor-driven countries, efficiency-driven countries and innovation- driven countries. This classification follows the 2008 Global Competitiveness Report and is relevant to entrepreneurship in relation to economic development. As previous GEM research has shown, the relationship between entrepreneurship and economic development differs along phases of economic development. In 2008, the following 43 countries participated in the GEM project. Factor-Driven Economies Angola, Bolivia, Bosnia and Herzegovina*, Colombia*, Ecuador*, Egypt, India, Iran* Efficiency-Driven Economies Argentina, Brazil, Chile, Croatia**, Dominican Republic, Hungary**, Jamaica, Latvia, Macedonia, Mexico, Peru, Romania, Russia, Serbia, South Africa, Turkey, Uruguay Innovation-Driven economies Belgium, Denmark, Finland, France, Germany, Greece, Iceland, Ireland, Israel, Italy, Japan, Republic of Korea, Netherlands, Norway, Slovenia, Spain, United Kingdom, United States * Transition country: from factor-driven to efficiency-driven ** Transition country: from efficiency-driven to innovation-driven GEM Data Collection GEM Adult Population Survey: Measuring Attitudes, Activity and Aspirations GEM takes a broad view of entrepreneurship and focuses on the role played by individuals in the entrepreneurial process. The GEM Adult Population Surveys ask a representative sample of at least 2,000 adults in each country about their attitudes to and their involvement in, entrepreneurship. For many individuals the entrepreneurial process often starts with personal assessments dealing with attitudes and perceptions to entrepreneurship. GEM therefore collects data on attitudes and perceptions such as perceived opportunities to start businesses, perceived skills and knowledge to start businesses, and national support for starting a business as a good career choice. Also, GEM asks adults about intentions to start a business in the near future. Unlike most entrepreneurship data sets that measure newer and smaller firms, GEM studies individuals’ activities with respect to starting and managing a business. Furthermore, GEM views entrepreneurship as a process and considers people in entrepreneurial activity in different phases from the very early phase when the business is in gestation to the established phase and possibly discontinuation of the business. Within this context, GEM provides a means by which a wide variety of important entrepreneurial aspirations such as innovativeness, competitiveness and high-growth aspirations can be systematically and rigorously studied.
  • 6.
    5 GEM National ExpertSurvey: Measuring Entrepreneurial Framework Conditions To see how conditions for entrepreneurship differ across countries, GEM countries survey experts in several fields that are important for entrepreneurship. Examples of such Entrepreneurial Framework Conditions (EFCs) are national policies for entrepreneurship, entrepreneurial finance and the extent to which entrepreneurship is reflected in education and training. Key Findings in 2008 Entrepreneurial Attitudes The GEM 2008 surveys were conducted mostly during May and June, when the start of the credit crisis loomed but before the true impact of the current economic crisis became apparent. Nevertheless, an overall decline in perceived opportunities to start a business in 2008 was observed. Countries showing the severest declines in the rate of perceived opportunities (between 50 and 30 percent) include Iceland, Chile, Ireland, Latvia and Hungary. Perceived skills and knowledge to start a business were not affected by the business cycle. Also intentions to start a business within three years do not appear to have declined as much in 2008 as perceived opportunities. There are several possible explanations for this. First, the crisis may actually cause individuals to seriously consider becoming entrepreneurs in the near future because they fear they might lose their jobs. Second, the group of (potential) future entrepreneurs may be less pessimistic than the total adult population and may not perceive the financial crisis as a substantial burden for getting their own business started – they might for instance draw more heavily on their own (perceived) capabilities to start a business. Thirdly, they may have decided to defer the startup to near the end of the three year period, with the expectation that the recession will be over within three years. Entrepreneurial Activity In factor-driven economies, with many small-scaled and local business activities, the rate of involvement is high for both early-stage entrepreneurial activity and established business activity. For Angola, however, the rate of established business activity is very small compared to the other factor-driven economies, while the rate of discontinued business is very high. These findings may reflect Angola’s recent emergence from prolonged civil war and unrest. For efficiency-driven economies a clear distinction can be made between Latin American countries with relatively high early- stage entrepreneurial activity and Eastern European countries with relatively low rates of early-stage entrepreneurial activity. In the United States there is more early-stage entrepreneurial activity than in EU countries and Japan. The rate of early-stage entrepreneurship in Japan has gradually increased in recent years and is now around the EU average. Some European countries – most notably Belgium, Germany and France – consistently have the lowest rates of entrepreneurial activity levels. This possibly reflects the relative risk aversion of European inhabitants and their declared relative preference for employment over self- employment. But it also indicates that there are good income alternatives available, through jobs or social security. The overall development of early-stage entrepreneurial activity in innovation-driven economies has been quite stable over time. A slight and gradual rise is observed, from 5.7% in 2002 to 6.4% in 2008. For efficiency-driven economies the pattern is more sensitive to the business cycle. Argentina in particular has shown a significant reaction to its national economic crisis; in 2001- 2003 the Argentinean rate of necessity early-stage entrepreneurs rose from 3.9 to 7.4 percent. Entrepreneurial Aspirations Most of the nascent and new entrepreneurs identified in GEM show either no or only limited job creation expectations. High-growth expectation entrepreneurial activity (HEA) varies widely between countries, as does the relative prevalence of this activity within early-stage entrepreneurial activity as a whole. For example, among innovation-driven economies, there is a 15-fold difference between the adult-population prevalence rate of high-expectation early-stage entrepreneurship of the United States and Greece. The difference is over five-fold between the two largest emerging economies in the world, China and India. Colombia, China, Peru and Chile exhibit the highest prevalence rates of high-expectation entre­pre­ neur­ship of the factor- and efficiency-driven GEM countries. The United States, New Zealand, Iceland, and Canada have the highest levels of high-growth expectation entrepreneurial activity in innovation- driven economies. The HEA rate for these countries is well over 1%. The lowest levels of HEA, at under 0.5%, occur in Belgium, France, Spain, Japan, Finland and Greece. Executive Summary
  • 7.
    6 Entrepreneurship: a ComplexRelationship with Institutions and Economic Development The broad nexus between entrepreneurship, economic development and institutions is a critical area of inquiry for understanding entrepreneurship within or across countries. Not just quantitative measures of entrepreneurship, but also qualitative measures of institutional differences are required to estimate the impact of entrepreneurship on the economic development of countries. Chapter 3 introduces a newly constructed complex index of entrepreneurship that combines GEM measures on attitudes, activity and aspirations with other economic indicators that concentrate more on the institutional characteristics. The relationship between this Global Entrepreneurship Index (GEI) and economic development is S-shaped: when factor- driven economies progress in economic development beyond a certain threshold, the GEI tends to increase. The shape of the S-curve broadly matches the three phases of economic development. The GEI is also positively related to three other facets of the “development diamond:” economic freedom, competitiveness and the ease of doing business. The insights resulting from such an index could help policymakers understand how different aspects of policy can affect productive entrepreneurship through the major phases of economic development. GEM Special Topic 2008: Education and Training GEM expert surveys in most countries consistently report that entrepreneurship education and training is poor or inadequate. This is why entrepreneurship education and training was chosen as a special topic for GEM 2008. Thirty nine out of 43 GEM nations included additional questions in their adult population surveys and 31 included additional questions in their expert surveys. The relationship between training in starting a business and entrepreneurial attitudes, aspirations and activity is generally positive, but varies by phase of economic development. Around one-fifth of respondents had received some form of training in starting a business, but this proportion varied widely by country. For example, among factor-driven countries, the proportion of individuals who had received any training in starting a business, either in school or after school, varied from 40% in Colombia to 8% in Egypt. In efficiency-driven countries, it varied from 43% in Chile to 6% in Turkey. In innovation- driven countries, it varied from 48% in Finland to 13% in Israel. Almost 10% of the respondents had engaged in self- directed learning, such as reading or observing or working in other people’s businesses, but this too varied widely by country. The next most frequent overall training choice was voluntary formal education, followed by voluntary training provided by a college or university but outside the formal education system. Other sources, such as business or trade organizations, government agencies, or employers, typically were used by 3% or less of individuals. Colombia, Chile, Peru and Finland had higher than usual usage of all sources. In factor-driven economies, quality and quantity of training is associated with higher levels of necessity- based entrepreneurial activity, while in efficiency- driven countries, it is associated with higher levels of market-expansion entrepreneurial activity. In innovation-driven countries, training levels are negatively associated with some attitudinal and activity measures. Rates of early-stage entrepreneurial activity among those who had received compulsory training were around three-quarters of the rate of those who had received voluntary training, while the “yield” to training varied from 1.5 times the untrained rate for compulsory training in factor-driven countries to 2.5 times the untrained rate for voluntary training in innovation-driven countries. Executive Summary
  • 8.
    7 Introduction 1.1 About GEM Althoughit is widely acknowledged that entrepreneurship is an important force shaping the changes in the economic landscape, our understanding of the relationship between entrepreneurship and development is still far from complete. The quest to unravel the complex relationship has been particularly hampered by a lack of cross-national harmonized data sets on entrepreneurship. Since 1997, the GEM research program has sought to address this by collecting relevant harmonized data on an annual basis. GEM focuses on three main objectives: • To measure differences in the level of entrepreneurial activity among countries • To uncover factors determining national levels of entrepreneurial activity • To identify policies that may enhance the national level of entrepreneurial activity Traditional analyses of economic growth and competitiveness have tended to neglect the role played by new and small firms in the economy. GEM takes a comprehensive approach and considers the degree of involvement in entrepreneurial activity within a country, identifying different types and phases of entrepreneurship. The Global Entrepreneurship Monitor (GEM) was conceived in 1997 by Michael Hay and Bill Bygrave and a prototype study was funded by the London Business School and Babson College. The first GEM Global study was conducted by a group of 10 nations in 1999 with Paul Reynolds as the Principal Investigator. Since then GEM has grown into a consortium of 64 national teams. In 2004, the London Business School and Babson College transferred GEM’s intellectual capital to the Global Entrepreneurship Research Association (GERA), which is a not-for-profit organization governed by representatives of the national teams, the two founding institutions, and sponsoring institutions. In this 10th annual report, we present a revised conceptual model that will be used to further explore the role of entrepreneurial activity in the economy. The model has been updated in accordance with recent insights on entrepreneurship and economic growth. In this revised model, different phases of the economic development of nations are recognized and the role and nature of entrepreneurship is considered to differ along these major phases. Three major phases are recognized: factor-driven economies, which are primarily extractive in nature, efficiency-driven economies in which scale-intensity is a major driver of development, and innovation-driven economies1 . As countries develop economically, they tend to shift from one phase to the next. 1.2 The revised gem model There is wide agreement on the importance of entrepreneurship for economic development2 . Entrepreneurs drive innovation, they speed up structural changes in the economy and they force old incumbent companies to shape up, thereby making an indirect contribution to productivity. It is widely accepted that high-impact entrepreneurs in particular make an outsized contribution to job creation, sometimes providing for the totality of new net job creation in the economy3 . While important, the contribution of entrepreneurs to an economy also varies according to its phase of economic development4 . According to “received wisdom,” the level of necessity-driven self- employment activity is high particularly at low levels of economic development, as the economy may not be able to sustain a high enough number of jobs in high-productivity sectors. As an economy develops, the level of necessity-driven entrepreneurial activity gradually declines as productive sectors grow and supply more employment opportunities. At the same time, opportunity-driven entrepreneurial activity tends to pick up, introducing a qualitative change in overall entrepreneurial activity. This decline in necessity entrepreneurship followed by an increase in opportunity entrepreneurship is known as the “U-curve” hypothesis. While there is much anecdotal support for the U-curve hypothesis, it only demonstrates an association and does not fully reflect the complexity of the causal relationship between entrepreneurship and economic growth. In this year’s GEM report, we introduce a more nuanced distinction among phases of economic development, in line with Porter’s typology of “factor- driven economies,” “efficiency-driven economies” and “innovation-driven economies” (2002).
  • 9.
    8 Entrepreneurship in Factor-DrivenEconomies Economic development consists of changes in the quantity and character of economic value added (Lewis, 1954). These changes result in greater productivity and rising per capita incomes, and they often coincide with migration of labor across different economic sectors in society, for example from primary and extractive sectors to the manufacturing sector, and eventually, services (Gries & Naude, 2008). Countries with low levels of economic development typically have a large agricultural sector, which provides subsistence for the majority of the population who mostly still live in the countryside. This situation changes as industrial activity starts to develop, often around the extraction of natural resources. As extractive industry starts to develop, this triggers economic growth, prompting surplus population from agriculture to migrate toward extractive and emergent scale-intensive sectors, which are often located in specific regions. The resulting oversupply of labor feeds subsistence entrepreneurship in regional agglomerations, as surplus workers seek to create self-employment opportunities in order to make a living. Entrepreneurship in Efficiency-Driven Economies As the industrial sector develops further, institutions start to emerge to support further industrialization and the build-up of scale in the pursuit of higher productivity through economies of scale. Typically, national economic policies in scale-intensive economies shape their emerging economic and financial institutions to favor large national businesses. As increasing economic productivity contributes to financial capital formation, niches may open in industrial supply chains that service these national incumbents. This, combined with the opening up of independent supply of financial capital from the emerging banking sector, would expand opportunities for the development of small-scale and medium-sized manufacturing sectors. Thus, in a scale-intensive economy, one would expect necessity-driven industrial activity to gradually fall and give way to an emerging small-scale manufacturing sector. Entrepreneurship in Innovation-Driven Economies As an economy matures and its wealth increases, one may expect the emphasis in industrial activity to gradually shift toward an expanding service sector that caters to the needs of an increasingly affluent population and supplies the services normally expected of a high-income society. The industrial sector evolves and experiences improvements in variety and sophistication. Such a development would be typically associated with increasing research and development and knowledge intensity, as knowledge-generating institutions in the economy gain momentum. This development opens the way for the development of innovative, opportunity- seeking entrepreneurial activity that is not afraid to challenge established incumbents in the economy. Often, small and innovative entrepreneurial firms enjoy an innovation productivity advantage over large incumbents, enabling them to operate as ‘agents of creative destruction.’ To the extent that the economic and financial institutions created during the scale-intensive phase of the economy are able to accommodate and support opportunity-seeking entrepreneurial activity, innovative entrepreneurial firms may emerge as significant drivers of economic growth and wealth creation (Henrekson, 2005). Entrepreneurship: Attitudes, Activity and Aspirations Different opinions on, and therefore different definitions of, entrepreneurship can be observed in the recent literature, as well as over time. These historical views of entrepreneurship are interesting in that they reflect the roles of entrepreneurship in each of the three economic phases we have just outlined. Cantillon (1755) is believed to be the first scholar to define entrepreneurship. He qualified entrepreneurship as “as someone who identified the willingness to bear the personal financial risk of a business venture.” This definition reflects the role of entrepreneurship in Europe in the 18th century. It relates more to the static notion of entrepreneurship as being a ‘business owner’ than the more dynamic notion that has to do with starting new ventures. At the end of the 19th century, Marshall’s view centered on the class of entrepreneurs and their importance for the market economy (Marshall, 1890). He described how industrial entrepreneurs exploited economies of skill and economies of scale, and likened the most successful of them akin to large trees in a forest, towering above their neighbors, depriving them of light and air. The “Marshallian” view relates well to the economic view of scale-intensive entrepreneurship as a reflection of the efficiency-driven stage. Schumpeter (1934;1942) was a pioneer in linking the dynamic aspect of entrepreneurship to innovations and economic development. His concept of “creative destruction” can be directly linked to the role of entrepreneurship in innovation-driven countries. Entrepreneurs introducing product-market combinations move the technology frontier forward and destroy economic activity based on older technology. Current views on entrepreneurship vary, and this underlines the multi-faceted nature of entrepreneurship. Davidsson (2004) lists seven phenomena associated with entrepreneurship, while Wennekers and Thurik (1999) provide thirteen different concepts of entrepreneurship. Introduction
  • 10.
    9 Introduction In a recentstudy, Godin and colleagues (2008) identify six common elements of entrepreneurship. Looking at the proposed constructs in some detail, three main components may be identified: entrepreneurial attitudes, entrepreneurial activity and entrepreneurial aspiration (Acs and Szerb, 2008). These are interlinked in a complex set of feed- forward and feedback loops. For example, positive attitudes towards entrepreneurship may increase entrepreneurial activity and aspiration, which in turn positively affect attitudes as more positive role models appear. Positive aspirations may change the nature of activity, and in turn, change attitudes. Entrepreneurial attitudes are attitudes toward entrepreneurship. For example, the extent to which people think there are good opportunities for starting a business, or the degree to which they attach high status to entrepreneurs, might be termed entrepreneurial attitudes. Other relevant attitudes might include the level of risk that individuals might be willing to bear and individuals’ perception of their own skills, knowledge and experience in business creation. Entrepreneurial attitudes can influence entrepreneurial activity but can also be influenced by entrepreneurial activity. For example, the legitimacy of entrepreneurship in a society, as expressed in positive entrepreneurial attitudes, can be influenced by whether people know anyone who has started a business recently. This can be a function of both levels of entrepreneurial activity and social networking activity in the society. Individuals who know other individuals who recently started a business may, through familiarity with the process, be more likely to see it as legitimate. Entrepreneurial attitudes are important because they express the general feelings of the population toward entrepreneurs and entrepreneurship. It is important for countries to have people who can recognize valuable business opportunities, and who perceive they have the required skills to exploit these opportunities. Moreover, if national attitudes toward entrepreneurship are positive, this will generate cultural support, help, financial resources, and networking benefits to those who are already entrepreneurs or want to start a business. Entrepreneurial activity is multi-faceted, but one important aspect is the extent to which people in a population are creating new business activity, both in absolute terms and relative to other economic activities, such as business closure. Within the realm of new business activity, different types of entrepreneurial activity can be distinguished. For example, business creation may vary by industry sector, by the size of the founding team, and by whether the new venture is legally independent of other businesses, and in terms of founder demographics, such as gender, age, or education. Entrepreneurial activity is best seen as a process rather than an event5 . That is why GEM measures entrepreneurial intentions, and nascent, new, and established business activity. Examining multiple components of entrepreneurial activity also allows us to explore differences among the entrepreneurial processes across the three major phases of national economic development. For example, nascent and new business activity is expected to be high in factor-driven economies mainly because much of it is motivated by economic necessity. In innovation-driven economies, the proportion of opportunity-driven entrepreneurship is expected to be higher than in factor- and efficiency- driven economies. Entrepreneurial aspiration reflects the qualitative nature of entrepreneurial activity. For example, entrepreneurs differ in their aspirations to introduce new products, new production processes, to engage with foreign markets, to develop a significant organization, and to fund growth with external capital. These aspirations, if they are realized, can significantly affect the economic impact of these entrepreneurial activities. Product and process innovation, internationalization, and ambition for high growth are regarded as hallmarks of ambitious or high-aspiration entrepreneurship. GEM has created measures that capture such aspirations. Entrepreneurial Framework Conditions The 2007 GEM Global Report discussed the relevance of Entrepreneurial Framework Conditions (EFCs) as indicators of a country’s potential to foster entrepreneurship (Bosma, et al., 2008). EFCs reflect major features of a country’s socio-economic milieu that are expected to have a significant impact on the entrepreneurial sector. Like the original GEM model, the revised GEM model maintains that, at the national level, different framework conditions apply to established business activity and to new business activity6 . What is new about the revised model is that we have related these conditions to a country’s phase of economic development. The relevant national conditions for factor-driven economic activity and efficiency-driven economic activity are adopted from the Global Competitiveness Report (GCR) 2008 (Porter and Schwab, 2008). With respect to innovation-driven economic activity, the revised GEM model makes a contribution to the GCR perspective on economic development by identifying framework conditions that are specific to innovation and entrepreneurship. As Acs and colleagues (2003) propose, it is the entrepreneurial mechanism that turns innovation into economic output. A lack of entrepreneurship can therefore be seen as a bottleneck for innovation-driven countries in achieving their growth ambitions.
  • 11.
    10 It is importantto recognize that all three principal types of economic activity: factor-driven, efficiency- driven, and innovation-driven, are present in all national economies. But their relative prevalence—and their contribution to economic development—varies. The GCR proposition is that each phase of economic development has a different optimal combination of these three activities. The three phases are labeled according to the activity that is most significant for that phase. Thus, the relative importance of entrepreneurial framework conditions to a country may vary by phase of economic development. As the 2004 GEM global report noted, one size does not fit all (Acs, et al., 2005). The resulting revised GEM Model is presented in Figure 1. For factor-driven economies, emphasis is put on basic requirements: development of institutions, infrastructure, macroeconomic stability, health, and primary education. These basic requirements will help sustain necessity-based entrepreneurship, but may do little to enable opportunity-based entrepreneurship. As economies progress and scale economies become more and more relevant, other conditions, which ensure a proper functioning of the market and are called efficiency enhancers, become important. Even though these conditions are not directly related to entrepreneurship in the Schumpeterian sense, they are indirectly related since the development of markets will also attract more entrepreneurship. For countries whose economic development is primarily innovation-driven, EFCs become more important as levers of economic development than basic requirements or efficiency enhancers. Entrepreneurial attitudes, activity, and aspiration as dynamic interactive components of entrepreneurship are characterized in detail in Chapter 2, using the results of the GEM Adult Population Survey. Chapter 3 focuses on the role of institutions in each of the three phases. Each year, the GEM reports highlights one aspect of the GEM conceptual model. In Chapter 4 we focus on one EFC, entrepreneurship education and training, which was chosen as a special topic for GEM in 2008. Extra questions on this special topic were included in the GEM Adult Population Survey and the standard National Expert Survey (NES) this year, and the answers are summarized and commented on with respect to the revised GEM model. Social, Cultural, Political Context Basic requirements - Institutions - Infrastructure - Macroeconomic stability - Health and primary education Established Firms (primary economy) Attitudes: Perceived opportunities Perceived capacity Activity: Early-stage Persistence Exits Aspirations: Growth Innovation Social value creation New branches, firm growth National Economic Growth (Jobs and Technical Innovation) Entrepreneurship Efficiency enhancers - Higher education & training - Goods market efficiency - Labor market efficiency - Financial market sophistication - Technological readiness - Market size Innovation and entrepreneurship - Entrepreneurial finance - Gov. entrepreneurship programs - Entrepreneurship education - R&D transfer - Commercial, legal infrastructure for entrepreneurship - Entry regulation Figure 1 — The Revised GEM Model Introduction
  • 12.
    11 1.3 Capturing Entrepreneurship inGEM The previous section showed that entrepreneurship is a complex phenomenon which spans a variety of contexts. In line with its objectives, GEM takes a broad view of entrepreneurship and focuses on the role played by individuals in the entrepreneurial process. Unlike most entrepreneurship data sets that measure newer and smaller firms, GEM studies the behavior of individuals with respect to starting and managing a business. This differentiates GEM from other data sets, most of which record firm-level data on (new) firm registrations (see Box 1). New firms are, most often, started by individuals. Even in established organizations, individuals have different entrepreneurial attitudes, activities, and aspirations. Another guiding principle of GEM research is that entrepreneurship is a process. Therefore GEM needs to do more than compare entrepreneurial attitudes and aspirations of those who are and are not engaging in entrepreneurship. It also needs to capture attitudes, activities, and aspirations in different phases of entrepreneurship, from general intentions to a more active early or “nascent” phase where businesses are in gestation, to new businesses that can be identified as having commenced operations, to the established phase and possibly discontinuation of the business. An individual entrepreneur who has succeeded in creating and sustaining a business has gone through a process. The entrepreneurial process starts before the firm is operational. Someone who is just starting a venture and trying to survive in a very competitive market is an entrepreneur in spite of not having high-growth aspirations. On the other hand, a person may be an established business owner who has been in business for quite a number of years and still be innovative, competitive, and growth- minded. This person is also an entrepreneur. GEM provides an umbrella under which a wide variety of entrepreneurial characteristics, such as motivations, innovativeness, competitiveness, and high-growth aspirations, can be systematically and rigorously studied. Within this context, the GEM data collection covers the life cycle of the entrepreneurial process and looks at individuals at the point when they commit resources to start a business they expect to own themselves (nascent entrepreneurs); when they currently own and manage a new business that has paid salaries for more than three months but not more than 42 months (new business owners); and when they own and manage an established business that has been in operation for more than 42 months (established business owners). Figure 2 summarizes the entrepreneurial process and GEM’s operational definitions. For GEM, the payment of any wages for more than three months to anybody, including the owners, is considered to be the “birth event” of actual businesses. Thus, the distinction between nascent entrepreneurs and new business owners depends on the age of the business. Businesses that have paid salaries and wages for more than three months and less than 42 months may be considered new. The cut-off point of 42 months has been made on a combination of theoretical and operational grounds7 .The prevalence rate of nascent entrepreneurs and new business owners taken together may be viewed as an indicator of early-stage entrepreneurial activity in a country. It represents dynamic new firm activity. Even if a fair share of nascent entrepreneurs do not succeed in getting the business started, their actions may have a beneficial effect on the economy since the threat of entry and of new competition can put pressure on incumbent firms to perform better. Business owners who have paid salaries and wages for more than 42 months are classified as “established business owners.” Their businesses have survived the liability of newness. High rates of established business ownership may indicate positive conditions for firm survival. However, this is not necessarily the case. If a country exhibits a high degree of established entrepreneurship combined with a low degree of early- stage entrepreneurial activity, this indicates a low level of dynamism in entrepreneurial activity8 . Potential entrepreneur: opportunities, knowledge, and skills Nascent entrepreneur: involved in setting up a business Owner-manager of a new business (up to 3.5 years old) Owner-manager of an established business (more than 3.5 years old) Conception Firm birth Persistence Early-stage Entrepreneurial Activity (TEA) Figure 2 — The Entrepreneurial Process and GEM Operational Definitions Introduction
  • 13.
    12 This year’s GEMreport includes 43 countries across the globe. In each of these 43 countries, a survey was held among a representative sample of at least 2,000 adults. More than 150,000 adults were interviewed between May and October (outside holiday seasons) and answered questions on their attitudes toward and involvement in entrepreneurial activity. Box 1. Main Distinctions between GEM Adult Population Survey Data and Business Registration Data GEM is a social survey directed at individuals. In GEM’s research perspective, it is individuals who are primary agents in setting up, starting, and maintaining new and entrepreneurial businesses. The main distinctions between GEM data and business registrations data are as follows: GEM data are obtained using a research design• that is harmonized over all participating countries. Despite recent initiatives by Eurostat, OECD, and the World Bank, the harmonization of national business registrations has not yet been achieved. GEM data uniquely enables reliable comparisons across countries. The robustness of the GEM method is demonstrated by the stability of year-on-year comparisons at the country level. GEM’s research design implies statistical• uncertainties in the aggregate (country- level) results. This is acknowledged by publishing confidence intervals for the obtained entrepreneurship indices. Business registration data are “count data” and as such do not require confidence intervals. However, the accuracy of registration data as a measure of new business activity is unclear for several countries. For example, in the UK, most businesses are not (and are not required to be) registered at all, while in Spain registration is compulsory before trading can commence. In some countries, businesses may be registered purely for tax reasons without entrepreneurial activity taking place, while in other countries businesses are deliberately not registered to avoid paying taxes. GEM tracks people who are in the process of• setting up a business (nascent entrepreneurs), as well as people who own and manage running businesses. These also include freelancers, or other entrepreneurs who in some jurisdictions need not register. GEM also measures attitudes and self-perceptions regarding entrepreneurship. Insight about the earliest phase of the start-up process and the entrepreneurial spirit is very relevant for policy makers. The primary purpose of GEM is• not to count the number of new businesses in different countries. It is about measuring entrepreneurial spirit and entrepreneurial activity through different phases of the entrepreneurial process. Therefore, GEM data may not be the best source for some basic firm- level characteristics, particularly in countries that tightly regulate new business activity and whose citizens have high respect for the rule of law. For example, to determine sector distribution of existing firms, registration data are mostly preferable over GEM data (with the possible exception of GEM countries with a large number of respondents, such as Spain and the UK). GEM generates more than measures of• entrepreneurial activity; it also generates measures of entrepreneurial attitudes and aspirations. Examples are motivations for being self-employed, the degree of innovative activities, and growth expectation. However, these characteristics should always be derived from an adequate sample; to achieve this, one may need to merge the GEM samples over several years. In the Appendix of the GEM Global Report 2005, measures were derived from GEM data based on definitions of self-employment rates and start-up rates as published by the OECD and Eurostat. The rates based on GEM data appeared to match the rates on registrations data fairly well. Nevertheless, one should be aware that the GEM data are distinctive, and designed to measure entrepreneurial activity across a wide range of countries, including those where government business registration data may not provide a true and fair reflection of actual business activity. Introduction
  • 14.
    13 Introduction 1.4 GEM Websiteand Data Availability GEM is a consortium of national teams, participating in the Global Entrepreneurship Research Association (GERA—the umbrella organization that hosts the GEM project). Thanks to the effort and dedication of hundreds of entrepreneurship scholars as well as policy advisors across the globe, the GEM consortium consists of a unique network building a unique data set. Contact details, GEM 2008 National Summary Sheets, and national teams’ micro-sites can be found on www.gemconsortium.org. A selection of GEM data is also made available on this website. The GEM website provides an updated list of the growing number of peer-reviewed scientific articles based on GEM data. Glossary of Main Measures and Terminology Measure Description Entrepreneurial Attitudes and Perceptions Perceived opportunities Percentage of 18-64 population (individuals involved in any stage of entrepreneurial activity excluded) who see good opportunities to start a firm in the area where they live Perceived capabilities Percentage of 18-64 population (individuals involved in any stage of entrepreneurial activity excluded) who believe they have the required skills and knowledge to start a business Entrepreneurial intention Percentage of 18-64 population (individuals involved in any stage of entrepreneurial activity excluded) who intend to start a business within three years Fear of failure rate Percentage of 18-64 population with positive perceived opportunities (individuals involved in any stage of entrepreneurial activity excluded) who indicate that fear of failure would prevent them from setting up a business Entrepreneurship as desirable career choice Percentage of 18-64 population who agree with the statement that in their country, most people consider starting a business as a desirable career choice Media attention for entrepreneurship Percentage of 18-64 population who agree with the statement that in their country, they will often see stories in the public media about successful new businesses Entrepreneurial Activity Nascent entrepreneurship rate Percentage of 18-64 population who are currently a nascent entrepreneur, i.e., actively involved in setting up a business they will own or co-own; this business has not paid salaries, wages, or any other payments to the owners for more than three months New business ownership rate Percentage of 18-64 population who are currently a owner-manager of a new business, i.e., owning and managing a running business that has paid salaries, wages, or any other payments to the owners for more than three months, but not more than 42 months Early-stage entrepreneurial activity (TEA) Percentage of 18-64 population who are either a nascent entrepreneur or owner-manager of a new business (as defined above) Established business ownership rate Percentage of 18-64 population who are currently owner-manager of an established business, i.e., owning and managing a running business that has paid salaries, wages, or any other payments to the owners for more than 42 months Overall entrepreneurial activity rate Percentage of 18-64 population who are either involved in early-stage entrepreneurial activity or owner-manager of an established business (as defined above) Business discontinuation rate Percentage of 18-64 population who have, in the past 12 months, discontinued a business, either by selling, shutting down, or otherwise discontinuing an owner/management relationship with the business. Note: This is NOT a measure of business failure rates. Improvement-driven opportunity entrepreneurial activity: relative prevalence Percentage of those involved in early-stage entrepreneurial activity (as defined above) who (i) claim to be driven by opportunity as opposed to finding no other option for work; and (ii) who indicate the main driver for being involved in this opportunity is being independent or increasing their income, rather than just maintaining their income Entrepreneurial Aspirations High-growth expectation early-stage entrepreneurial activity (HEA) Percentage of 18-64 population who are either a nascent entrepreneur or owner-manager of a new business (as defined above) and expect to employ at least 20 employees five years from now High-growth expectation early-stage entrepreneurial activity: relative prevalence Percentage of early-stage entrepreneurs (as defined above) who expect to employ at least 20 employees five years from now New product-market oriented early-stage entrepreneurial activity: relative prevalence Percentage of early-stage entrepreneurs (as defined above) who indicate that their product or service is new to at least some customers and indicate that not many businesses offer the same product or service Early-stage entrepreneurial activity in technology sectors: relative prevalence Percentage of early-stage entrepreneurs (as defined above) who are active in the ‘high technology’ or ‘medium high’ technology sector, as classified by OECD (2003)
  • 15.
    14 2.0 Entrepreneurial Attitudes,Activity and Aspirations This chapter provides an assessment of the characteristics of entrepreneurship in the 43 GEM 2008 countries by presenting several indices that measure aspects of Entrepreneurial Attitudes, Activity and Aspirations. The countries included in this assessment are listed in Box 2. The countries are grouped into three phases of economic development as discussed in the Global Competitiveness Report 2008- 2009 (Porter and Schwab, 2008). Phases of economic development are decided on the level of GDP per capita and the extent to which countries are factor- driven in terms of the shares of exports of primary goods in total exports. Box 2. Country Groups Used in this Report for the 43 GEM 2008 Countries Factor-Driven Economies Angola, Bolivia, Bosnia and Herzegovina*, Colombia*, Ecuador*, Egypt, India, Iran* Efficiency-Driven Economies Argentina, Brazil, Chile, Croatia**, Dominican Republic, Hungary**, Jamaica, Latvia, Macedonia, Mexico, Peru, Romania, Russia, Serbia, South Africa, Turkey, Uruguay Innovation-Driven Economies Belgium, Denmark, Finland, France, Germany, Greece, Iceland, Ireland, Israel, Italy, Japan, Republic of Korea, Netherlands, Norway, Slovenia, Spain, United Kingdom, United States * Transition country: from factor-driven to efficiency-driven ** Transition country: from efficiency-driven to innovation-driven 2.1 Entrepreneurial Attitudes and Perceptions Perceptions about entrepreneurship may affect the supply side and the demand side of entrepreneurship. On the supply side, or the “pool” of potential entrepreneurs, important perceptions include both willingness and perceived ability to become an entrepreneur (Davidsson, 1991). Education levels and the availability of entrepreneurship training programs are possible determinants of perceived skills (see Chapter 4). On the demand side, or “space for” entrepreneurship, there needs to be opportunities for entrepreneurship, but equally important is that entrepreneurs perceive that there are opportunities for starting a business9 . The quantity and quality of perceived opportunities may be enhanced by national conditions such as economic growth, population growth, culture and national entrepreneurship policy10 . But there are more factors than these at play. As people see more and more successful entrepreneurs in their direct environment, this may enhance their perception of their own capabilities without enhancing actual capabilities. This effect may be stronger when the economic climate is favorable. Furthermore, there may be demographic differences in (perceived) entrepreneurial capabilities for historical socio-economic or cultural reasons. Policy programs may explicitly target groups exhibiting low shares of perceived capabilities as well as low shares of actual capabilities. Thus, several distinct national conditions may affect perceived capabilities directly and indirectly. If an individual exhibits positive perceptions toward entrepreneurship, it is by no means certain that he or she will actually get involved in entrepreneurial activity. There are several assessments to be made, which may or may not be conscious. First, there is the assessment of opportunity costs, which involves comparing the expected returns of entrepreneurship to the expected returns of an alternative occupation11 . The most common alternative is “being employed.” Then, there is a risk-reward assessment: even if the expected returns from entrepreneurship are considerably higher than the best alternative, the (perceived) risks involved may be too high for a person who is thinking about starting a business. An individual’s risk-avoidance preference may be a significant factor in the transition from potential (or latent) entrepreneurship to entrepreneurial activity (Khilstrom and Laffont, 1979). At the same time, the individual may also be influenced by demographic characteristics such as age, gender, origin, or ethnicity
  • 16.
    15 Entrepreneurial Attitudes, Activityand Aspirations and also by institutions. For instance, older people might include their health and the specifics of the health care system in the risk-reward assessment, while immigrants might perceive fewer alternative options for earning a living. Intrinsic assessments as described on the previous page, may ultimately lead to a proclaimed intention (and subsequent action) to start a business with opportunity-related entrepreneurship in mind. This holds for the bulk of entrepreneurs, particularly in innovation-driven countries. For some people, however, being involved in entrepreneurial activity is a necessity; there are simply no other options for earning a living and there is no comparative assessment to be made. Also, there is no general pattern describing the sequence in which assessments and decisions are made and steps are taken. It is also possible that people decide to start a business when a very specific business opportunity comes into view unexpectedly. They may act on this even though, before the business opportunity came their way, they did not see opportunities to start a business in their area. These people had not considered setting up a business until the opportunity was presented to them. Thus, for entrepreneurs, the perception of opportunities may come well in advance, or just before setting up the business, or at the same time12 . Shane (2003) has proposed a model of the world in which opportunities exist13 but they need to be discovered. In this view, national governments could consider ways of increasing the likelihood of discovery as a means of enhancing the entrepreneurial climate. Table 1 lists several GEM indicators concerning individuals’ own perceptions toward entrepreneurship for each of the 43 GEM 2008 nations. Some countries have favorable perceptions of entrepreneurship combined with low rates of intentional entrepreneurship. This is the case for many innovation-driven economies in Europe. In other words, although attitudes and perceptions toward entrepreneurship are fairly high, the attractiveness of becoming involved in entrepreneurship appears to be low for many Europeans compared to other possible sources of income. A variety of national characteristics could be underlying this phenomenon. It could be that there is a lot of red tape (administrative burdens) attached to starting a business, reducing the attractiveness of entrepreneurship. It could also be the case that employment protection is high. This could discourage employees with positive entrepreneurial perceptions from switching to entrepreneurship. A different effect of stringent employment protection is that potential entrepreneurs may think carefully before hiring employees due to the substantial losses they would incur if their employees became unfit for work, or if they had to reduce the number of workers. Fear of failure is often considered an important cultural component that is detrimental to new firm activity. However, so far this asserted effect has not been fully confirmed. Every year, GEM asks a random sample of individuals if fear of failure would prevent them from starting up a business. In order to grasp the “fear of failure” effect, it makes sense to consider this question only for those who are not currently involved in entrepreneurship but do perceive good opportunities for setting up a business. If fear of failure is prevalent among those who in principle see good opportunities to start a business, this may justify intervening to reduce fear of failure. For many countries with factor-driven and efficiency- driven economies, we see that the difference between entrepreneurial perceptions and entrepreneurial intentions is relatively small, or even negative. This suggests lower opportunity costs for entrepreneurial activity and higher degrees of necessity-driven entrepreneurship. On the right-hand side of Table 1, we present the results of two indicators measuring national attitudes to entrepreneurship. The first one assesses the percentage of inhabitants who feel that in their country, entrepreneurship is considered a desirable career choice. This indicator varies widely within each of the three phases of economic development. The second indicator relates to the popularity of entrepreneurship and asks for opinions on the media coverage for new businesses in the country, as perceived by the respondents. In countries with primarily factor-driven economies, these attitudes should not be the main concern of government (see Figure 1). In countries with mainly efficiency-driven economies, attention should begin to be paid to attitudes. Table 1 suggests that attitudes in Hungary could be improved, while Latin American countries have in general quite favorable attitudes. Looking at innovation-driven countries, some anomalies are apparent. These could provide governments with clues as to what they could do to encourage entrepreneurial activity. For example, in Japan most people agree that there is a lot of media attention to entrepreneurship, yet starting a business is still not regarded as a good career choice. For Denmark it is the other way around. The Netherlands shows the highest rates of approval of entrepreneurship as a career, yet only 4% of the Dutch adult population (early-stage entrepreneurs and established business owners excluded) expects to start a business within the next three years. The Netherlands is an example of a country where there is much support for entrepreneurship but where the job market is also favorable.
  • 17.
    16 Entrepreneurial Attitudes, Activityand Aspirations Factor-Driven Economies % agreeing with statement Angola 74 45 71 44 27 49 46 Bolivia 52 49 38 67 38 81 60 Bosnia and Herzegovina 50 26 39 62 25 82 60 Colombia 65 41 34 54 60 92 78 Ecuador 50 35 33 66 37 79 57 Egypt 40 25 40 53 35 73 57 India 58 46 56 45 33 67 81 Iran 35 22 45 58 36 57 53 Efficiency-Driven Economies Argentina 48 40 30 53 15 69 80 Brazil 44 43 44 49 26 68 78 Chile 30 34 41 54 29 80 44 Croatia 53 36 51 56 10 70 61 Dominican Republic 58 31 54 70 30 92 64 Hungary 26 47 26 43 6 48 19 Jamaica 52 26 46 65 17 81 71 Latvia 37 37 33 23 7 75 71 Macedonia 47 35 46 52 39 80 66 Mexico 59 31 50 55 26 66 52 Peru 60 38 50 66 34 82 71 Romania 45 52 36 21 9 . 56 Russia 39 66 33 14 3 60 50 Serbia 56 28 52 60 31 72 67 South Africa 60 38 41 31 13 65 69 Turkey 47 39 27 44 21 72 63 Uruguay 57 33 40 58 17 71 67 Innovation-Driven Economies Belgium 23 30 28 34 6 47 38 Denmark 69 43 43 30 5 57 32 Finland 54 32 46 30 5 46 71 France 34 53 33 25 13 63 48 Germany 35 49 29 30 4 56 50 Greece 35 55 35 46 13 76 55 Iceland 38 36 60 45 12 61 81 Ireland 35 37 33 42 6 55 65 Israel 39 43 35 35 14 58 57 Italy 35 48 30 35 7 68 40 Japan 13 44 21 9 4 26 59 Republic of Korea 20 32 32 23 17 69 67 Netherlands 54 33 32 30 4 85 61 Norway 46 28 34 33 7 61 71 Slovenia 55 33 50 44 7 58 67 Spain 32 52 36 43 5 68 43 United Kingdom 41 38 23 45 5 52 54 United States 44 28 33 48 7 63 73 A) Denominator: non-entrepreneurially active adult population 18-64 years B) Denominator: non-entrepreneurially active adult population 18-64 years that sees good opportunities to start a business C) Denominator: adult Population 18-64 years Source: GEM Adult Population Survey (APS) Table 1 — Entrepreneurial Attitudes and Perceptions in the 43 GEM Countries in 2008, by Phase of Economic Development Sees good opportunities for starting a business in the next 6 months a) Fear of failure would prevent starting a businessb) Personally knows someone who started a business in the past 2 years a) Has the required knowledge and skills to start a businessa) Expects to start a business in the next three yearsa) Country attitudes perceived by individuals Entrepreneurship considered as desirable career choice c) Media Attention for Entrepreneurshipc)
  • 18.
    17 Entrepreneurial Attitudes, Activityand Aspirations Development in Perceptions, Intentions and National Attitudes Figure 3 displays average annual differences between efficiency-driven and innovation-driven countries in two types of entrepreneurial attitudes over the period 2001-2008. Included in this assessment are only countries that have been participating in GEM over the entire period, with a maximum dropout of one year. This includes 17 innovation-driven countries and six efficiency-driven countries14 . Figure 3 shows that the developments in perceived opportunities run reasonably parallel for the two stages of economic development. Since 2003, the share of people in efficiency-driven countries that see good opportunities for start-ups in the area where they live has matched the share in innovation-driven countries. This finding is, however, primarily caused by Argentina showing very low rates before 2003 in the aftermath of the national economic crisis and showing high rates afterwards. The GEM surveys have mostly been conducted in the months May and June. In 2008, this was after the first signs of a pending financial crisis but before the scale of the current economic crisis was fully appreciated15 . However, most countries show a decline in perceived opportunities from 2007- 2008, and this is reflected in Figure 3. Countries showing the severest declines in the rate of perceived opportunities (between 50 and 30 percent) include Iceland, Chile, Ireland, Latvia and Hungary. Changes over time in the fear of failure indicator are shown in Figure 4. The cyclical patterns of efficiency- driven and innovation-driven countries track each other fairly well. These patterns also appear to be the inverse of the opportunity indicator. Fear of failure has risen to some extent in 2008 for both types of country, and by around the same amount as opportunity perception has fallen. This finding can be directly related to the perceived economic situation. During recessions failures have bigger consequences, as alternative sources of income are scarcer. 20% 25% 30% 35% 40% 45% 2001 2002 2003 2004 2005 2006 2007 2008 Innovation-Driven Economies Efficiency-Driven Economies Figure 3 — Perceived Opportunities for Starting a Business, 2001-2008 Figure 4 — Fear of Failure among Those who Perceive Good Start-Up Opportunities, 2001-2008 Note: Each data point is a simple country average for that year Source: GEM Adult Population Survey (APS) Innovation-Driven Economies Efficiency-Driven Economies 25% 30% 35% 40% 45% 50% 2001 2002 2003 2004 2005 2006 2007 2008
  • 19.
    18 Entrepreneurial Attitudes, Activityand Aspirations While perceived opportunities have declined and fear of failure has increased over the period from 2007-2008, perceived skills and knowledge to start a business have remained stable, as shown in Figure 5. Individuals’ perceptions about their own skills do not appear to be affected by the business cycle. Furthermore, perceived capabilities for starting a business in efficiency-driven economies are— on average—higher than in innovation-driven economies. This is probably because the perception of an “average” business is different across these two types of countries (see Bosma and Schutjens, 2009). Therefore the required skills and knowledge to start a firm generally associated with these “average businesses” are not completely comparable. If the average business in Mexico, for example, is associated with lower required skills in comparison to Norway, the number of people claiming to have these skills will obviously be higher. To find out more about future expectations, since 2002 GEM has asked about intentions to start a business some time over the next three years. Table 2 shows the country estimates for this indicator in 2008. Here the rates of intentions to start a business are expected to differ between efficiency-driven economies and innovation-driven economies. In the lower-income segment of efficiency economies, good job alternatives are generally more sparsely available. This implies that more people will intend to start a business. Indeed we observe this in Figure 6: intention rates are consistently higher in efficiency-driven countries than in innovation-driven economies. A second noteworthy finding is that intentions do not appear to decline as much in 2008 as perceived opportunities. There are several possible explanations for this. First, the crisis may actually cause individuals to seriously consider becoming entrepreneurs in the near future because they fear they might lose their jobs. Second, the group of (potential) future entrepreneurs may be less pessimistic than the total adult population and may not perceive the financial crisis as a substantial burden for getting their own business started—they might, for instance, draw more heavily on their own (perceived) capabilities to start a business. Third, they may have decided to defer the start-up to the end of the three-year period, in the expectation that the recession will be over within three years. Figure 5 — Perceived Skills and Knowledge to Start a New Business, 2001-2008 30% 32% 34% 36% 38% 40% 42% 44% 46% 48% 50% 2001 2002 2003 2004 2005 2006 2007 2008 Innovation-Driven Economies Efficiency-Driven Economies Figure 6 — Intentions to Start a New Business in the Next Three Years, 2002-2008 0% 2% 4% 6% 8% 10% 12% 14% 16% 18% 2001 2002 2003 2004 2005 2006 2007 2008 Innovation-Driven Economies Efficiency-Driven Economies Note: Each data point is a simple country average for that year Source: GEM Adult Population Survey (APS)
  • 20.
    19 Entrepreneurial Attitudes, Activityand Aspirations 2.2 Entrepreneurial Activity Table 2 summarizes the involvement in entrepreneurial activity over several phases of the entrepreneurial process (see Figure 2) for each of the 43 GEM 2008 countries. Countries are grouped according to the major phases of economic development, consistent with the classification of the Global Competitiveness Report 2008-2009 (Porter and Schwab, 2008)16 . Taken together, the numbers in the table provide a picture of the characteristics of overall entrepreneurial activity for each country, i.e., all types of entrepreneurial activity covering the entire economic spectrum. It is no surprise that in factor-driven economies, with many small-scale and local business activities (see Chapter 1), the rate of involvement is high for both early-stage entrepreneurial activity and established business activity. For Angola, however, the rate of established business activity is very small compared to the other factor-driven economies, while the rate of discontinued business is very high. These findings may reflect Angola’s recent emergence from prolonged civil war and unrest. In the United States, there is more early-stage entrepreneurial activity than in EU-countries and Japan. The rate of early-stage entrepreneurship in Japan has gradually increased in recent years and is now around the EU average. Some European countries—and most notably Belgium, Germany, and France—consistently have the lowest rates of entrepreneurial engagement levels. This possibly reflects the relative risk aversion of European inhabitants and their declared relative preference for employment over self-employment (European Commission, 2008). But it also indicates that there are good job alternatives available. It is possible that in Europe, entrepreneurial behavior manifests itself more within established firms. This is also known as “intrapreneurship” and “corporate entrepreneurship.” Currently little is known about how intrapreneurship activity differs across countries.
  • 21.
    20 Table 2 —Prevalence Rates (in %) of Entrepreneurial Activity and Business Owner-Managers across GEM Countries in 2008, for those Aged 18-64, by Phase of Economic Development NASCENT ENTREPREN- EURIAL ACTIVITY NEW BUSINESS OWNER-MANAGER EARLY-STAGE ENTREPRENEURIAL ACTIVITY (TEA) ESTABLISHED BUSINESS-OWNER MANAGERS OVERALL ENTREPREN- EURIAL ACTIVITY BUSINESS DISCONTIN- UATION RATE SAMPLE SIZE 18-64 years Factor-Driven Economies Angola 19.3 4.1 22.7 4.1 26.0 23.4 1,490 Bolivia 17.4 14.3 29.8 19.1 45.6 10.5 1,879 Bosnia and Herzegovina 6.4 2.7 9.0 8.7 17.1 5.0 1,586 Colombia 13.8 11.7 24.5 14.1 36.7 7.1 2,000 Ecuador 8.7 9.1 17.2 11.9 28.1 5.9 2,142 Egypt 7.9 5.5 13.1 8.0 20.2 6.3 2,603 India 6.9 4.9 11.5 16.5 27.6 10.1 1,919 Iran 5.9 3.4 9.2 6.8 15.7 5.2 3,119 Efficiency-Driven Economies Argentina 8.5 8.5 16.5 13.5 29.6 10.2 1,731 Brazil 2.9 9.3 12.0 14.6 26.4 3.5 2,000 Chile 8.6 5.8 14.1 6.8 20.2 5.8 4,068 Croatia 4.9 2.8 7.6 4.8 12.3 2.9 1,696 Dominican Republic 11.7 9.8 20.4 8.2 27.9 11.3 2,013 Hungary 3.8 2.8 6.6 5.3 11.8 1.1 1,994 Jamaica 9.0 7.1 15.6 9.1 24.3 8.9 2,399 Latvia 3.9 2.8 6.5 3.0 9.4 1.7 2,011 Macedonia 7.2 7.7 14.5 11.0 24.8 5.3 1,746 Mexico 9.3 4.0 13.1 4.9 17.8 13.6 2,433 Peru 19.7 6.8 25.6 8.3 32.7 10.4 1,990 Romania 2.5 1.6 4.0 2.1 5.9 2.2 1,667 Russia 1.7 2.0 3.5 1.1 4.4 1.1 1,660 Serbia 4.0 3.6 7.6 9.3 16.5 3.7 1,813 South Africa 5.7 2.1 7.8 2.3 9.9 5.8 2,719 Turkey 3.2 3.0 6.0 4.8 10.7 3.9 2,400 Uruguay 7.7 4.4 11.9 7.9 19.3 9.1 1,645 Innovation-Driven Economies Belgium 2.0 0.9 2.9 2.6 5.3 1.5 1,997 Denmark 2.3 2.3 4.4 4.4 8.4 1.9 2,012 Finland 4.1 3.3 7.3 9.2 16.0 2.1 2,011 France 3.8 1.9 5.6 2.8 8.2 2.2 1,573 Germany 2.4 1.5 3.8 4.0 7.7 1.8 4,751 Greece 5.3 4.6 9.9 12.6 22.0 2.9 1,962 Iceland 6.5 3.6 10.1 7.1 16.7 3.4 2,002 Ireland 3.3 4.3 7.6 9.0 16.3 3.6 1,924 Israel 3.5 3.1 6.4 4.5 10.6 3.2 1,778 Italy 2.0 2.7 4.6 6.5 11.0 1.8 2,970 Japan 3.2 2.3 5.4 7.9 12.7 1.0 1,879 Republic of Korea 3.5 6.5 10.0 12.8 22.6 4.7 2,000 Netherlands 2.1 3.2 5.2 7.2 12.3 1.6 2,534 Norway 5.0 4.0 8.7 7.7 15.8 3.4 1,614 Slovenia 4.1 2.4 6.4 5.6 11.8 1.3 3,019 Spain 3.3 3.9 7.0 9.1 14.8 1.3 30,879 United Kingdom 3.1 2.9 5.9 6.0 11.7 2.1 5,892 United States 5.9 5.0 10.8 8.3 18.7 4.4 3,441 Entrepreneurial Attitudes, Activity and Aspirations Source: GEM Adult Population Survey (APS)
  • 22.
    21 Entrepreneurial Attitudes, Activityand Aspirations Figure 7 presents early-stage entrepreneurial activity (TEA) rates for each GEM 2008 country. The TEA rate is the proportion of people aged 18-64 who are involved in entrepreneurial activity as a nascent entrepreneur or as an owner-manager of a new business. The countries are grouped by phase of economic development and ranked within groups in ascending order of the national point estimate for TEA. Note that if the vertical bars on either side of the point estimates for TEA of any two countries do not overlap, this means that they have statistically different TEA rates17 . This figure serves as a benchmark for countries to see how they compare to other countries in similar phases of economic development. It is certainly not the case that higher TEA rates are always to be preferred. In factor-driven economies, for example, a reduction in the TEA rate may be seen as a good sign, and is especially likely when the general economic climate is doing well and job opportunities increase. Such reduction in TEA would typically be due to a decline in the rate of necessity entrepreneurship. In innovation-driven economies, a high TEA rate may be specific to regional economic, demographic, and cultural contexts and may be composed of entrepreneurs who may vary in type and aspiration. GEM reports have demonstrated a consistent U-shaped association between a country’s level of economic development and its level and type of entrepreneurial activity18 . Figure 8 illustrates this U-shaped relationship between per-capita GDP levels and TEA rates for 200819 . TEA rates in 2008 are derived from the annual GEM Adult Population Surveys (APS) administered to representative samples of the national adult population in 43 countries. The measure is described in more detail in the Introduction. The U-shape pattern can be explained as follows: in countries with low levels of per capita income the national economy is characterized by the prevalence of many very small businesses. As per capita income increases, industrialization and economies of scale allow larger and established firms to satisfy the increasing demand of growing markets and to increase their relative role in the economy. An important factor for achieving growth is the presence of macro- economic and political stability, which is reflected by the development of strong institutions. The increase in the role of large firms may be accompanied by a reduction in the number of new businesses, since a growing number of people find stable employment in large industrial plants. 0% 5% 10% 15% 20% 25% 30% 35% BosniaandHerz. Iran India Egypt Ecuador Angola Colombia Bolivia Russia Romania Turkey Latvia Hungary Croatia Serbia SouthAfrica Uruguay Brazil Mexico Chile Macedonia Jamaica Argentina DominicanRep. Peru Belgium Germany Denmark Italy Netherlands Japan France UnitedKingdom Slovenia Israel Spain Finland Ireland Norway Greece RepublicofKorea Iceland UnitedStates Factor-Driven Economies Efficiency-Driven Economies Innovation-Driven Economies PercentageofAdultPopulationbetween18-64Years Figure 7 — Early-Stage Entrepreneurial Activity (TEA) for 43 Nations in 2008, by Phase of Economic Development, Showing 95% Confidence Intervals Source: GEM Adult Population Survey (APS)
  • 23.
    22 Thus, for countrieswith low levels of per capita income, a decrease in prevalence rates of entrepreneurial activity may be a good sign, especially if this is accompanied by economic growth and political stability. As further increases in income are experienced, the role played by the entrepreneurial sector may increase, as more individuals can access the resources to go into business for themselves in an economic environment that allows the exploitation of opportunities. Although the annual “snapshot” of early-stage entrepreneurial activity consistently shows the shape of the fitted line over the years, it does not imply that all countries follow this pattern over time. This is because there are also other important national conditions that determine the rate of early-stage entrepreneurial activity. Also, the upward slope for high-income countries is only partially explored because the number of countries with very high per capita income is limited. There is no reason to expect that the upward slope will be as steep as the downward slope. The dispersion of TEA country estimates around the line of best fit in Figure 8 demonstrates that entrepreneurship rates are not just a function of differences in economic development (or welfare) but also of other factors. Entrepreneurship is not just an economic event; it is a socio-economic phenomenon. National societies and their economies are to a large extent shaped by historical developments. The rapidly expanding body of entrepreneurship studies as well as ten years of GEM research indicates that entrepreneurial activity rates may differ across countries for cultural, institutional, economic, and demographic reasons. For example, motivations, regulations, and enforcement of regulations for setting up a business can be vastly different across the globe. Geographical patterns can also be witnessed in Figure 8: it shows that countries with similar geographic backgrounds and traditions tend to cluster together. A group of EU-15 countries is situated close together at the lower end of early-stage entrepreneurial activity. Countries in Eastern Europe and Central Asia are mainly situated at the left hand side, below the fitted curve —even though over the years they appear to move toward the curve. People in these countries are not as much engaged in entrepreneurial activity as citizens of Latin American countries, the Caribbean, and Angola with similar levels of per capita GDP. Wealthier countries at the upper right-hand side are industrialized countries outside the EU—with Ireland 0% 5% 10% 15% 20% 25% 30% 0 10,000 20,000 30,000 40,000 50,000 60,000 GDP Per Capita, in Purchasing Power Parities (PPP) IN BO EG BA YU EC PE CO AO DO MK JM AR BR UY MX CL IR ZA RO TR RU HR LV HU KR GR SI IT FR IL JP BE DE DK NL ES FI UK IS IE US NO PrevalenceRateofEarly-StageEntrepreneurialActivity AO: Angola AR: Argentina BA: Bosnia & Herz. BE: Belgium BO: Bolivia BR: Brazil CL: Chile CO: Colombia DE: Germany DK: Denmark DO: Dominican Rep. EC: Ecuador EG: Egypt ES: Spain FI: Finland FR: France GR: Greece HR: Croatia HU: Hungary IE: Ireland IL: Israel IN: India IR: Iran IS: Iceland IT: Italy JM: Jamaica JP: Japan KR: Rep.of Korea LV: Latvia MK: Macedonia MX: Mexico NL: Netherlands NO: Norway PE: Peru RO: Romania RU: Russia SI: Slovenia TR: Turkey UK: United Kingdom US: United States UY: Uruguay YU: Serbia ZA: South Africa Source: GEM Adult Population Survey (APS) and IMF: World Economic Outlook Database (October 2008 edition) Figure 8 — Early-Stage Entrepreneurial Activity Rates and Per Capita GDP, 2008 Entrepreneurial Attitudes, Activity and Aspirations
  • 24.
    23 as a notableexception. Japan’s rate of early-stage entrepreneurial activity has, over the years, been consistently lower than the fitted curve, but has been increasing in recent years and is now very similar to the EU-average. As the 2007 GEM report demonstrated, institutional characteristics, demography, entrepreneurial culture, and the degree of economic welfare all shape a country’s entrepreneurial landscape. The factors of culture, demography, institutions, and economic welfare are linked. For example, national institutions reflect the national culture, since they are designed to formalize norms and values of the country. Also, countries with well-developed institutions generally exhibit higher degrees of welfare. Chapter 3 further explores the role of institutions in enhancing high impact entrepreneurship. Entrepreneurial Motivations Although most individuals are pulled into entrepreneurial activity because of opportunity recognition, others are pushed into entrepreneurship because they have no other means of making a living or because they fear becoming unemployed in the near future. For those who are pulled to entrepreneurship, two major drivers of opportunity entrepreneurship can be identified: those who are pulled primarily because they desire independence, and those who are primarily pulled to entrepreneurship because they want to increase their income as compared to, for instance, being an employee. The remaining share includes people who maintain that they have no other way of earning a living (necessity-motivated entrepreneurs) and people who became involved in entrepreneurial activity primarily to maintain their income20 . We should note that GEM may underestimate necessity entrepreneurship and overestimate opportunity entrepreneurship. The relevant question in the GEM survey forces respondents to choose between “no better options for work” and “exploit business opportunities”. That is, there is little room for choosing an option between these extremes and those who find themselves in between may opt for the latter option more frequently—even if they are in fact closer to the former. In 2007, the calculation method for opportunity-driven early-stage entrepreneurial activity (opportunity-TEA) was refined. It includes only those who are pulled to entrepreneurship by opportunity and because they desire independence or to increase their income, not those who are pushed to entrepreneurship out of necessity or those who sought only to maintain their income. Relative prevalence rates are shown in Figure 9 in black. The countries with high relative prevalence of improvement-driven opportunity entrepreneurship are primarily innovation-driven countries. In these countries, opportunities may be expected to be more abundant, and individuals may have more alternatives to make a living. Therefore, the trend of the degree of opportunity TEA in relation to GDP per capita gradually slopes upward in Figure 9. The green line describes the pattern of the degree of necessity entrepreneurship and is downward sloping21 . Thus, when countries progress in economic development, their rate of necessity entrepreneurship decreases. This is a clear example of economic development impacting the TEA rate and not the other way around. The different slopes of the two trend lines give support for the interpretation of the U-shaped pattern in Figure 8 as outlined above. An important implication is that when linking entrepreneurship to economic development, the phase of national economic development should be taken into account. Discontinuing Business Business discontinuation is an important feature of dynamic economies and entries and exits of businesses are closely correlated22 . Table 2 displays prevalence rates of people who discontinued, sold, or quit a business in the twelve months preceding the GEM survey. It can be seen that business discontinuance rates are relatively high in factor-driven economies (in Angola, for example, the reported rate is as much as 23%) and relatively low in innovation-driven economies. Among high-income countries, Norway, the United States, Republic of Korea, Iceland and Ireland have the highest rates of business discontinuation. This suggests that in some countries, there is a rapid turnover of business experiments. Many businesses that are discontinued are not failed businesses. In a study by Headd (Headd, 2003), owners of about one-third of all firms that closed said their firm was successful at closure. In 2008, GEM respondents who said they had discontinued a business in the last 12 months were asked if their business continued. It appears that, on average, about one-third of the businesses that were discontinued by a GEM respondent continued in another form or with different ownership. The respondents who discontinued a business in the last 12 months were also asked to state the most important reason for doing so. Figure 20 shows that the discontinuation of a business does not necessarily mean the business failed. Financial problems were cited as the reason for quitting the business by no more than 55% of all respondents; it was cited more often by respondents in the factor- and efficiency-driven economies (just over 50%) than innovation-driven countries (just over 40%). The business itself not being profitable was the most reported financial problem. Problems with raising finance were considerably lower in innovation-driven Entrepreneurial Attitudes, Activity and Aspirations
  • 25.
    24 R2= 0.41 R2= 0.55 0% 10% 20% 30% 40% 50% 60% 70% 80% 90% 100% 010,000 20,000 30,000 40,000 50,000 60,000 GDP Per Capita, in Purchasing Power Parities (PPP) Improvement-driven opportunity Necessity; no better options for work Linear trend Exponential trend Opportunity&NecessityMotivations,in%ofTEA Source: GEM Adult Population Survey (APS) ) and IMF: World Economic Outlook Database (October 2008 edition) Figure 9 — Necessity- and Improvement-Driven Opportunity Motivations as a Percentage of Early-Stage Entrepreneurial Activity, GEM 2008 Countries 0% 10% 20% 30% 40% 50% 60% 70% 80% 90% 100% Factor-Driven Economies Efficiency-Driven Economies Innovation-Driven Economies Incident Personal reasons Retirement Exit was planned in advance Other job or business opportunity Opportunity to sell Problems getting finance Business not profitable Figure 10 — Expressed Reasons Behind Discontinuing Businesses, by Age, GEM 2008 Source: GEM Adult Population Survey (APS) Entrepreneurial Attitudes, Activity and Aspirations
  • 26.
    25 countries where theEntrepreneurial Framework Condition “Entrepreneurial Finance” is generally more developed. “The opportunity to sell” and in particular “retirement,” were mentioned more often in innovation-driven countries as the most important reason to discontinue the business. Personal reasons caused around 20 – 25% of all discontinuations. Such reasons could include sickness, family, or business partner bereavement, divorce, the need to finance an event such as a wedding through sale of business assets rather than the business itself, or simply boredom. They were more prevalent in factor- and efficiency-driven countries. For many entrepreneurs who exit a business, it is not the end of their entrepreneurial career, but a new beginning. “Entrepreneurial recycling” (Mason and Harrison, 2006) manifests itself in two main ways. First, exited entrepreneurs may start again. This phenomenon is more than twice as prevalent in factor-driven and efficiency-driven economies than in innovation-driven economies. Seventeen percent of nascent entrepreneurs in both factor- driven economies and efficiency-driven economies had stopped running a business in the past year, compared with 8% of nascent entrepreneurs in innovation- driven economies. Second, exited entrepreneurs are more likely to invest in other people’s businesses than the rest of the population. Almost a fifth of exited entrepreneurs in all three country groups were recent informal investors: around four to five times that of other people in factor-driven and efficiency-driven economies and seven times that of other people in innovation-driven economies. Sector Distributions Figures 11 and 12 show the distribution of early- stage entrepreneurial activity and established business owner-managers by industry sector and phase of economic development. This distribution is different in each of the three major phases of economic development. Extraction businesses (farming, forestry, fishing, mining) are more prevalent in factor-driven economies, transforming businesses (manufacturing and construction) are more prevalent in efficiency- driven economies, and business services are more prevalent in innovation-driven economies. The reducing prevalence of consumer services across the three major phases is particularly noticeable. Such services tend to have relatively low resource needs and are often local in nature, particularly in countries with poorly developed transportation and commercial infrastructure. 0% 20% 40% 60% 80% 100% Factor-Driven Economies Efficiency-Driven Economies Innovation-Driven Economies Extractive Transforming Business Services Consumer oriented 0% 20% 40% 60% 80% 100% Extractive Transforming Business Services Consumer Oriented Factor-Driven Economies Efficiency-Driven Economies Innovation-Driven Economies Figure 11 — Sector Distribution Early-Stage Entrepreneurial Activity Figure 12 — Sector Distribution Established Business Source: GEM Adult Population Survey (APS) Entrepreneurial Attitudes, Activity and Aspirations
  • 27.
    26 Age and GenderStructure Figure 13 demonstrates that in each phase of economic development, prevalence rates of early-stage entrepreneurial activity differ across age groups. The shapes of the age distributions are very similar across country groups. The 25-34 years age group has the highest prevalence rate for every phase of economic development. Thereafter the prevalence rates decrease as age increases. This inverted U-shape pattern reflects the interaction between desire to start a business, which tends to reduce with age, and perceived skills, which tends to increase with age. Figure 14 displays the differences in female and male participation for each country in GEM 2008, ordered by major phase of economic development and female participation rate23 . The ratio of female to male participation varies considerably in each phase, reflecting different culture and customs regarding female participation in economic activity. In some factor-driven economies, for example Ecuador and Bolivia, female TEA rates are just below male TEA rates. In Angola, women are actually more likely to be involved in early-stage activity than to men. The situation is very different for Egypt, reflecting different culture and customs. For efficiency-driven economies, the gender gap in TEA rates is also quite low in many Latin American countries and Jamaica. In many, but not all, eastern European countries male TEA rates are substantially higher than female TEA rates. In innovation-driven countries, the general rule of thumb is that men are twice as likely to be involved in early-stage entrepreneurial activity than women. However, this gap is lower in Germany, Spain, Greece, and the United States. Trend in Early-Stage Entrepreneurial Activity 2001-2008 According to classic economic thinking, one would expect that when the business cycle is less favorable, fewer people will be involved in entrepreneurial activity because the expected returns are lower in comparison to times of economic prosperity. A counter argument is the so-called “refugee” hypothesis (Storey, 1991; Thurik et al.,, 2008). This hypothesis implies that when recessions loom, the number of people involved in TEA should become higher because employees either fear that their salaries are at risk, or they have already been let go and self-employment is the last resort. Figure 9 showed that necessity entrepreneurship played a relatively small role in innovation-driven countries in 2008; all high-income countries fall under the category of innovation-driven countries. In fact, a large share of TEA consists of people whose main driver for starting up a business is the fact that they can work independently. If one accepts that desire to be independent is the main driver, little difference over time can be expected for national TEA rates in innovation-driven countries. 0% 5% 10% 15% 20% 25% 30% Factor-Driven Economies Efficiency-Driven Economies Innovation-Driven Economies PercentageofAdultPopulationinAgeGroup 18-24 YRS 25-34 YRS 35-44 YRS 45-54 YRS 55-64 YRS Figure 13 — Early-Stage Entrepreneurial Activity for Separate Age Groups, 2008 Source: GEM Adult Population Survey (APS) Entrepreneurial Attitudes, Activity and Aspirations
  • 28.
    27 Factor-Driven Economies Efficiency-Driven Economies Innovation-DrivenEconomies Percentageof(Fe)MalePopulationbetween18-64Years RepublicofKorea Figure 14 — Early-Stage Entrepreneurial Activity Rates by Gender, 2008 Note: Countries are ordered along phase of economic development and female early-stage entrepreneurial activity rates Source: GEM Adult Population Survey (APS) Figure 15 displays the trend in average annual TEA rates from 2001 to 2008 for a subset of GEM efficiency- driven and innovation-driven countries. These are all countries that have been part of GEM since 2001 and have missed at most one year of data collection24 . Data is available for only six efficiency-driven economies: Argentina, Brazil, Chile, Croatia, Hungary and South Africa, so the results should be interpreted with some care. A total of 17 innovation-driven economies had sufficient data to be included. Figure 15 shows that the overall development over time of TEA in innovation-driven economies is quite stable. A slight and gradual rise is observed, from 5.7% in 2002 to 6.4% in 2008. The rates of necessity-driven TEA are shown in Figure 16 and have, on average, been very stable as well. For efficiency-driven economies, the pattern is more sensitive to the business cycle. Argentina, in particular, has shown a significant reaction to its national economic crisis; in 2001- 2003, the Argentinean rate of necessity early-stage entrepreneurs rose from 3.9 to 7.4 percent. It leveled off afterwards as the national economy recovered, but has been increasing again in recent years. It remains an unanswered question how much the current global economic crisis will impact necessity- driven TEA rates in efficiency-driven countries and innovation-driven countries. Even though the collapse of the internet bubble in 2001 did not seem to significantly affect overall TEA rates in innovation- driven countries, the current crisis clearly poses more threats to entrepreneurial activity and economic activity in general. Those looking to GEM data for guidance should bear in mind that the TEA rate covers several phases of the start-up process. It includes the pre-start-up phase—from the moment of actively starting a business—and the post-start-up phase, up to the moment a business is up and running for 42 months. In addition, most of the GEM 2008 surveys were conducted before the summer, when the true size of the crisis had not manifested itself yet. This means that the impact of the crisis on TEA rates has not yet become apparent. This will to a large extent also hold for the 2009 results; for example, individuals who started their business in 2007 will still be seen as early-stage entrepreneurs. However, it is expected that in due course the crisis will impact both the pre- start-up phase and the post-start-up phase of early- stage entrepreneurship in some ways (see Box 3). Entrepreneurial Attitudes, Activity and Aspirations
  • 29.
    28 Figure 15­— Early-StageEntrepreneurial Activity (TEA) Rates for 2001-2008, Averages over Efficiency-Driven Countries and Innovation-Driven Countries Innovation-Driven Economies Efficiency-Driven Economies Figure 16 — Necessity-Driven TEA Rates for 2001-2008, Averages over Efficiency-Driven Countries and Innovation-Driven Countries Note: Each data point is a simple country average for that year Source: GEM Adult Population Survey (APS) Innovation-Driven Economies Efficiency-Driven Economies Entrepreneurial Attitudes, Activity and Aspirations
  • 30.
    29 Box 3. HowDoes the Current Economic Crisis Affect Entrepreneurship? It is clear that the current economic crisis will have a substantial impact on entrepreneurship. The crisis started off in the financial sector but has—at the time this report went into print—already hit many other parts of the economy severely and production growth has come to a halt in many industries, in many countries. In this insert, we discuss some important implications of the crisis for entrepreneurship along the three identified components of attitudes, activity, and aspiration. The crisis may have different effects on different types and phases of entrepreneurship, resulting in both negative and positive trends in activity. Entrepreneurship is thought to be one of the mechanisms that helps turn around recessions by reallocating resources in such a way that promising new activities replace obsolete economic activities. However, this only works well if institutions, captured by the Entrepreneurial Framework Conditions (EFCs) in Figure 1, are conducive to this particular entrepreneurship mechanism and do not, for instance, artificially keep alive obsolete types of economic activity. Attitudes and Perceptions The GEM Adult Population Survey measures several perceptions toward entrepreneurship of a representative sample of adults. As a result of the recession, their perceived opportunities for starting a business will be lower because of (i) declining demand for products and thus declining expected returns, and (ii) lower supply of entrepreneurial finance caused by banks being more risk averse. This GEM publication already reports a decline in perceived opportunities for starting a business. Fear of failure is also higher because the implications of failure are higher: there are fewer alternatives available on the job market for those who will not be able to make their start-up venture sustainable. The issue of access to entrepreneurial finance is especially important for entrepreneurs who envision a sizeable new venture. The GEM 2006 Financing Report demonstrates that most business founders expect to finance their venture themselves, and for those who do seek external sources of funding, relatively small sums are involved (Bygrave and Quill, 2007). There may be a trade-off between accessibility of external funding and the cost of resources. In a recession, under-used assets will be released by failing businesses and recycled at a relatively low cost by other businesses, including new businesses. Also, the decision to become an entrepreneur is not only about expected financial returns versus risk, it is also about (self-perceived) abilities (Davidsson, 1991). Perceived skills are not likely to be affected by the crisis. The GEM perceived start-up skills and knowledge indicator—in contrast to perceived opportunities and fear of failure—was stable in 2008. National attitudes towards entrepreneurship in general are unlikely to change dramatically. Such attitudes include the degree to which people view entrepreneurship as a good career choice, and the degree to which the media pays attention to entrepreneurship. Activity Entrepreneurial activity comprises a static component (in GEM, this is represented by economic activity in “established” businesses) and a dynamic component that focuses on early- stage entrepreneurial activity, but it also includes new economic activities conducted by established businesses. Many established businesses in established sectors may see their turnover dropping due to a reduction in demand. Their profits may decrease and the resources for investments may decrease sharply. Expansion may be more difficult for cash-poor businesses. Factories will stop their production or might even close permanently. Established businesses operating in niche markets, or serving the lower-ends of the market, may be less harmed, and businesses that are cash-rich may find good opportunities for growth by acquisition as the value of business assets drops. The static component of entrepreneurship is important for preserving economic stability. Governments may seek to support the existing stock of businesses to some extent and help to preserve big and important companies, as well as help the small business sector to survive. In fact, many small businesses’ existence is dependent on the needs of larger businesses. However, companies that find themselves in trouble not only due to the financial crisis, but also because their products and services are essentially outdated, should perhaps not be supported unless they adjust their economic strategy. It is unavoidable that the number of discontinuations will increase. The challenge for governments is to keep alive those firms that still have good potential to do well in the longer run. While established businesses are important for preserving stability, early-stage entrepreneurship Entrepreneurial Attitudes, Activity and Aspirations
  • 31.
    30 is important forcreating dynamism in economic activity. Of course, pessimistic economic projections may lead to fewer people starting up a business. However, (pending) job losses may also result in more necessity-motivated entrepreneurship. In this particular recession, the first group of people to be affected in this way, those in the financial sector, exhibit high levels of human capital and financial capital relevant to entrepreneurship. Thus, the recession could trigger teams of bright individuals in the financial sector to start their own companies based on new but commonly shared principles. This would in effect be a bottom-up process of reshaping the financial sector to fit the needs of the current globalized economy. It is up to national authorities to recognize and support such new initiatives where they can. Most individuals who planned to start a business just before the crisis emerged are unlikely to change these intentions, especially if they are driven by the wish to work independently—which is the case with most entrepreneurs in innovation- driven countries. Figure 15 confirms that on average, there has been no significant change in TEA in innovation-driven countries over the past year. Many individuals involved in the pre- start-up phase, however, may have to rethink their products and strategies. It is often easier to adjust a business model in the pre-start-up phase than in the established stage. Banks and other investors, being less eager to lend money, will ensure a very thorough selection of new business activities. In conclusion, the dynamic component of entrepreneurship, in the form of not only early-stage entrepreneurial activity but also new business activities carried out by established businesses, may be important for the change in economic activity that is needed to overcome recessions. Aspirations Since many early-stage entrepreneurs lean on their own skills and knowledge when setting up their businesses, the impact of the crisis on growth expectations may be rather low. However, some new realism may be found among nascent entrepreneurs. In general, nascent entrepreneurs tend to overestimate their expected growth (Koellinger, 2008), but it has also been observed that those who expect to grow significantly will, after a few years, exhibit such expansion more often than low-expectation entrepreneurs (Davidsson and Wiklund, 1997). To some extent, the recession can stimulate innovative entrepreneurship. In economic booms, much money is spent on research and development, but the resulting innovations have often not yet been implemented in new business activities because the “old” products and processes are still generating good returns. Times of recession are often used to actually implement changes in businesses. This especially goes for established business activities because there is always much internal resistance to organizational changes. Innovations in recessions often pave the way for a new period of prosperity. For example, the first supermarket in America started up at the beginning of the Great Depression (Hirooka, 2003). Economic downturns trigger economic activity that is directed toward the future, rather than activity merely prolonging established routines. Entrepreneurial Attitudes, Activity and Aspirations
  • 32.
    31 Source: GEM AdultPopulation Survey (APS). Entrepreneurial Attitudes, Activity and Aspirations 2.3 Entrepreneurial Aspirations High-Growth Expectation Entrepreneurship Studies show that relatively few early-stage entrepreneurial firms contribute a disproportionate share of all new jobs created by new firms (Autio, 2007). In the following analysis, seven years of GEM data (years 2002-2008) are combined to take a closer look at how growth ambitions differ among early- stage entrepreneurs25 . The GEM method enables the categorization of early-stage start-up attempts according to their growth ambition. GEM asks all identified early-stage entrepreneurs how many employees they expect to have within five years’ time. Expectations of high-growth are rare among nascent and new entrepreneurs. Seventy percent of all start- up attempts expected any job creation. Only 8% of all start-up attempts expected to create 20 or more jobs. In the remainder of this section, we focus on the prevalence of new and nascent entrepreneurs who expect their business will employ at least 20 people in five years’ time. This is known as high-growth expectation early-stage entrepreneurial activity, or HEA. Figure 17 presents the HEA rate in GEM countries for which a sufficient sample size was available, grouped on the basis of per capita GDP. The vertical bars indicate the 95% confidence interval. If vertical bars overlap between two countries, the difference between those countries is not considered statistically significant. Figure 17 is broadly consistent with the notion that national HEA rates vary with economic context. The United States, New Zealand, Iceland, and Canada have higher levels of HEA than other innovation- driven economies. The HEA rate for these countries is well over 1%. In the United Kingdom, Switzerland, Germany, Slovenia, Norway, and Denmark, the HEA rate is between 0.5 and 0.8%. The lowest levels of HEA, at under 0.5%, occur in Belgium, France, Spain, Japan, Finland, and Greece. Within innovation-driven economies, the differences in prevalence rates of HEA are considerable, ranging from the United States and Iceland’s mean of over 1.5%, to approximately 0.3% in Belgium. HEA rates can vary even among broadly similar high- income countries. Among the large EU economies, the United Kingdom and Germany clearly exhibit higher levels of HEA than France and Spain. In the Benelux countries, the Dutch HEA rate is higher than the Belgian HEA rate. In Scandinavia, the level of HEA in Iceland is four times higher than that of Finland. Of the factor- and efficiency-driven countries, Colombia, China, Peru, and Chile exhibit the highest prevalence rates of high-expectation entre­pre­neur­ ship26 . In fact, the HEA rate for China is the highest of any GEM country, even though it is not statistically different from that of the United States, New Zealand, and Iceland. Most other middle- and low-income countries in the sample exhibit lower HEA rates than most high-income countries. It is notable that India’s HEA rate is less than one-fifth that of China. 0.0% 0.5% 1.0% 1.5% 2.0% 2.5% 3.0% 3.5% 4.0% India China Colombia Mexico Hungary SouthAfrica Brazil Croatia Thailand Latvia Turkey Argentina Chile Peru Belgium France Spain Japan Finland Greece Netherlands Sweden Italy Germany Slovenia Norway Switzerland Denmark UnitedKingdom Australia HongKong Ireland Singapore Canada NewZealand UnitedStates Iceland Factor- Driven Efficiency-Driven Innovation-Driven Percentage of adult population between 18-64 years PercentageofAdultPopulationbetween18-64Years Figure 17 — Prevalence Rates of High-Growth Expectation Early-Stage Entrepreneurship (HEA) in the Adult Population
  • 33.
    32 Efficiency-Driven Innovation-Driven PercentageofEarly-StageEntrepreneurs Factor- Driven Figure 18— Anatomy of High-Growth Expectation Early-Stage Entrepreneurship (HEA): Percentages in TEA Efficiency-Driven Innovation-Driven PercentageofEarly-StageEntrepreneurs Factor- Driven Figure 19 — Percentage of Early-Stage Entrepreneurial Activity with New Product-Market Combination, 2002-2008 Entrepreneurial Attitudes, Activity and Aspirations Source: GEM Adult Population Survey (APS) Source: GEM Adult Population Survey (APS)
  • 34.
    33 An analysis ofthe anatomy of entrepreneurial activity (defined as the relative prevalence of HEA entrepreneurs among all TEA entrepreneurs) reveals a slightly different pattern to that shown in Figure 17. Figure 18 shows that the countries with arguably the “healthiest” entrepreneurial anatomies, in this sample of nations, are Singapore, Latvia, Hong Kong, China and Turkey. In Singapore and Hong Kong, over 20% of nascent and new entrepreneurs aspire for rapid growth, the highest relative prevalence of HEA of all innovation-driven countries in the sample. Thus, in spite of their low overall rate of entrepreneurial activity, the contribution of entrepreneurs to these two densely populated economies may be quite significant27 . Greece and Spain stand out as countries where very few nascent and new entrepreneurs (around 5%) anticipate creating a business of significant size. Also France, Finland, Belgium, Australia, and Norway exhibit low levels of entrepreneurial growth ambition, with less than 10% of all start-up attempts expecting high-growth. Among factor-driven and efficiency-driven economies, China’s nascent and new entrepreneurs appear to be the most growth-oriented, with nearly 20% of them anticipating high-growth. Early-stage entrepreneurial activity in India and Mexico, on the other hand, is marked by low levels of growth expectation. In summary, innovation-driven economies typically have a higher relative prevalence of HEA than efficiency-driven and factor-driven economies. There are notable exceptions to this overall pattern, however. Some high-income countries have low relative prevalence of HEA and some middle- and low-income economies have high relative prevalence. Innovation- and Technology- Oriented Entrepreneurial Activity The essence of Schumpeter’s (1942) theory of creative destruction is that entrepreneurs distort the market equilibrium by introducing new product- market combinations or innovations. Sometimes they use new technologies to do so. By innovating, entrepreneurs drive less productive firms out of the market and advance the production frontier. Innovation is therefore an important means by which entrepreneurial firms contribute to economic growth. GEM assesses innovation in entrepreneurial businesses in a variety of ways. First, there are assessments of early-stage entrepreneurs and established business owner-managers concerning the novelty (or unfamiliarity) of their products or services relative to customers’ current experience. A second way that GEM assesses the innovativeness of entrepreneurial businesses is by measuring the degree of competition faced by the business, or whether the owner-manager perceives that many, few, or no other businesses offer similar products or services. Figure 19 evaluates GEM countries on an index that combines the two measures of innovation discussed above (product novelty and degree of competition), and Efficiency-Driven Innovation-Driven PercentageofEarly-StageEntrepreneurs Factor- Driven Figure 20 — Percentage of Early-Stage Entrepreneurial Activity Active in Technology Sector, 2002-2008 Entrepreneurial Attitudes, Activity and Aspirations Source: GEM Adult Population Survey (APS)
  • 35.
    34 Entrepreneurial Attitudes, Activityand Aspirations ranks countries in their country groups on the relative prevalence of innovative early-stage entrepreneurial activity. In essence, this index measures the percentage of early-stage entrepreneurs with novel product-market combinations. These entrepreneurs offer a product or service they believe is new to some or all customers and they also believe that there are few or no businesses offering the same product. In order to derive more precise estimates, we combined GEM data from 2002-2008. Looking at the country groups, it is apparent that in each group there are countries with high and low relative prevalence of innovative early-stage entrepreneurial activity. Interestingly, within the innovation-driven country group, the EU-countries emerge as having—on average—the highest relative prevalence. The figure shows, however, a wide variation in relative prevalence, even within the EU block. For example, Greece, Spain, and Italy have relatively few new product-market oriented entrepreneurs in early-stage entrepreneurial activity, whereas Denmark, Slovenia, France, and Ireland have high rates. Among other innovation-driven countries, it is striking that Asian countries have low relative prevalence. Turning to factor-driven and efficiency-driven countries, Figure 19 demonstrates that factor-driven countries tend to have lower rates of innovative early-stage entrepreneurial activity, and that some efficiency-driven countries appear to have the highest rates of all countries in the sample of GEM nations. In considering these patterns, it is important to bear in mind that this index works well if both the availability of new products and services and the strength of competition are evenly distributed throughout the world. This is a big assumption to make. By comparing within country groups, we control to some extent for differences in product availability and ferocity of competition. But it may be that some countries score high on this index merely because relatively few new products are available in them and competition is weak. Information on the business activities of nascent entrepreneurs and owner-managers is available in some detail from the GEM Adult Population Surveys28 . For example, the share of early-stage entrepreneurs who are active in technology sectors according to the OECD definition can be estimated29 . Figure 20 presents these percentages for the selected set of GEM 2008 countries. This figure confirms that countries in the innovation-driven stage have higher shares of technology-related early-stage entrepreneurial activity. Also here, some European countries tend to score high, although some can also be found at the lower end of the ranking of innovation-driven economies on this measure. Chile, Russia, and Latvia score high among efficiency-driven economies. India, Thailand, and Brazil have the lowest scores.
  • 36.
    35 Entrepreneurial Attitudes, Activityand Aspirations In 2007, the IIIP Innovation Confidence Index was developed by the Institute for Innovation & Information Productivity (IIIP) in association with GERA. This year, 26 GEM countries collected data on personal innovation confidence through the Adult Population Survey (APS), more than doubling the number of participating countries30 . The premise behind the Index is that innovative entrepreneurs need customers who are willing to buy new products and services and to try products and services that utilize new technology (Bhidé, 2006). Consumers who are receptive to such innovations tend to believe that they will improve their life. The index captures these three dimensions of innovation confidence: willingness to buy new products or services, willingness to try products or services that involve new technology, and the belief that new products or services will improve one’s life. Each dimension is measured using a five-point scale and then combined into an index at the country level31 . The final IC Index is the average percentage of the sample agreeing to each item. Figure 21 plots the results in rank order by country. It shows that innovation confidence varies widely, even among countries at similar stages of economic development, but tends to be lower in more developed economies. The IC Index correlates positively with early-stage entrepreneurial activity (r = .642, p = .000) and negatively with the mean age of the working age (18-64) population (r = -.603, p = .001). Seven countries participated in both 2007 and 2008, enabling an estimate of the stability of the index. The correlation of the 2007 and 2008 IC indices for all seven nations was .966 (p = .000). The index does not appear to be just measuring consumer confidence. AC Nielsen found that consumer confidence in April 2008 dropped by 10 to 20% of the point estimate for April 2007 in five of these seven countries. In one country, it remained unchanged and the other country was not measured. By contrast, the IC Index in six of these nations dropped by only around 2 to 4% of the 2007 value; only in the UK did it drop by as much as 9% of the previous year’s point estimate. The IC Indices and annual changes were uncorrelated with their respective GCC Indices and their annual changes. This suggests that the IC Index is stable and does not track consumer confidence. For more details on the IIIP Innovation Confidence Index, see www.iii-p.org. Where innovation and productivity meet... 0% 10% 20% 30% 40% 50% 60% 70% 80% China Iran Ecuador Angola India Colombia Countryaverage2008 Turkey Croatia Mexico Macedonia Chile Argentina Brazil SouthAfrica Jamaica Peru Uruguay Countryaverage2008 Japan Netherlands Finland RepublicofKorea Israel Slovenia UnitedKingdom Iceland Italy UnitedStates Ireland Spain UnitedArabEmirates Countryaverage2008 Efficiency-Driven Econnomies IC Index 2007 IC Index 2008 Country Average IC Index 2008 Innovation-Driven EconomiesFactor-Driven Economies Figure 21 — Innovation Confidence Index for 2007 and 2008 by Country and Country Group Box 4. The Institute for Innovation & Information Productivity
  • 37.
    36 The interdependence ofeconomic development and socio-political change is generally recognized by social scientists (Adelman and Morris, 1965). Joseph Schumpeter provided an early statement on this (Schumpeter, 1934). In recent years, economists have come to recognize what Leibenstein (1968) termed the “input-completing” and “gap-filling” capacities of potential entrepreneurial activity in innovation and growth, and the significant contribution of innovation and growth to prosperity and economic welfare (Acs and Armington, 2006; Schramm, 2006; Audretsch, 2007). Entrepreneurship is considered to be an important mechanism for economic development through employment, innovation, and welfare effects (Wennekers and Thurik, 1999; Baumol, 2002). The environment shaping the economy affects the dynamics of entrepreneurship within any given country. This environment is marked by interdependencies between economic development and institutions, which affect other characteristics such as quality of governance, access to capital, and other resources, and the perceptions of entrepreneurs. Institutions are critical determinants of economic behavior and economic transactions in general, and they can impose direct and indirect effects on both the supply and demand of entrepreneurs. Therefore, if one is interested in understanding entrepreneurship within or across countries, the broad nexus among entrepreneurship, economic development, and institutions is a critical area of inquiry. This nexus is especially important in helping understand why the relative contributions of entrepreneurship can vary significantly across countries and regions. Understanding this nexus is crucial to gain insight into what can work for economic development. This is for the following two reasons. First, the international economic development community has learned that a one-size-fits-all approach simply does not work (Easterly, 2001). Second, economic importance attributed to “the entrepreneur” and concurrent policy interest in his/her activities has exploded in recent years. This combination suggests that public policy needs to be informed by the dynamics of entrepreneurship and economic development, as well as relevant local institutional conditions and context- specific variables. In fact, one of the main goals of the GEM project is to measure differences in the level of entrepreneurial activity among countries. The purpose of this section is to outline the relationship between entrepreneurship and economic development and to sketch the beginnings of a Global Entrepreneurship Index to measure and understand this relationship. 3.1 Linking Institutions, Entrepreneurship, and Development For over a century, there has been a trend in economic activity, exhibited in virtually every developed industrialized country, away from small firms and toward larger organizations. It was, therefore, particularly striking when a series of studies identified that this trend had not only ceased sometime during the mid-1970s, but had actually begun to reverse (Blau, 1987; Evans and Leighton, 1989). More recent studies have confirmed this result for most developed countries in the 1970 and 1980s (Acs, Audretsch, and Evans, 1994). The empirical evidence clearly shows that firm size distribution in developed countries began to shift away from larger corporations and toward entrepreneurial activity. There are three reasons why entrepreneurial activity rises in countries in the innovation-driven phase of economic development: First, the innovation- driven phase is marked by decreases in the share of manufacturing in the economy. Virtually all industrialized market economies experienced a decline in manufacturing over the last thirty years. The business service sector expanded relative to manufacturing. Service firms are smaller on average than manufacturing firms, therefore, economy-wide, average firm size may decline. Moreover, service firms provide more opportunities for entrepreneurship. This is clearly the case in the United States, as well as in several EU countries, including Germany and Sweden. Second, technological change during the postwar period has been biased toward industries in which entrepreneurial activity is important (Jorgenson, 2001). Improvements in information technologies such as telecommunications may increase returns to entrepreneurship. Express mail services, photocopying services, personal computers, the internet, web services, and mobile phones services make it less expensive and less time consuming for geographically separate individuals to exchange information. Third, some theorists suggest that the easier it is to substitute capital for labor, the richer countries become, and the easier it is to become an entrepreneur (Aquilina, Klump, and Pietrobelli, 2006). Thus in countries in the early phases of economic development, the factor-driven and efficiency-driven phases, entrepreneurial activity would be negatively related to economic development since most people would be trying to move from subsistence self- employment to wage employment. In developed 3.0 Entrepreneurship, Institutions and Economic Development
  • 38.
    37 economies, we wouldexpect entrepreneurial activity to be positively related to economic development as people shift from wage work to entrepreneurial activity. These economies have entered the innovation- driven phase. This framework seems to imply that the relationship between entrepreneurial activity and economic development in the global economy may be U-shaped. Figure 8 shows that countries with very low levels of per capita income like Angola, Peru, and Ecuador all have high levels of early-stage entrepreneurial activity. As per capita income increases, entrepreneurial activity tends to decrease, but then levels off. At the bottom of the U are countries that appear to be transitioning from efficiency-driven economies to innovation-driven economies, including many Eastern European countries. Many innovation- driven countries such as Germany, France, Belgium and Italy have relatively low levels of entrepreneurial activity, but the richest, such as the US, Norway, and Iceland do tend to have higher levels. Research on the relationship between entrepreneurship and economic development has greatly expanded in the past decade. For example, in 2002, Carree and colleagues examined the relationship between economic development and business ownership for OECD countries and reaffirmed the existence of a U-shaped relationship. In 2005, Wennekers and colleagues were the first to regress GEM data for nascent entrepreneurship on the level of economic development. They also found support for the U-shaped relationship among countries at different stages of development. However, this line of research is not without limitations for the study of entrepreneurship and development. For example, it considers the quantity rather than the quality of entrepreneurship, and does not take into account institutional differences between countries in the same phase of economic development. It is hard to use this U-shape relationship for policy purposes, since it seems to suggest that less entrepreneurship is better for developing countries, while more is better for developed countries. In this chapter, we consider a composite measure of entrepreneurship that could be more useful in understanding entrepreneurship in both developed and developing countries. There are at least three composite measures that have been used to measure different aspects of economic development in the global economy. These are briefly reviewed in the following paragraphs. The Ease of Doing Business Index (EDBI) was created by the World Bank to measure the simplicity of regulations for businesses and the level of protection of property rights. It was designed to evaluate the effect of improving regulations on economic growth and to determine the optimal levels of business regulation. Fewer and simpler regulations generate higher rankings. The index is based on the study of expert opinion on laws and regulations and ranks nations based on the average of 10 sub-indices. The Index of Economic Freedom (IEF), created by the Wall Street Journal and The Heritage Foundation, uses 10 economic measures to evaluate degree of economic freedom. It is based on economic theories of liberty, with the objective of creating basic institutions that protect individual liberties in pursuit of economic interests for greater economic prosperity. Economic freedom is defined as “the absolute right of property ownership, fully realized freedom of movement for labor, capital, and goods, and an absolute absence of coercion or constraint of economic liberty beyond the extent necessary for citizens to protect and maintain liberty itself." The IEF, therefore, evaluates the economic environment or set of policies for their conduciveness to economic freedom, with absolute freedom the ideal target. The index uses statistics from the World Bank, the IMF, and the Economist Intelligence Unit to score countries. The Global Competitiveness Index (GCI) is an annual report by the World Economic Forum, covering about 131 countries. It "assesses the ability of countries to provide high levels of prosperity to their citizens,” which is dependent on how productively a country uses available resources (allocative efficiency). The GCI measures the set of institutions, policies, and factors that determine short- and medium-term sustainable levels of economic prosperity. The Index is based on theoretical and empirical research and made up of about 90 variables, two-thirds of which come from the Executive Opinion Survey and one-third from publicly available data sources such as the United Nations. It classifies the variables into nine pillars, each representing an area considered an important determinant of competitiveness. Together with GEM, these three projects represent a sort of “development diamond” focusing on freedom, competitiveness, cost of doing business, and entrepreneurship. There are natural connections between these facets of the development diamond. For example, as Carl J. Schramm has argued, “In the past two years…essays on entrepreneurship and labor freedom have evinced a growing recognition that developments on the micro level are centrally important to economic freedom,” (Schramm, 2008, p. 15). These facets are being measured with some regularity but there is not a well-developed overall measure of entrepreneurial adaptation. Much of the material required to develop the components of such a measure can be drawn from existing GEM data. Entrepreneurship, Institutions and Economic Development
  • 39.
    38 3.2 Recognizing theComplex Relationship between Entrepreneurship and Economic Development Using GEM Data In the 2004 Global Entrepreneurship Report, GEM started to pursue the idea of using the opportunity-necessity ratio as a composite indicator of entrepreneurial activity and economic development. Over the years, GEM researchers began to collect data on both opportunity entrepreneurship (starting a business to exploit a perceived business opportunity) and necessity entrepreneurship (starting a business because you were pushed into it). However, both measures show higher levels in developing countries than in developed countries. A clearly discernible trend occurs between the ratio of opportunity to necessity entrepreneurship and the per capita income of a country. Opportunity to necessity entrepreneurship ratio is a short-hand approach to describe the importance of the desirable, opportunity entrepreneurship relative to the necessity- induced entrepreneurship. Countries where more entrepreneurship is motivated more through the recognition of an economic opportunity than by necessity have higher levels of income. Complex measures such as this point the way to a more nuanced understanding of the relationship between entrepreneurship and economic development. Acs and Szerb (2008), Acs and Stenholm (2008), Ahmad and Hoffmann (2008), and Klapper, Amit, Guillén and Quesada (2007), among others, are developing a new family of global entrepreneurship indices. In this chapter, one such attempt is summarized: the Global Entrepreneurship Index (GEI) (Acs and Szerb, 2008). The GEI uses 32 variables (19 from GEM) to create 14 indicators and three sub indices that measure entrepreneurial activity, entrepreneurial aspiration and entrepreneurial attitudes for all 64 countries that have participated in the GEM project, including developed and developing countries across the years 2003-2008. The index takes a value from 0 to 1 and is plotted against income per capita based on purchasing power parity in U.S. dollars. Acs and Szerb propose a four level index building logic: variables and weights, indicators, sub-indices, and finally, the super-index. All three sub-indices contain several indicators; they can be interpreted as quasi-independent building blocks of this entrepreneurship index. The three sub-indices of attitudes, activity, and aspiration are combined to produce an entrepreneurship super-index, the Global Entrepreneurship Index. In this way, the design of GEI is consistent with the revised GEM model. Entrepreneurial attitudes are defined as the general attitude of a country population toward recognizing opportunities, knowing entrepreneurs personally, attaching high status to entrepreneurs, accepting the risk associated with business start-up, and possessing the skills required to create successful start-ups. Entrepreneurial attitudes are important because they express the general feelings of the population toward entrepreneurs and entrepreneurship. Those people that can recognize valuable business opportunities, who have the necessary skills to exploit these opportunities, who attach high status to entrepreneurs, can bear and handle start-up risk, and know entrepreneurs personally can be considered as the reserve army of future entrepreneurial activity. Moreover, these people can provide the cultural support, help, financial resources, and networking potential to those who are already entrepreneurs or want to start a business. Entrepreneurial activity is defined as the new venture start-up rate, adjusted for the churning effect of business closures, initiated by educated entrepreneurs and launched because of opportunity motivations. For the calculation of start-up rate, Acs and Szerb use the GEM TEA index that captures both independent and “corporate” start-ups. The churning effect measures the net change of businesses; it is based on the assumption that a high rate of discontinued businesses can be harmful. Quality differences in start-ups are quantified by education, i.e., having at least post-secondary education. Opportunity motivation is assumed to be a sign of better planning, sophisticated strategy, and higher-growth expectations as compared to necessity motivation. Entrepreneurial aspiration is defined as the effort of the entrepreneur to engage in introducing new products or new production processes, to open foreign markets, to plan to increase the number of employees substantially, and to be able to finance the business with formal and/or informal venture capital. Product and process innovation, internationalization and, high growth are considered to be the heart of entrepreneurship. The benchmark businesses are those that sell product/services considered to be new to at least some of the customers, use a technology less than five years old, and have sales from foreign markets. Also included in this sub-index is a finance variable that serves to capture the informal and formal venture capital potential vital for innovative start-ups and high-growth firms. The weakness of these sub-indices is that they capture a limited number of aspects of attitudes, activity, and aspiration. However, it is logical to expect that these missing variables have a high correlation with the chosen variables. Figure 22 shows that when these sub-indices are combined into one super-index, the picture of the relationship between entrepreneurship Entrepreneurship, Institutions and Economic Development
  • 40.
    39 and economic developmentturns out to be mildly S-shaped rather than U-shaped. Measures such as this can enable comparisons of developed and developing countries in the same analysis (Acs and Szerb, 2008). The GEI is broadly consistent with the three- phase model of factor-driven, efficiency-driven and innovation-driven economic development (Porter, et al., 2002). In the efficiency-driven stage, entrepreneurial activity is mildly increasing or relatively flat as necessity entrepreneurship is steadily reduced and innovation comes from the outside, since developing countries are far from the technological frontier (Acemoglu, Aghion, and Filibotti, 2006). This has been demonstrated in the case of Latin America by Acs and Amoros (2008). The role of foreign direct investment becomes critical in creating efficiency in the efficiency-driven countries. In innovation-driven countries, knowledge spills over to move a country to the technological frontier, enabling a further intensity of entrepreneurial activity (Baumol, et al., 2007). Figure 23 shows the relationship between the GEI Index, the Ease of Doing Business Index, the Index of Economic Freedom and the Global Competitiveness Index. The results in Figure 23 demonstrate that entrepreneurship complements and rounds out the other facets of the development diamond. In other words, while we do not imply causation entrepreneurship, ease of doing business, economic freedom and competitiveness are all correlated. Table 3 provides a correlation matrix of the GEI along with the other four major measures of institutions and development. The correlation 0.79 between the GEI and the Doing Business Index and 0.79 between the GEI and the Index of Economic Freedom suggests that the different facets of the “development diamond” move together with economic development. R 2 = 0.65 0 0.1 0.2 0.3 0.4 0.5 0.6 0.7 0.8 0 10,000 20,000 30,000 40,000 50,000 60,000 2007-2008 GDP PPP Average GlobalEntrepreneurshipIndex Figure 22 — The Global Entrepreneurship Index in Terms of GDP PPP Source: Acs and Szerb, 2008 Entrepreneurship, Institutions and Economic Development
  • 41.
    40 Figure 23 —Relationships between the Global Entrepreneurship Index and Economic Freedom Index, Doing Business Index and Global Competitiveness Index Entrepreneurship, Institutions and Economic Development Note: All coefficients are significant at p< 0.001 Source: Acs and Szerb, 2008 Table 3 — The Correlation Coefficients between GE INDEX and Other Major Indices 1 2 3 4 5 6 1 Global Entrepreneurship Index 1 0.82 0.79 0.79 0.89 0.79 2 Global Competitiveness Index 1 0.82 0.76 0.88 0.83 3 Doing Business Rank (normalized) 1 0.84 0.82 0.74 4 Index of Economic Freedom 1 0.85 0.74 5 Corruption Perception Index 1 0.86 6 Per Capita GDP in PPP 2008 World Bank 1 R2 = 0.68 0 0.1 0.2 0.3 0.4 0.5 0.6 0.7 0.8 0 0.2 0.4 0.6 0.8 1 Doing Business Index 2008 GlobalEntrepreneurshipIndex R2 = 0.64 0 0.1 0.2 0.3 0.4 0.5 0.6 0.7 0.8 40 60 80 100 Economic Freedom Index 2008 R2 = 0.69 0 0.1 0.2 0.3 0.4 0.5 0.6 0.7 0.8 3 3.5 4 4.5 5 5.5 6 Global Competitiveness Index 2008 To conclude, this section introduced a complex index of entrepreneurship, the Global Entrepreneurship Index that goes beyond the standard GEM measure of early-stage entrepreneurial activity. The relationship between the GEI and the wealth of nations is a mild S shape rather than U-shape. The GEI supports both the revised GEM model and the notion of a “development diamond” composed of four main facets: economic freedom, competitiveness, the cost of doing business, and entrepreneurship. These four facets are positively correlated and appear to move together as an economy develops, but associate in subtly different ways. These new insights could help policymakers understand how different aspects of policy can affect productive entrepreneurship through the major phases of economic development.
  • 42.
    41 From 10 yearsof GEM data on expert perceptions of the environment for entrepreneurship, one theme stands out. Consistently, GEM expert surveys in every country demonstrate a general perception that the provision of entrepreneurship education and training at school is inadequate. In most countries, experts also perceive that the provision of entrepreneurship education and training after school is poor. Yet several studies have demonstrated links between provision of entrepreneurship education and levels of entrepreneurial activity32 . This makes the topic of entrepreneurship education and training worthy of more detailed examination, and it was chosen by GEM national teams as a special topic subject for 2008. The GEM model identifies Entrepreneurship Education and Training as an entrepreneurial framework condition that affects levels of entrepreneurial attitudes, aspirations and activity, which then affect the level of new enterprises in the economy. This chapter uses new data collected in order to shed light on these relationships, while recognizing how country-level contexts can change how individuals calculate their allocation of effort into productive entrepreneurship rather than into other forms of economic activity. In 2008, 38 GEM countries collected additional data on entrepreneurship education and training through their Adult Population Survey33 . Every respondent was asked if they had had training in starting a business during or after school, and whether this was voluntary or compulsory. For after-school training, the nature of the training provider was also obtained. This provided national-level estimates of the quantity of entrepreneurship education and training in each nation, and of the relative importance of different types of provider. In addition, entrepreneurship experts in 31 countries were asked, as usual, to rate the provision of entrepreneurship education and training in their country. This year they were also asked to rate their country on two additional items: the extent to which startup entrepreneurs in their country needed help with their plans and the extent to which such help was available outside the education system. These ratings provided estimates of the quality of entrepreneurship education and training. Data was available for both quantity and quality of education/ training in 28 countries. Six of these were factor- driven nations, 13 were efficiency-driven nations, and nine were innovation-driven nations. 4.1 Participation in Entrepreneurship Education and Training Table 4 shows the percentage of working age adults who received training in starting a business in each country, by country groups. Overall levels of trained individuals varied greatly by country within country groups. For example, among factor-driven countries, the proportion of individuals who had received any training in starting a business, either in school or after school, varied from 40% in Colombia to 8% in Egypt. In efficiency-driven countries, it varied from 43% in Chile to 6% in Turkey. In innovation-driven countries, it varied from 48% in Finland to 13% in Israel. This range of training quantity across countries with similar levels of economic development is remarkable. In most countries, the proportion of individuals ever having had training in starting a business decreased with age. However, there was no significant decrease with age in Jamaica, Greece, Iceland and Israel, while in Japan there was a significant increase in training levels with age34 . In India, the Dominican Republic and Germany, training levels were highest among adults aged 25-34. Among 18-24 year olds, diffusion of training ranged from over 60% in Chile and Finland to under 10% in the Dominican Republic and Turkey. This gap was much smaller in older age groups. Among 55-64 year olds, the gap varied from 33% in Finland to 4% in Egypt. Women were significantly more likely to have received training in starting a business than men in only one country: Latvia. In all factor-driven countries, men were significantly more likely to have received training in starting a business than women. In only nine, or just over half of the efficiency-driven countries, men were significantly more likely to have received such training. However, 11 or 73% of innovation-driven countries had significantly higher levels of training among men than women. These differences by country groups may reflect differences in attendance rates at school and workforce participation rates among males and females at different levels of economic development, as well as differences in entrepreneurial attitudes, aspirations and activity rates. Table 5 shows the percentage of individuals who participated in training in starting a business after primary or secondary school, by type of training provider and whether the training was voluntary or compulsory. It shows that the most frequent source of training was self-directed learning, such as reading or observing or working in other people’s businesses, followed by voluntary formal education and by 4.0 Special Topic 2008: Entrepreneurship Education and Training
  • 43.
    42 Special Topic 2008:Entrepeneurship Education and Training voluntary training provided by a college or university but outside the formal education system. Other sources, such as business or trade organizations, government agencies, or employers, typically were used by 3% or less of individuals, although Colombia, Chile, Peru, and Finland stood out as having higher than usual usage of all sources. Exceptions to these general trends include Iran, where government agencies were the most frequent source of training after self-directed learning, Germany, where chambers of commerce was the most frequent source of training after self-directed learning, and Belgium, where compulsory training was more frequently reported than voluntary training for most types of training provider. Compulsory training was rarely reported by more than 1% of individuals. However, at least 5% of individuals in Chile, Latvia, Finland, and Slovenia reported participating in compulsory training in starting a business as part of their formal post-school education. A striking feature of the patterns in Table 5 is the contrast in training take-up between close neighbors. For example, Brazil has one of the lowest rates of training across all providers, while Chile has one of the highest. Slovenia and Croatia have relatively high rates while Hungary, Romania, and Serbia have relatively low rates. Those who had participated in training in starting a business after school were also asked if they had taken online training. Figure 24 shows the frequency of use of this form of training by country and country type. Chile stands out as having a very high rate of online training usage, with a fifth of the population of working age adults noting they have taken this form of training. This is probably due to integration of online training into online registration systems in Chile.
  • 44.
    43 Special Topic 2008:Entrepeneurship Education and Training Table 4 — Percentage of the Population Aged 18-64 that Received Voluntary or Compulsory Training in Starting a Business During or After School, by Type of Country School voluntaryi School compulsory School any After school voluntaryi After school compulsory After school any Any training Factor-Driven Economies Bolivia 8.2 2.4 10.6 10.3 3.9 14.2 19.1 Bosnia and Herzegovina 12.7 0.8 13.5 8.1 2.5 10.6 19.9 Colombia 19.2 4.0 23.2 20.7 8.7 29.4 40.0 Ecuador 16.1 4.3 20.4 8.3 7.3 15.6 27.2 Egypt 3.8 0.9 4.7 2.1 2.1 4.2 7.5 India 3.3 1.7 5.0 3.8 7.0 10.8 13.1 Iran 8.9 6.6 15.4 9.2 10.3 19.5 28.9 Country average 10.3 3.0 13.3 8.8 6.2 14.9 22.2 Efficiency-Driven Economies  Argentina 6.4 3.2 9.6 7.3 3.6 10.9 17.4 Brazil 4.5 0.8 5.3 1.6 5.0 6.6 9.4 Chile 16.8 8.5 25.3 18.9 13.8 32.7 42.5 Croatia 8.6 11.1 19.7 8.0 7.6 15.6 27.6 Dominican Republic 4.7 0.6 5.3 1.9 2.1 4.0 7.7 Hungary 2.8 14.2 17.1 1.4 8.6 10.0 24.4 Jamaica 6.8 9.2 16.0 2.9 6.4 9.3 21.0 Latvia 6.1 8.4 14.5 9.0 10.1 19.1 28.0 Macedonia 10.3 2.3 12.6 7.2 3.7 10.9 19.1 Mexico 5.8 3.6 9.5 3.6 5.9 9.5 15.5 Peru 11.5 2.9 14.4 12.2 12.5 24.7 29.6 Romania 3.3 2.2 5.5 2.8 1.8 4.6 8.0 Serbia 1.5 1.5 3.0 2.6 4.9 7.6 10.2 South Africa 6.6 2.7 9.3 3.8 5.2 9.0 13.8 Turkey 1.9 0.6 2.5 1.9 2.3 4.2 6.3 Uruguay 9.7 1.0 10.7 9.5 8.9 18.4 24.1 Country average 6.7 4.6 11.3 5.6 6.3 12.3 19.0 Innovation-Driven Economies Belgium 17.8 7.0 25.0 3.0 15.2 18.2 33.3 Denmark 2.4 7.1 9.5 2.1 11.9 14.0 22.0 Finland 10.1 7.8 17.9 19.6 20.8 40.4 47.9 France 5.3 4.9 10.2 5.9 6.6 12.5 18.1 Germany 10.3 2.0 12.3 8.4 4.7 13.2 21.0 Greece 5.0 1.2 6.1 6.4 6.5 12.9 17.0 Iceland 6.5 5.3 11.8 11.3 6.5 17.8 26.7 Ireland 8.1 5.8 14.0 9.9 7.6 17.5 26.1 Israel 4.1 1.7 5.8 4.5 4.1 8.6 12.8 Italy 6.0 4.2 10.2 5.3 3.7 9.1 16.5 Japan 2.8 2.1 4.9 10.1 5.6 15.7 17.4 Republic of Korea 2.7 3.2 5.9 3.8 5.4 9.2 13.6 Slovenia 13.0 11.3 24.3 10.3 12.3 22.6 35.7 Spain 9.5 3.0 12.5 7.9 6.8 14.7 21.9 United Kingdom 5.8 3.1 8.9 7.7 6.1 13.8 19.5 Country average 7.3 4.6 11.9 7.7 8.3 16.0 23.3 i: “Voluntary” includes those reporting voluntary training or a mix of voluntary and compulsory training.
  • 45.
    44 Type of trainingprovider College, formal College, informal Chamber of of commerce gov. agency Employer Other Self directed learning Voluntary or compulsory training V C V C V C V C V C V C Factor- Driven Economies Bolivia 9 1 5 1 3 0 2 0 3 0 4 0 11 Bosnia and Herzegovina 6 0 3 0 2 0 1 0 4 0 2 0 9 Colombia 20 2 10 1 6 0 5 0 4 1 7 0 24 Ecuador 10 2 4 1 4 0 2 0 3 1 3 0 10 Egypt 2 0 1 0 1 0 1 0 1 0 0 0 2 India 3 2 2 1 2 1 2 1 1 1 3 1 5 Iran 6 2 3 2 2 0 8 2 3 1 2 0 10 Country average 8 1 4 1 3 0 3 1 3 1 3 0 10 Efficiency-Driven Economies  Argentina 5 1 5 0 5 0 2 0 3 1 2 0 9 Brazil 1 1 1 0 4 0 1 0 1 1 0 0 2 Chile 13 5 10 1 8 1 10 1 9 3 15 0 26 Croatia 6 4 4 1 3 1 1 0 3 1 2 0 12 Dominican Republic 2 0 1 0 1 0 1 0 1 0 0 0 2 Hungary 3 1 2 0 1 0 1 0 1 0 0 0 1 Jamaica 4 3 2 1 1 0 2 1 1 1 0 0 4 Latvia 9 5 4 1 2 0 3 0 3 1 1 0 13 Macedonia 5 1 3 0 3 0 2 0 3 1 2 0 8 Mexico 2 0 1 0 2 0 1 0 2 0 0 0 4 Peru 13 2 11 1 6 0 5 1 6 2 6 1 16 Romania 2 0 1 0 1 0 0 0 1 0 1 0 3 Serbia 1 0 1 0 1 0 2 0 1 0 0 0 3 South Africa 4 2 3 1 2 1 2 1 2 1 2 1 6 Turkey 1 0 1 0 0 0 0 0 1 0 1 0 3 Uruguay 9 2 9 1 8 1 3 0 5 2 4 0 13 Country average 5 2 4 1 3 0 2 0 3 1 2 0 8 Innovation-Driven Economies Belgium 7 3 2 3 1 2 1 3 1 1 1 2 8 Denmark 3 4 1 1 2 1 0 1 0 0 2 1 8 Finland 16 14 9 1 5 0 6 1 3 1 6 1 30 France 4 2 1 1 5 1 4 1 1 0 4 0 8 Germany 6 1 2 0 7 1 3 1 4 1 3 0 10 Greece 8 1 1 0 4 0 2 0 2 1 1 0 8 Iceland 7 3 4 1 2 0 2 0 4 1 4 0 14 Ireland 6 3 6 1 4 0 6 1 3 2 1 0 14 Israel 4 1 3 1 3 0 3 0 2 0 1 0 6 Italy 6 1 2 0 3 0 1 0 2 1 1 0 6 Japan 6 2 7 1 2 0 2 0 3 1 2 0 12 Republic of Korea 4 1 3 1 2 0 1 0 1 0 1 0 4 Slovenia 9 6 8 1 5 1 4 1 4 2 3 0 15 Spain 9 1 7 1 6 0 5 1 4 1 7 0 10 United Kingdom 6 2 4 1 3 1 3 0 2 1 1 0 10 Country average 7 3 4 1 4 1 3 1 2 1 2 0 11 Table 5 — Percentage of the Population Aged 18-64 that Received Any Training in Starting a Business After School, by Type of Training Provideri Special Topic 2008: Entrepeneurship Education and Training
  • 46.
    45 4.2 Expert Opinionson Quality of Entrepreneurship Training We now turn to a different source of evidence on the state of entrepreneurship education and training in GEM nations. The GEM national expert survey contains several measures of quality of training provision, and these are shown in Table 6. It should be borne in mind that measures of quality refer to perceptions of current quality, whereas the quantity measures displayed in the previous tables refer to training activities in the past—up to 50 years ago in the case of older adults. For this reason, there may be no relationship between current quality of provision and current outcomes. Table 6 shows average ratings on a 1 to 5 scale by entrepreneurship experts in each country on the need for, availability of, and quality of entrepreneurship education and training by country and country group35 . Within each country group, average scores varied little from country to country. The average scores by country type suggest that start- up entrepreneurs’ need for external help reduces slightly as countries develop economically, and the availability of that help increases. The perceived level of help is insufficient in factor-driven countries and generally sufficient in innovation-driven countries. The perceived quality of school-level entrepreneurship education and training increases with economic development, but perceived quality of post-school entrepreneurship education does not, and is seen as inadequate in almost all innovation-driven countries. This suggests that experts in most innovation-driven countries see plenty of help available, but question its quality. Among the six factor-driven countries, there was a high correlation in average ratings by experts of the quality of school and after-school education and training in the country (r = .833, p = .039). There was also a high correlation between the perceived quality of school-based and after school-based entrepreneurship education in the country as rated by country experts and the proportion of individuals who had voluntarily taken after-school training in starting a business (r = .825, p = .043; r = .966, p = .002). There was a high correlation between the proportion of individuals who had taken compulsory school-based training and the proportion of individuals who had taken compulsory after-school-based training (r = .967, p = .002). Among males, the quality of post-school entrepreneurship education and training correlated significantly with levels of necessity-driven TEA (r = .880, p = .021) across countries with factor- driven economies. For females in these countries, it correlated significantly with opportunity perception (r = .875, p = .023) and start-up expectation over the next three years (r = .845, p = .034), and with two measures of high-growth expectation36 (r = .881, p = .02; r = .818, p = .047). Levels of voluntary after-school training for males and females produced similar high and significant correlations. National levels of opportunity perception among females correlated highly with overall TEA rates (r = .847, p = .033), necessity entrepreneurship (r = .963, p = .002), and entrepreneurship aimed at developing and expanding new markets (r = .879, p = .021). 0% 5% 10% 15% 20% 25% Egypt India Iran BosniaandHerz. Ecuador Bolivia Colombia Countryaverage Jamaica Hungary DominicanRep. Brazil Romania Turkey SouthAfrica Serbia Mexico Macedonia Argentina Croatia Uruguay Peru Latvia Chile Countryaverage Germany Israel Rep.ofKorea Belgium UnitedKingdom Denmark Ireland Greece Italy France Japan Finland Spain Iceland Slovenia Countryaverage Factor-Driven Economies Efficiency-Driven economies Innovation-Driven Economies PercentageofAdultsbetween18-64Years Figure 24 — Percentage of Adults Aged 18-64 Who Have Used Online Training in Starting a Business Special Topic 2008: Entrepeneurship Education and Training
  • 47.
    46 Special Topic 2008:Entrepeneurship Education and Training Entrepreneurs in general need help with their plans before startup Enough help available outside education system Quality of entrepreneurship education and training at school Quality of entrepreneurship education and training after school Factor-Driven Economies Bolivia 3.9 2.3 1.7 2.6 Bosnia and Herzegovina 4.1 2.7 1.9 2.4 Colombia 4.3 2.6 2.0 3.2 Ecuador 3.8 2.3 1.6 2.6 Egypt 4.3 2.1 1.3 1.8 Iran 4.5 3.2 1.7 2.4 Country averages 4.2 2.5 1.7 2.5 Efficiency-Driven Economies Argentina 4.2 2.8 2.1 3.4 Brazil 4.2 2.9 1.6 2.8 Chile 4.1 2.6 1.6 2.9 Croatia 4.2 3.1 2.2 2.8 Dominican Republic 4.2 2.3 1.7 3.2 Jamaica 3.8 2.7 2.0 2.8 Macedonia 4.3 3.1 2.2 2.8 Mexico 4.4 2.9 1.7 3.0 Peru 3.9 2.5 1.9 2.9 Russia n.a. n.a. 2.5 3.1 Serbia 3.9 3.1 2.0 2.9 South Africa 4.1 2.4 1.9 2.5 Turkey 4.1 2.6 1.9 2.7 Uruguay 3.9 3.2 2.1 2.9 Country average 4.2 2.8 2.1 3.4 Innovation-Driven Economies Denmark 4.3 3.1 2.4 2.4 Finland 4.0 3.7 2.5 2.8 Germany 3.6 3.9 1.9 2.7 Greece 3.7 2.4 1.8 2.5 Ireland 4.1 3.6 2.5 3.0 Italy 4.0 2.8 1.8 2.8 South Korea 3.9 3.6 2.4 2.9 Norway 4.3 2.9 2.6 2.9 Slovenia 3.8 3.5 2.4 3.0 Spain 4.3 3.3 1.9 2.9 United States 3.9 3.3 2.1 2.9 Country averages 4.0 3.3 2.2 2.8 Table 6 — Perceived Need for and Availability and Quality of Entrepreneurship Education and Training, by Country and Country Group (Average Ratings by Experts from 1 to 5)
  • 48.
    47 Special Topic 2008:Entrepeneurship Education and Training These patterns make sense; for factor-driven economies, where necessity entrepreneurship is an important source of economic self-sufficiency in the absence of other job opportunities, the quality and quantity of training available might be expected to increase the rate of entrepreneurship and the extent to which individuals can create new and growing markets where none previously existed. Perhaps after-school education has a more indirect effect, via increased opportunity perception, on females than on males in factor-driven countries. Multi-level, multivariate analysis would be required to analyze this in greater detail. Among the 13 efficiency-driven countries, there were no significant correlations between average expert assessments of the state of school-based entrepreneurship education and training in their country and country-level rates of entrepreneurial attitudes, aspirations or activity. Expert perceptions of post-school-based entrepreneurship education and training correlated mildly with overall entrepreneurial activity levels for both males and females (r = .606, p = .028; r = .555, p = .049), and with opportunity entrepreneurship for males (r = .563, p = .045) and necessity entrepreneurship for females (r = .703, p = .007). It also correlated with two measures of growth expectation among females (r = .680, p = .011; r = .730, p = .005). For both males and females, levels of after-school training in starting a business (whether voluntary or compulsory) correlated highly with voluntary training at school level (males: r = .920, p = .000; r = .813, p = .001; females: r = .893, r = .000; r = .822, p = .001) but not with compulsory training at school level, with the exception of females and after-school compulsory training (r = .677, p = .011). Voluntary school level training levels also correlated significantly with levels of entrepreneurship with profound market expansion intentions among males and females, (r = .774, p = .002; r= .713, p = .006), and correlated mildly with growth expectation entrepreneurship among females (r = .554, p = .049). Among the innovation-driven countries, there were significant correlations between the perceptions of experts on the quality of school-based entrepreneurship education and training and both opportunity perception rates (r = .727, p = .026) and fear of failure rates (r = -.880, p = .009). These correlations were similar for both males and females. Countries with more favorable expert perceptions of school-based entrepreneurship education and training also tended to have higher growth expectations among their startup entrepreneurs for the first of the two growth measures employed in this analysis (r = .803, p = .009). There was a high correlation between the proportion of individuals who took any school-based training in starting a business and those who took voluntary training after school (r = .824, p = .006). There was a high level of correlation between the proportion of individuals who took voluntary and compulsory training after school (r=.729, p=.026). There was also a significant correlation between the proportion of individuals who took any school-based and any after school-based training (r = .775, p = .014). In general, neither high levels of training nor high levels of positive entrepreneurial attitudes were significantly correlated with entrepreneurial activity rates across countries in this group. Exceptions included a significant correlation between male necessity TEA rates and skills perception rates (r = .885, p = .001), and a significant negative correlation between compulsory school-based training rates for females and female necessity entrepreneurship rates (r = -.711, p = .032). High rates of school- based training among females were associated with lower rates of future startup intention (r = -.785, p = 0.012). High rates of voluntary school and after- school training were associated with lower rates of entrepreneurial activity involving profound market expansion (r = -.709, p = .032; r = -.683, p = .042). These negative correlations may reflect the efforts of some governments in innovation-led countries with low entrepreneurship rates to provide entrepreneurship education as part of the school curriculum, in an effort to boost entrepreneurial activity. In summary, the quality and level of entrepreneurship education and training may have different impacts on attitudes, aspirations, and activity in countries at different stages of economic development. In factor-driven economies, the higher the quality and quantity of after-school training, the higher the levels of necessity entrepreneurship; this effect may be indirect in the case of females. This is because factor-driven economies provide few other opportunities for employment. In efficiency-driven economies, the more post-school training in starting a business, the higher the levels of market-expansion entrepreneurship, reflecting the growth of these economies. In innovation-driven economies, several negative correlations are apparent, possibly because governments with low levels of entrepreneurial activity have been investing more in entrepreneurship education and training in an effort to increase entrepreneurial activity.
  • 49.
    48 Special Topic 2008:Entrepeneurship Education and Training 4.3 Entrepreneurship Training and Entrepreneurial Attitudes, Aspirations, and Activity at the Individual Level In this final section, we consider the attitudes, aspirations, and activities of those who have and have not had training in starting a business. Table 7 shows the proportions of working age individuals who are not running or actively trying to start a business who 1) perceive good opportunities for starting a business in their local area and 2) perceive they have the skills, knowledge, and experience to start a business, by type of training received. By removing those who are currently nascent, new or established entrepreneurs, we remove the possibility of biased response. The patterns are different for each attitude, with a more mixed picture on opportunity perception than on skills perception. Each country seems to have its own unique pattern of relationships between training and attitudes, and the country group averages can be misleading. For example, in India and Greece, only compulsory training had a positive effect on opportunity perception, but it had a negative effect in Colombia. Only voluntary training had a positive effect in Romania and Finland. Both voluntary and compulsory training had similar and positive effects in Argentina, Hungary, Peru, Turkey, Germany, Japan, Spain, and Slovenia. In every country except Jamaica and the Dominican Republic, those who had taken either voluntary or compulsory training were more likely to have positive self-perceptions than those who had not taken training. In five of the nine innovation-driven countries (Italy and Spain excepted), those who had taken voluntary training were most likely to perceive they had the skills to start a business. In Italy and Spain, voluntary and compulsory training appeared to deliver similar and positive effects, but in Belgium and Israel, those with compulsory training were more likely to have positive skills self-perception. In most factor-driven and efficiency-driven countries, both voluntary and compulsory training produced similar elevated levels of skills perception. Overall, levels of skills perception were higher in factor-driven and efficiency-driven countries than in innovation-driven countries. Table 8 shows the proportion of individuals aged 18-64 who expected to start a business in the next three years and the proportion who were currently actively trying to start a business or were running a new business. In most countries, individuals who had taken either voluntary or compulsory training were significantly more likely to expect to start a business in the next three years, and generally those with voluntary training had the highest levels. In Bosnia, India, Iran, Hungary, Mexico, Romania, Turkey, France, and the United Kingdom, both voluntary and compulsory training produced similar elevated levels of start-up aspiration. In Chile and Japan, those with compulsory training were no more likely to expect to start a business in the next three years than those who had taken no training at all, while in Belgium, those who had taken compulsory training had the highest start-up aspirations. Neither voluntary nor compulsory training appeared to make any difference to aspiration in Jamaica or Greece. The relationship between type of training and early- stage entrepreneurial activity rates tended to track the relationship with aspiration, but at a much lower level. In some countries, including Bolivia, Iran, and Argentina, compulsory training had no effect on activity, although it did have a significant effect on aspiration. However, in Brazil, Turkey, Uruguay, Iceland, and Italy, compulsory training appeared to have a stronger effect and voluntary training appeared to have a weaker effect on activity than would have been predicted on the basis of aspiration. In conclusion, the relationship between training in starting a business and entrepreneurial attitudes, aspirations, and activity is generally positive, but complex. Some differences are apparent between country groups, in line with theory and the GEM model. However, each country seems to have a unique training footprint, which is a function of current and past quality and quantity of training, of demand, of regulations, and of employment choice. The “yield” from training, or the ratio of activity among the trained to that among the non-trained, varies from country to country, but on average the yield from compulsory training is slightly more than half that of voluntary training. Some countries, such as France and Latvia, appear to have yields from voluntary training as high as 5, while others have very low yields. Further analysis of this topic will be provided by a special report on entrepreneurship entrepreneurship education and training to be published later in 2009.
  • 50.
    49 Special Topic 2008:Entrepeneurship Education and Training Perceive good opportunities in the local area in the next six months Have skills, knowledge, experience to start a business Voluntary trainingi Compulsory training No training Voluntary trainingi Compulsory training No training Factor-Driven Economies Bolivia 52.5 47.6 46.0 81.5 63.2 64.5 Bosnia and Herzegovina 57.1 50.0 39.1 81.8 87.5 56.9 Colombia 64.7 42.1 52.6 73.4 53.8 45.3 Ecuador 38.3 47.2 35.4 81.9 77.2 60.7 Egypt 31.7 44.4 30.1 70.2 75.0 51.1 India 47.8 81.8 52.8 64.0 86.7 42.3 Iran 34.0 32.6 29.1 76.1 73.1 51.9 Country average 46.6 49.4 40.7 75.6 73.8 53.2 Efficiency-Driven Economies Argentina 56.6 50.0 39.0 80.8 62.5 48.4 Brazil 50.0 37.0 37.9 76.5 75.0 46.5 Chile 30.8 26.4 21.0 78.1 68.5 41.7 Croatia 61.3 52.1 35.6 77.4 75.2 48.1 Dominican Republic 56.5 53.8 51.2 85.2 78.6 69.0 Hungary 22.2 25.7 14.0 67.7 65.5 36.4 Jamaica 55.1 47.5 48.3 67.0 64.5 64.6 Latvia 41.9 28.6 16.0 70.9 46.8 13.3 Macedonia 50.6 46.2 43.1 74.1 71.4 47.8 Mexico 49.4 54.4 43.0 76.1 59.5 53.4 Peru 63.5 66.7 47.5 78.4 79.1 61.5 Romania 51.5 27.8 23.8 70.7 44.4 19.1 Serbia 73.7 56.4 50.9 84.2 85.7 57.2 South Africa 57.7 50.0 31.3 81.0 60.0 25.9 Turkey 53.8 50.0 33.4 71.9 76.2 42.8 Uruguay 45.2 61.0 48.7 78.5 75.0 53.2 Country average 51.2 45.9 36.5 76.2 68.0 45.6 Innovation-Driven Economies Belgium 12.2 18.9 12.0 41.6 66.4 25.0 Denmark 57.1 65.9 60.8 50.8 45.3 25.9 Finland 56.5 48.0 45.6 57.1 36.7 16.2 France 35.7 25.0 20.5 75.8 39.0 20.3 Germany 36.2 38.0 17.7 59.9 37.5 24.8 Greece 21.5 43.6 23.9 58.8 50.0 44.0 Iceland 38.7 37.2 32.3 76.5 61.4 36.5 Ireland 29.6 28.9 24.4 66.7 56.6 34.7 Israel 41.5 52.0 21.7 55.9 73.3 31.0 Italy 33.0 35.8 28.1 53.3 53.6 32.3 Japan 13.0 16.3 6.2 34.5 19.1 6.3 Republic of Korea 36.8 19.2 10.8 39.5 20.0 21.8 Slovenia 53.9 52.9 36.5 73.6 53.8 34.0 Spain 29.7 27.5 23.4 53.2 51.4 40.2 United Kingdom 39.8 31.1 26.2 74.2 59.6 40.0 Country average 35.7 36.0 26.0 58.1 48.2 28.9 i: “Voluntary” includes those reporting voluntary training or a mix of voluntary and compulsory training. Figures in bold denote statistically significant differences in proportions of attitude by type of training, p<.05. Table 7 — Percentage of the Population Aged 18-64 Who Are Not Running or Trying to Start a Business and Their Perceptions of Entrepreneurship, by Type of Business Start-Up Training Received and by Type of Country
  • 51.
    50 Expect to starta business in the next three years Actively trying to start or running a new business (TEA) Voluntary trainingi Compulsory training No training Voluntary trainingi Compulsory training No training Bolivia 65.7 50.7 38.0 39.1 25.0 28.3 Bosnia and Herzegovina 55.6 61.3 25.9 12.8 23.5 7.8 Colombia 81.2 72.5 58.4 34.6 26.2 19.0 Ecuador 60.2 52.3 36.6 25.7 23.0 14.3 Egypt 73.5 60.5 38.1 25.5 22.0 12.2 India 50.0 48.3 30.3 34.2 21.1 9.1 Iran 50.8 46.0 32.9 18.1 7.3 7.5 Country average 62.4 55.9 37.2 27.1 21.2 14.0 Argentina 43.2 30.3 19.7 26.1 12.1 15.5 Brazil 52.7 30.6 23.0 19.5 21.9 11.1 Chile 54.7 32.1 31.1 18.4 14.2 10.4 Croatia 22.4 15.3 9.5 16.7 10.7 5.3 Dominican Republic 71.6 58.5 34.6 41.1 34.1 18.7 Hungary 13.5 13.5 4.4 10.8 10.9 5.2 Jamaica 20.0 25.6 20.6 16.8 14.2 15.5 Latvia 33.9 17.8 4.3 20.1 8.7 3.5 Macedonia 68.3 61.1 40.8 22.9 19.0 12.7 Mexico 43.5 40.9 28.1 22.2 19.0 12.0 Peru 58.5 50.8 34.0 38.1 30.1 21.6 Romania 41.1 36.8 9.2 25.9 12.2 2.5 Serbia 67.1 42.2 31.6 17.6 13.6 6.7 South Africa 43.5 29.5 13.3 22.6 17.8 5.6 Turkey 41.5 42.2 22.6 10.5 21.2 5.3 Uruguay 41.2 27.7 18.7 16.7 19.8 10.0 Country average 44.8 34.7 21.6 21.6 17.5 10.1 Belgium 10.4 15.6 5.4 4.3 5.6 1.9 Denmark 17.1 10.4 6.2 7.1 5.0 4.1 Finland 15.5 8.9 3.7 14.1 6.4 4.4 France 31.9 30.4 11.7 20.3 12.0 3.3 Germany 17.8 10.3 3.6 8.0 8.0 2.6 Greece 18.2 19.5 16.1 10.0 16.7 9.2 Iceland 34.5 20.9 12.8 16.8 16.4 7.4 Ireland 23.2 14.5 6.5 16.4 9.1 5.5 Israel 42.6 34.1 15.1 16.9 13.1 5.1 Italy 22.8 12.6 7.4 10.6 8.6 3.6 Japan 24.9 6.4 5.8 15.6 7.8 3.9 Republic of Korea 44.8 25.5 20.6 14.3 11.3 9.5 Slovenia 24.2 12.2 5.6 13.5 7.0 4.2 Spain 12.3 8.7 6.7 9.8 7.3 6.5 United Kingdom 15.8 12.6 5.2 14.7 9.1 4.3 Country average 23.7 16.2 8.8 12.8 9.6 5.0 i: “Voluntary” includes those reporting voluntary training or a mix of voluntary and compulsory training. Figures in bold denote statistically significant differences in proportions of aspiration or activity by type of training, p<.05 Table 8 — Percentage of the Population Aged 18-64 Expecting to Start a Business in the Next Three Years or Engaged in Early-Stage Entrepreneurial Activity by Type of Training Received and by Type of Country Special Topic 2008: Entrepeneurship Education and Training
  • 52.
    51 References Acemoglu, D., P.Aghion and F.Zilibotti (2007). “Distance to Frontier, Selection and Economic Growth,” Journal of the European Economic Association, 4, 37-74. Acs, Z. J. (2006). “How is Entrepreneurship Good for Economic Growth?” Innovations 1(1), 97-107. Acs, Z. J., P. Arenius, M. Hay and M. Minniti (2005). Global Entrepreneurship Monitor 2004 Executive Report. London, U.K.: London Business School and Babson Park, MA: Babson College. Acs, Z. J., D. B.Audretsch, P. Braunerhjelm and B. Carlsson (2003). “The Missing Link: The Knowledge Filter and Endogenous Growth,” Center for Business and Policy Studies. Stockholm, Sweden. Acs, Z. J., D. B. Audretsch and D. Evans (1994). “Why Does the Self-Employment Rate Vary across Countries and over Time?” CEPR Discussion Paper No. 871. Center for Economic Policy Research. Acs, Z. J. and J. E. Amorós (2008). “Entrepreneurship and Competitiveness Dynamics in Latin America.” Small Business Economics, 31(3), 305-322. Acs, Z. J. and C. Armington (2006). Entrepreneurship, Geography and American Economic Growth. Cambridge: Cambridge University Press. Acs, Z. J. and P. Stenholm (2008). “A Global Entrepreneurship Index Using GEM Data.” Mimeo, School of Public Policy, George Mason University. Acs, Z. J. and L. Szerb (2008). “Gearing Up to Measure Entrepreneurship in a Global Economy,” Mimeo, Faculty of Business and Economics, University of Pecs. Acs, Z. J., N. S. Bosma and R. Sternberg (2008). “The Entrepreneurial Advantage of World Cities,” EIM Scales Paper H200810, Zoetermeer: EIM. Acs, Z. J., W. Parsons and S. Tracy (2008). “High Impact Firms: Gazelles Revisited.” Office of Advocacy, U.S. Small Business Administration. Adelman, I. and C. T. Morris (1965). “Factor Analysis of the Interrelationships between Social and Political Variables and Per Capita GNP,” Quarterly Journal of Economics 79, 555-78. Ahmad, N. and A. N. Hoffmann (2008). “A Framework for Addressing and Measuring Entrepreneurship,” OECD Statistics Working Paper, 2. Retrieved May 9, 2008, from: http://ssrn.com/ abstract=1090374. Aquilina, M., R. Klump and C. Pietrobelli (2006). “Factor Substitution, Average Firm Size and Economic Growth,” Small Business Economics, 26(3), 203-214. Audretsch, D. B. (2007). “Entrepreneurship Capital and Economic Growth,” Oxford Review of Economic Policy, 23(1), 63-78. Audretsch, D. B. (2007). The Entrepreneurial Society. Oxford: Oxford University Press. Autio, E. (2007). Global Entrepreneurship Monitor 2007 Global Report on High Growth Entrepreneurship. London, U.K.: London Business School and Babson Park, MA: Babson College. Baumol, W. J. (2002). The Free-market Innovation Machine: Analyzing the Growth Miracle of Capitalism. Princeton: Princeton University Press. Baumol, W. J., R. E. Litan and C. J. Schramm (2007). Good Capitalism, Bad Capitalism, and the Economics of Growth and Prosperity. New Haven and London: Yale University Press. Béchard, J.-P. and D. Grégoire (2005). “Entrepreneurship Education Research Revisited: The Case of Higher Education,” Academy of Management Learning and Education, 4(1), 22-49. Bergmann, H. and R. Sternberg (2007). “The Changing Face of Entrepreneurship in Germany,” Small Business Economics, 28 (2), 205-221. Blau, D. (1987). “A Time-Series Analysis of Self- Employment in the United States,” Journal of Political Economy, 95 (3), 445-67. Bosma, N. S. and V. A. J. M. Schutjens (2007). “Outlook on Europe: Patterns of Promising Entrepreneurial Activity in European Regions,” Tijdschrift voor Economische en Sociale Geografie, 98 (5), 675-686. Bosma, N. S. and V. A. J. M. Schutjens (2009). “Mapping Entrepreneurial Activity and Entrepreneurial Attitudes in European Regions,” International Journal of Entrepreneurship and Small Business 7 (2), forthcoming. Bosma, N. S., K. Jones, E. Autio and J. Levie (2008). Global Entrepreneurship Monitor 2007 Executive Report. London, U.K.: London Business School and Babson Park, MA: Babson College. Bygrave, W. D. with M. Quill (2007). Global Entrepreneurship Monitor 2006 Financing Report. London, U.K.: London Business School and Babson Park, MA: Babson College.
  • 53.
    52 References Cantillon, R. (1755).Essai sur la Nature du Commerce en Général (The Nature of Trade in General), Paris: Institut National D'études Démographiques. Carree, M. A. and R. A. Thurik (2003). “The Impact of Entrepreneurship on Economic Growth.” In: Z. J. Acs and D. B. Audretsch (Eds.). Handbook of Entrepreneurship Research. Boston: Kluwer Academic Publishers, 437-471. Carree, M. A., A. J. van Stel, A. R. Thurik and A. R .M. Wennekers (2002). “Economic Development and Business Ownership: An Analysis Using Data of 23 OECD Countries in the Period 1976-1996,” Small Business Economics, 19, 271-290. Davidsson, P. (1991). “Continued Entrepreneurship – Ability, Need, and Opportunity as Determinants of Small Firm Growth,” Journal of Business Venturing, 6 (6), 405-426. Davidsson, P. (2004). Researching Entrepreneurship. New York: Springer. DeTienne, D. and G. Chandler (2004). “Opportunity Identification and its Role in the Entrepreneurial Classroom: A Pedagogical Approach and Empirical Test,” Academy of Management Learning and Education, 3(3), 242-257. Easterly, W. (2001). “The Lost Decade: Developing Countries’ Stagnation in Spite of Policy Reform 1980-1998,” Journal of Economic Growth, 6, 135. Evans, D. and L. S. Leighton (1989). “The Determinants of Changes in U.S. Self-Employment, 1968-1987,” Small Business Economics 1(2), 111-119. Fiet, J. O. and P. C. Patel (2008). “Entrepreneurial Discovery as Sustained, Systematic Search,” Small Business Economics, 30, 215-229. Gartner, W. B. (1985). “A Framework for Describing and Classifying the Phenomenon of New Venture Creation,” Academy of Management Review, 10(4), 696-706. Godin, K., J. Clemens, and N. Veldhuis (2008). “Measuring Entrepreneurship: Conceptual Frameworks and Empirical Indicators,” Studies in Entrepreneurship and Markets, 7. Fraser Institute. Gries, T. and W. Naude (2008). “Entrepreneurship and Structural Economic Transformation,” UNU-Wider Research Papers. Helsinki. Headd, B. (2003). “Redefining Business Success: Distinguishing Between Closure and Failure,” Small Business Economics 21, 51-61. Henrekson, M. (2005). “Entrepreneurship: A Weak Link in the Welfare State?” Industrial and Corporate Change, 14(3), 437-467. Hills, G. E. and R. P. Singh (2004). “Opportunity Recognition.” In: Gartner, W. B., K G. Shaver, N. M. Carter and P. D. Reynolds (Eds.), Handbook of Entrepreneurial Dynamics; The Process of Business Creation, London: Sage Publications. Hirooka, M. (2003). “Nonlinear Dynamism of Innovation and Business Cycles,” Journal of Evolutionary Economics, 13, 549–576. Holmes, K. R., E. J. Feulner and M. A. O’Grady (2008). 2008 Index of Economic Freedom. Washington, D.C.: The Heritage Foundation and New York: Wall Street Journal. Honig, B. (2004). “Entrepreneurship Education: Toward a Model of Contingency-Based Business Planning,” Academy of Management Learning and Education, 3(3), 258-273. Jorgenson, D. W. (2001). “Information Technology and the U.S. Economy,” American Economic Review, 91 (1), 1-32. Kihlstrom, R. E. and J J. Laffont (1979). “A General Equilibrium Entrepreneurial Theory of Firm Formation Based on Risk Aversion,” Journal of Political Economy, 87, 719–49. Kirzner, I. (1973). Competition and Entrepreneurship. Chicago: University of Chicago Press. Koellinger, P. (2008). “Why are Some Entrepreneurs More Innovative than Others?” Small Business Economics, 31, 21-37. Kuznets, S. (1966). Modern Economic Growth. New Haven: Yale University Press. Leibenstein, H. (1968). “Entrepreneurship and Development,” American Economic Review, 58 (2), 72-83. Levie, J. and E. Autio (2008). “A Theoretical Grounding and Test of the GEM Model,” Small Business Economics, 31(3), 235-263. Lewis, W. A. (1954). “Economic Development with Unlimited Supplies of Labour,” The Manchester School, 28(2), 139-191. Lucas, R. E. Jr. (1978). “On the Size Distribution of Business Firms,” Bell Journal of Economics, 9, 508-523.
  • 54.
    53 References Marshall, A. (1890).Principles of Economics. London: Macmillan and Co. Mason, C. and R. Harrison (2006). “After the Exit: Acquisitions, Entrepreneurial Recycling and Regional Economic Development,” Regional Policy, 40(1), 55-73. OECD (2003). Science, Technology and Industry Scoreboard. Paris: OECD. Parker, S. C. (2004). The Economics of Self- employment and Entrepreneurship. Cambridge: Cambridge University Press. Peterman, N. and J. Kennedy (2003). “Enterprise Education: Influencing Students' Perceptions of Entrepreneurship,” Entrepreneurship Theory and Practice, 28, 129-144. Porter, M. E., J. J. Sachs, and J. McArthur (2002). “Executive Summary: Competitiveness and Stages of Economic Development.” In: Porter, M, J. Sachs, P.K. Cornelius, J.W. McArthur, and K. Schwab (Eds), The Global Competitiveness Report 2001-2002, New York: Oxford University Press, 16-25. Porter, M. E. and K. Schwab (2008). The Global Competitiveness Report 2008-2009. Geneva, Switzerland: World Economic Forum. Reynolds, P. D., N. S. Bosma, E. Autio, S. Hunt, N. De Bono, I. Servais, P. Lopez-Garcia and N. Chin (2005). “Global Entrepreneurship Monitor: Data Collection Design and Implementation, 1998-2003,” Small Business Economics, 24(3), 205-231. Robinson, C., B. O’Leary, and A. Rincon (2006). Business Start-Ups, Closures and Economic Churn: A Review of the Literature. Final report prepared for the Small Business Service, 23 August. London: National Institute of Economic and Social Research. Schramm, C. J. (2006). The Entrepreneurial Imperative. New York: Harper Collins. Schramm, C. J. (2008). “Economic Fluidity: A Crucial Dimension of Economic Freedom.” In: Holmes, K. R., E. J. Feulner, and M. A. O’Grady (Eds.), 2008 Index of Economic Freedom. Washington, D.C.: The Heritage Foundation and New York: Wall Street Journal, 15-22. Schumpeter, J. A. (1934). The Theory of Economic Development. Cambridge MA: Harvard University Press. Schumpeter, J. A. (1942). Capitalism, Socialism and Democracy, New York: Harper and Row. Shane, S. and S. Venkataraman (2000). “The Promise of Entrepreneurship as a Field of Research,” Academy of Management Review, 25, 217-226. Shane, S. (2003). A General Theory of Entrepreneurship: The Individual-Opportunity Nexus. Aldershot, UK: Edward Elgar. Storey, D. J. (1991). “The Birth of New Firms – does unemployment matter? A Review of the evidence,” Small Business Economics, 3(3), 167-178. Thurik, A.R., M.A. Carree, A. van Stel and D.B. Audretsch (2008). “Does Self-Employment Reduce Unemployment?” Journal of Business Venturing, 23(6), 673-686. Wennekers, A.R.M. and A.R. Thurik (1999). “Linking Entrepreneurship and Economic Growth,” Small Business Economics, 13(1), 27-55. Wennekers, A.R.M., A. van Stel, A.R. Thurik and P.D. Reynolds. (2005). “Nascent entrepreneurship and the level of economic development,” Small Business Economics, 24(3), 293-309. Wiklund, J., P. Davidsson and F. Delmar (2003). “What Do They Think and Feel About Growth? An Expectancy-Value Approach to Small Business Managers’ Attitudes Towards Growth,” Entrepreneurship Theory and Practice, 27 (3), 247-266.
  • 55.
    54 GEM National Teams2008 Team Institution National Team Members Financial Sponsors APS Vendor Angola Universidade Católica de Angola (UCAN) Sociedade Portuguesa de Inovação (SPI) Alves da Rocha Salim Abdul Valimamade Augusto Medina Sara Medina Douglas Thompson Anders Hyttel João Medina Banco de Fomento S.A. Centro de Pesquisas, Sondagens e Estudos de Opinião (CENSOP - Dr. Bernardo Vieira) Argentina Center for Entrepreneurship IAE Management and Business School Universidad Austral Silvia Torres Carbonell Leticia Arcucci Hector Rocha Juan Martin Rodriguez Center for Entrepreneurship, IAE Management and Business School, Universidad Austral Banco Santander Rio Subsecretaría de Desarrollo Económico, Ministerio de Desarrollo Económico - Gobierno de la Ciudad de Buenos Aires Prosperar, Agencia Nacional de Desarrollo de Inversiones MORI Argentina Belgium Vlerick Leuven Gent Management School Hans Crijns Miguel Meuleman Olivier Tilleuil Flemisch Government, Steunpunt Ondernemen en Internationaal Ondernemen (STOIO) TNS Dimarso Bolivia Maestrias para el Desarrollo -Universidad Catolica Boliviana Marco Antonio Fernandez Gover Barja Mario Avila Fundación Nuevo Norte USAID/Bolivia Fundacion Avina Red Bolivia Emprendedora Fundación para la Producción Cima Group/ Synovate Bosnia and Herzegovina Entrepreneurship Development Center from Tuzla in partnership with Tuzla University Bahrija Umihanic Admir Nukovic Boris Curkovic Esmir Spahic Rasim Tulumovic Senad Fazlovic Sladjana Simic Entrepreneurship Development Center Tuzla Government of Tuzla Canton City of Tuzla Government of Brcko District of Bosnia and Herzegovina PULS BH d.o.o. Sarajevo Brazil IBQP - Instituto Brasileiro da Qualidade e Produtividade Simara Maria S. S. Greco Paulo Alberto Bastos Junior Joana Paula Machado Rodrigo G. M. Silvestre Carlos Artur Krüger Passos Júlio César Felix Marcos Mueller Schlemm Instituto Brasileiro da Qualidade e Produtividade – IBQP Serviço Brasileiro de Apoio às Micro e Pequenas Empresas – SEBRAE Serviço Nacional de Aprendizagem Industrial - SENAI / PR Serviço Social da Indústria - SESI / PR Universidade Positivo Bonilha Comunicação e Marketing S/C Ltda.
  • 56.
    55 Team Institution National Team Members FinancialSponsors APS Vendor Chile Regional Teams: Antofagasta Coquimbo Valparaíso Bío-Bío Araucanía Universidad del Desarrollo Universidad Adolfo Ibáñez Univ. Católica del Norte Univ. Católica del Norte Univ. Técnica Federico Santa María Univ. del Desarrollo Univ. de la Frontera -INCUBATEC José Ernesto Amorós Massiel Guerra Miguel Carrillo Bárbara Harris Gianni Romaní Miguel Atienza Karla Soria Cristóbal Fernández Robin Juan Tapia Gertosio Jorge Cea Valencia Olga Pizarro Stiepovic José Ernesto Amorós Carlos Isaacs Bornand Claudina Uribe Bórquez Franklin Valdebenito Godoy Gerardo Lagos Wietsenfeld Pedro Araneda Reyes InnovaChile de CORFO Universidad Católica del Norte, DGIP. Gobierno Regional, Agencia Regional Desarrollo Productivo. Universidad Católica del Norte, DGIP. Gobierno Regional, Agencia Regional Desarrollo Productivo. Departamento de Industrias Y Centro de Ingeniería de Mercados, CIMER, de la Univ. Técnica Federico Santa María El Mercurio de Valparaíso UDD-Facultad de Economía y Negocios. Dirección de Innovación y Transferencia Tecnológica de la Universidad de La Frontera Opina S.A. Colombia Universidad de los Andes Universidad ICESI Universidad del Norte Pontificia Universidad Javeriana Cali Rafael Vesga Lina Devis Rodrigo Varela Luis Miguel Alvarez Liyis Gomez Fernando Pereira Raúl Quiroga Alberto Arias SENA Comfenalco Valle Centro Nacional de Consultoría Croatia J.J. Strossmayer University in Osijek Slavica Singer Natasa Sarlija Sanja Pfeifer Djula Borozan Suncica Oberman Peterka Ministry of Economy, Labour and Entrepreneurship SME Policy Centre – CEPOR, Zagreb J.J. Strossmayer University in Osijek – Faculty of Economics, Osijek Puls, d.o.o., Zagreb Denmark University of Southern Denmark Thomas Schøtt Torben Bager Hannes Ottossen Kim Klyver Kent Wickstrøm Jensen Majbritt Rostgaard Evald Suna Sørensen International Danish Entrepreneurship Academy (IDEA) Institute for Business Cycle Analysis Dominican Republic Pontificia Universidad Católica Madre y Maestra (PUCMM) Guillermo van der Linde Cecilia Pérez Maribel Justo Alina Bello José Rafael Pérez Tania Canaán Grupo Vicini International Financial Centre of the Americas Consejo Nacional de Competitividad Gallup República Dominicana Ecuador Escuela Superior Politécnica del Litoral (ESPOL)- ESPAE Graduate School of Management Virginia Lasio Ma. Elizabeth Arteaga Guido Caicedo Edgar Izquierdo Escuela Superior Politécnica del Litoral (ESPOL) Survey Data GEM National Teams 2008
  • 57.
    56 Team Institution National Team Members FinancialSponsors APS Vendor Egypt The British University in Egypt (BUE) Egyptian Junior Business Association (EJB) David Kirby Nagwa Ibrahim Hala Hattab Amr Gohar Ahmed Nafie Industrial Modernization Center, Ministry of Trade & Industry ACNielsen ACNielsen Finland Turku School of Economics Anne Kovalainen Tommi Pukkinen Jarna Heinonen Pekka Stenholm Pia Arenius Erkko Autio Ministry of Employment and the Economy Ministry of Education The European Union under the European Regional Development Fund and the European Social Fund Turku School of Economics Taloustutkimus Oy France EMLYON Business School Olivier Torres Danielle Rousson Caisse des Depots CSA Germany University of Hannover Institute of Labour Market Research, Nuremberg Rolf Sternberg Udo Brixy Christian Hundt Heiko Stüber Institute of Labour Market Research, Nuremberg INFAS Greece Foundation for Economic and Industrial Research (IOBE) Stavros Ioannides Takis Politis Aggelos Tsakanikas Evaggelia Valavanioti Hellenic Bank Association Datapower SA Hungary University of Pécs, Faculty of Business and Economics László Szerb Zoltan J. Acs Attila Varga József Ulbert Siri Terjesen Péter Szirmai Gábor Kerékgyártó Ministry for National Development and Economy University of Pécs, Faculty of Business and Economics Ohio University (USA) Szocio-Gráf Piac-és Közvélemény kutató Intézet Iceland RU Centre for Research on Innovation and Entrepreneurship (Reykjavik University) Rögnvaldur Sæmundsson Silja Björk Baldursdóttir Reykjavik University Prime Minister’s Office Capacent Gallup India Pearl School of Business, Gurgaon Ashutosh Bhupatkar I. M. Pandey Janakiraman Moorthy Gour C. Saha Pearl School of Business, Gurgaon Metric Consultancy Iran University of Tehran M .Ahamadpour Daryani Abbas Bazargan Nezameddin Faghih Caro Lucas A. A. Moosavi-Movahedi A. Kord Naeij S.Mostafa Razavi Leyla Sarafraz Jahangir Yadollahi Farsi Mohammad Reza Zali Ministry of Labour and Social Affairs Dr. Mohammad Reza Zali GEM National Teams 2008
  • 58.
    57 GEM National Teams2008 Team Institution National Team Members Financial Sponsors APS Vendor Ireland Dublin City University Paula Fitzsimons Colm O’Gorman Enterprise Ireland Forfás Allied Irish Bank IFF Israel The Ira Center of Business, Technology & Society, Ben Gurion University of the Negev Ehud Menipaz Yoash Avrahami Miri Lerner The Ira Center of Business, Technology & Society, Ben Gurion University of the Negev The Brandman Institute Italy Bocconi University Guido Corbetta Alexandra Dawson Ernst & Young Atradius Credit Insurance Target Research Jamaica University of Technology, Jamaica Vanetta Skeete Claudette Williams-Myers Garth Kiddoe Girjanauth Boodraj Joan Lawla Louise Marcelle-Peart Faculty of Business and Management, University of Technology, Jamaica Koci Market Research and Data Mining Services Japan Keio University Musashi University Shobi University Takehiko Isobe Noriyuki Takahashi Tsuneo Yahagi Venture Enterprise Center Ministry of Economy, Trade and Industry Social Survey Research Information Co.,Ltd (SSRI) Latvia The TeliaSonera Institute at the Stockholm School of Economics in Riga Olga Rastrigina Vyacheslav Dombrovsky TeliaSonera AB SKDS Macedonia University “Ss. Cyril and Methodius” – Business Start-Up Centre Macedonian Enterprise Development Foundation (MEDF) Radmil Polenakovik Aleksandar Kurciev Bojan Jovanoski Tetjana Lazarevska Gligor Mihailovski Lazar Nedanoski Macedonian Enterprise Development Foundation (MEDF) Austrian Development Agency Macedonian Agency for Promotion of Entrepreneurship GfK Skopje Mexico Tecnológico de Monterrey Alejandro González Berenice Ramírez César Godínez Tecnológico de Monterrey Alduncin Y Asosiados, SA De CV Netherlands EIM Business and Policy Research Jolanda Hessels Sander Wennekers Chantal Hartog André van Stel Niels Bosma Roy Thurik Ingrid Verheul Dutch Ministry of Economic Affairs Stratus marktonderzoek bv Norway Bodo Graduate School of Business Lars Kolvereid Erlend Bullvaag Bjorn Willy Aamo Erik Pedersen Ministry of Trade and Industry Innovation Norway The Knowledge Fund, at Bodo Knowledge Park ltd. TNS Gallup Peru Centro de Desarrollo Emprendedor, Universidad ESAN Jaime Serida Nishimura Liliana Uehara-Uehara Jessica Alzamora Ruiz Universidad ESAN Imasen Republic of Korea Jinju National University Sung-Sik Bahn Yong-Sam Lee Sanggu Seo Hyunsuk Lee Donna Kelley Small and Medium Business Administration (SMBA) Hankook Research Co.
  • 59.
    58 Team Institution National Team Members FinancialSponsors APS Vendor Romania Faculty of Economics and Business Administration, Babes-Bolyai University Stefan Pete Lehel-Zoltán Györfy Ágnes Nagy Dumitru Matis László Szerb Liviu Ilies Comsa Mircea Annamária Benyovszki Tünde Petra Petru Ana Eugenia Matis Mustatã Rãzvan Nagy Zsuzsánna-Ágnes Pro Oeconomica Association Babes-Bolyai University, Faculty of Economics and Business Administration Metro Media Transilvania Russia Saint Petersburg Team Graduate School of Management, Saint Petersburg Moscow Team State University - Higher School of Economics, Moscow Olga Verhovskaya Valery Katkalo Maria Dorokhina Alexander Chepurenko Olga Obraztsova Tatiana Alimova Maria Gabelko Graduate School of Management at Saint Petersburg State University State University - Higher School of Economics O+K Marketing & Consulting Levada-Center Serbia The Faculty of Economics Subotica Dusan Bobera Bozidar Lekovic Stevan Vasiljev Pere Tumbas Sasa Bosnjak Slobodan Maric Executive Council of Vojvodina Province, Department for Economy Marketing Agency “Drdrazen” d.o.o. Subotica Slovenia Institute for Entrepreneurship and Small Business Management, Faculty of Economics & Business, University of Maribor Miroslav Rebernik Polona Tominc Ksenja Pušnik Ministry of the Economy Slovenian Research Agency Smart Com Finance – Slovenian Business Daily RM PLUS South Africa University of Cape Town -Graduate School of Business Mike Herrington Jacqui Kew Penny Kew Tonia Overmeyer Department of Trade and Industry Swiss South Africa Cooperation Initiative South African Breweries Standard Bank SEDA Nielsen South Africa GEM National Teams 2008
  • 60.
    59 Team Institution National Team Members FinancialSponsors APS Vendor Spain Regional Teams: Andalucía Asturias Aragón Canary I. Cantabria Castille Leon Castille la Mancha Catalonia C. Valenciana Extremadura Galicia Madrid Murcia Navarra Basque Country Ceuta Melilla Instituto de Empresa Regional Universities: Cádiz Oviedo Univ. de Zaragoza Las Palmas & La Laguna Univ. De Cantabria León Castille la Mancha Autónoma de Barcelona Miguel Hernández Fundación Xavier de Salas Santiago de Compostela Autónoma de Madrid Univ. de Murcia Pública de Navarra Deusto & Basque Country Univ. de Granada & Escuela de Negocios de Andalucía Ignacio de la Vega Alicia Coduras Isabel Gonzalez Cristina Cruz Rachida Justo Regional Team Directors: José Ruiz Navarro Juan Ventura Victoria Lucio Fuentelsaz Rosa M. Batista Canino Fco. Javier Martínez Mariano Nieto Antolín Miguel Ángel Galindo Martín Carlos Guallarte José Mª Gómez Gras Ricardo Hernández Mogollón J. Alberto Díez de Castro Eduardo Bueno Campos Antonio Aragón Sánchez Iñaki Mas Erice Iñaki Peña Legazkue Lázaro Rodríguez Ariza María del Mar Fuentes DGPYMES Fundación Cultural Banesto Fundación Incyde IE Business School Junta de Andalucía Gob. de Aragón Gob. del Principado de Asturias Gob. de Canarias, Cabildo Fondo Social Europeo Gob. de Cantabria Centros de Innovación Europeos (Navarra, Murcia, C y León) Generalitat de Catalunya Junta de Extremadura Air Nostrum, CEG, BIC Galicia IMADE, FGUAM Fundación Caja Murcia Eusko Ikaskuntza Instituto Vasco de Competitividad FESNA Universidad de Granada and many others Instituto Opinòmetre S.L. Turkey Yeditepe University Nilüfer Egrican Esra Karadeniz Endeavor, Turkey Country Office Akbank Akademetre Research & Strategic Planning United Kingdom     Hunter Center for Entrepreneurship, University of Strathclyde Economics & Strategy Group, Aston Business School, Aston University Jonathan Levie Mark Hart BERR Enterprise Directorate InvestNI Department of Enterprise, Trade and Investment (NI) Belfast City Council Enterprise Northern Ireland Hunter Centre for Entrepreneurship, University of Strathclyde Scottish Enterprise Welsh Assembly Government One North East North West Development Agency Yorkshire Forward Advantage West Midlands East Midlands Development Agency South West of England Development Agency South East Development Agency Enterprise Insight Wessex Enterprise IFF GEM National Teams 2008
  • 61.
    60 GEM National Teams2008 Team Institution National Team Members Financial Sponsors APS Vendor United States Babson College Baruch College, City University of New York I. Elaine Allen Marcia Cole Monica Dean Ivory Phinisee Joseph Onochie Edward Rogoff Babson College Baruch College Opinion Search Uruguay Instituto de Estudios Empresariales de Montevideo (IEEM) Leonardo Veiga Pablo Regent Fernando Borraz Alejandro Gaidana Adrián Edelman Cecilia Gomeza IEEM Business School - Universidad de Montevideo Mori, Uruguay GEM Global Coordination Team London Business School SMU - Cox School of Business Babson College Utrecht University IE Business School Michael Hay Mark Quill Chris Aylett Jackline Odoch Mick Hancock Maria Minniti William D. Bygrave Marcia Cole Jeff Seaman Niels Bosma Alicia Coduras Universidad del Desarrollo Babson College N/A
  • 62.
    61 About the Authors NielsBosMa Niels Bosma is a member of the Urban and Regional research centre Utrecht, section of Economic Geography, Utrecht University. He is the Research Director for GERA, the research organization that hosts the Global Entrepreneurship Monitor. He has an MSc in Econometrics from the University of Groningen and was previously an entrepreneurship researcher at EIM Business & Policy Research in the Netherlands. He has published several articles in entrepreneurship journals. ZOLTAN J. ACS Zoltan J. Acs is University Professor at the School of Public Policy and Director of the Center for Entrepreneurship and Public Policy. He is also a Research Scholar at the Max Planck Institute for Economics in Jena, Germany, and Scholar-in-Residence at the Kauffman Foundation. He is coeditor and founder of Small Business Economics, the leading entrepreneurship and small business publication in the world. Dr. Acs is a leading advocate of the importance of entrepreneurship for economic development. He received the 2001 International Award for Entrepreneurship and Small Business Research, on behalf of The Sweedish National Board for Industrial and Technical Development. He has published more than 100 articles and 20 books, including articles in the American Economic Review, Review of Economics and Statistics, Kyklos, Journal of Urban Economics, Economica, Research Policy and Science Policy. His most recent publication is Entrepreneurship, Geography and American Economic Growth, Cambridge University Press. ERKKO AUTIO Erkko Autio is QinetiQ-EPSRC Chair Professor of technology transfer and entrepreneurship at the Imperial College Business School in London. He has published widely in high-growth entrepreneurship, international entrepreneurship, and technology-based venturing. He has served on the boards of several technology-based ventures and VC funds and advised several governments on entrepreneurship policy. Currently chairing EU DG Innovation’s advisory panel on high-growth entrepreneurship policy, he is a founding coordination team member of the Global Entrepreneurship Monitor. ALICIA CODURAS Alicia Coduras is a research professor in the Department of Entrepreneurial Management in the Instituto de Empresa Business School, Madrid, Spain. She is a member of the GEM Coordination Team and Technical Director of GEM Spain. She holds a doctorate in Political Sciences from the University of Pompeu Fabra and a degree in Economic and Business Sciences from the University of Barcelona. She has published more than 30 articles and book chapters based on GEM data and led the regional development of GEM Spain. JONATHAN LEVIE Jonathan Levie is a senior lecturer at the Hunter Centre for Entrepreneurship in the University of Strathclyde, Glasgow, UK, where he was Director from 2000 to 2005. He was previously Associate Coordinator of Global Entrepreneurship Monitor, based at London Business School. He has a PhD from London Business School and MSc and BSc from the National University of Ireland. He has been teaching and researching entrepreneurship for more than 25 years.
  • 63.
    62 GEM Sponsors GERA andGEM The Global Entrepreneurship Research Association (GERA) is, for formal constitutional and regulatory purposes, the umbrella organization that hosts the GEM project. GERA is an association formed of Babson College, London Business School, and representatives of the Association of GEM national teams. The GEM program is a major initiative aimed at describing and analyzing entrepreneurial processes within a wide range of countries. The program has three main objectives: • To measure differences in the level of entrepreneurial activity between countries. • To uncover factors leading to appropriate levels of entrepreneurship. • To suggest policies that may enhance the national level of entrepreneurial activity. New developments, and all global, national, and special topic reports, can be found at www.gemconsortium.org. The program is sponsored by Babson College and London Business School. BABSON COLLEGE Babson College in Wellesley, Massachusetts, USA, is recognized internationally as a leader in entrepreneurial management education. Babson grants BS degrees through its innovative undergraduate program, and grants MBA and custom MS and MBA degrees through the F.W. Olin Graduate School of Business at Babson College. Babson Executive Education offers executive development programs to experienced managers worldwide. For information, visit www.babson.edu. Universidad del desarrollo Universidad del Desarrollo, UDD, Educational project was driven by outstanding leaders of the Chilean public and business scene and is today one of the top three prestigious private universities in Chile. Success came quickly, after just eighteen years, its rapid growth has become an expression of the University’s main facet: entrepreneurship. UDD MBA is rated one of the best in Latin America and number one in Entrepreneurship, according to AméricaEconomîa magazine, and achievement that once again represents the “entrepreneurial” seal that is embedded in the spirit of the University. For more information visit www.udd.cl.
  • 64.
    63 Contacts For more informationon this report, contact Niels Bosma at: nbosma@gemconsortium.org To download copies of the GEM Global Report(s), GEM National Team Reports, and to access select data sets, please visit the GEM Web site: www.gemconsortium.org Nations not currently represented in the GEM Consortium may express interest in joining and ask for additional information by e-mailing: Mick Hancock at mhancock@gemconsortium.org Marcia Cole at colema@gemconsortium.org, or Chris Aylett at Caylett@london.edu
  • 65.
    64 Endnotes i These phases coincidewith the classification by the most recent Global Competitiveness Report into factor- driven, efficiency-driven and innovation-driven economies. See Porter and Schwab (2008). ii Evidence is documented by e.g. Carree and Thurik (2003), Acs (2006), Audretsch, (2007). iii See Acs, Parsons and Tracy (2007). iv See Wennekers and colleagues (2005), Gries & Naude (2008). v See e.g. Gartner (1986) and Shane and Venkataraman (2000). vi See Levie and Autio (2008) for a more detailed discussion. vii Most new businesses do not survive beyond three or four years. This is the main rationale for the choice of 42 months as the cut-off period. However, the choice of 42 months reflects also operational issues. According to Reynolds and colleagues (2005), “The relevant interview question asked only the year when salary and wage payments were initiated and most surveys occurred in the summer months; so the alternatives for choosing a “new firm age” were 1.5 years, 2.5 years, 3.5 years, etc. The shortest time frame that would provide enough cases for stable prevalence rates with a total sample of 2,000 seemed to occur at 3.5 years. Conceptually, any time period under five years seemed satisfactory so this age was considered an appropriate trade-off between conceptual and operational considerations in the early years of the project. There has been no compelling reason to adjust this criterion and a desire for a stable time series has led to its continued use. It should be considered a procedure to capture existing firms less than three or four years old." viii The sample sizes in the GEM 2008 study typically range from 2,000 to 3,500. Notable exceptions are Spain (31,000 respondents) and the UK (8,000 respondents). ix See Kirzner (1973) and Shane (2003). x This report focuses on country comparisons. For many countries, regional differences in entrepreneurial behavior are also significant. This has been documented for Europe, using GEM data, by Bosma and Schutjens (2007) and for Germany by Bergmann and Sternberg (2007). The relationships described in this section are also applicable to regional differences. xi For literature on opportunity costs of entrepreneurship see e.g. Lucas (1978), Shane and Venkataraman (2000) and Parker (2005). xii Hills and Singh (2004) report that among 472 US nascent entrepreneurs in 1998, for 37% the opportunity discovery came before the desire to start a business, while for 42% the desire to start came before the recognition of an opportunity. For the remaining 21% opportunity recognition and desire to start came at about the same time. xiv The model proposed by Shane focuses on entrepreneurial behavior without necessarily linking to owning and managing a business. xv This concerns the following efficiency-driven countries: Argentina, Brazil, Chile, Croatia, Hungary and South Africa. Innovation-driven economies included in this analysis are Belgium, Denmark, Finland, France, Germany, Iceland, Ireland, Italy, Japan, Netherlands, Norway, Slovenia, Spain, Sweden, United Kingdom, United States. xv For instance, on 25 March 2008 the Financial Times reported that Iceland’s banking system was in trouble, see http://www.ft.com/cms/s/0/5f9301dc-fa51-11dc-aa46-000077b07658.html?nclick_check=1. xvi In the Global Competitiveness Reports the countries are classified in three major phases and two ‘transition’ phases. To create three country groups, we assigned countries in a transition phase to the major phase they were emerging from.. xvii “Statistical significance” refers to a calculation of where the range within which the average value of 95 out of 100 replications of the survey would be expected to lie. This range is shown in Figure 2 by vertical bars on either side of each data point. If the ‘confidence intervals’ (denoted by the vertical bars) of two national TEA
  • 66.
    65 rates do notoverlap, the difference between the TEA rates is not statistically significant at the 0.05 level. Reference in this report to significant differences implies statistically significant difference at the 0.05 level. xviii See the Global Entrepreneurship Monitor reports from 2004-2006 available at www.gemconsortium.org. xix The R-squared of the fitted curve (third order polynomial) equals 0.49. xx The calculation of opportunity-driven early-stage differs somewhat from pre-2007 reports. GEM identifies these different motivations in two stages. First, respondents involved in early-stage entrepreneurial activity are asked whether they are involved because they recognized an opportunity, or because they had no better options for work. Recognizing that this question is polyvalent and that people operating somewhere in between these extremes tend to answer the first option, those who chose recognition of an opportunity were asked whether the main driver behind pursuing this opportunity was: (a) to increase their own income, (b) to be independent; or (c) to maintain their income. The latter category was not considered as a genuine opportunity for the measures shown in Figure 11. xxi As argued further above, the necessity rates are probably a conservative estimation. For the remaining group, i.e. the individuals involved in TEA who were not classified in either of the categories “improvement-driven opportunity” or “necessity,” no statistical pattern could be discerned. xxii Robinson, C., B. O’Leary, and A. Rincon, (2006). Business start-ups, closures and economic churn: A review of the Literature. Final report prepared for the Small Business Service, 23 August. London: National Institute of Economic and Social Research. xxiii More detailed information can be found in the special GEM reports on Women and Entrepreneurship, available on the GEM website (www.gemconsortium.org). xxiv Missing data have been estimated as a function of the existing data. xxv In total, we had 678, 714 adult-population interviews for the combined 2006 – 2008 data set. xxvi An over-sample for the Shenzhen region was excluded from China’s data because of its anomalous nature. xxvii In general world cities exhibit higher aspiration levels in early-stage entrepreneurial activity in comparison to the rest of the country, see Acs and colleagues 2008. xxviii Business activities are reported in answer to an open-ended question. The open-ended questions are coded into the ISIC coding classification (4-digits). xxix This classification includes ‘medium high’ and ‘high’ technology sectors in Manufacturing and Services. See OECD (2003). xxx Data for Hungary is not reported here because of an unusually high “don’t know” response rate. xxxi Factor analysis was conducted on the total sample and country by country. Across the 25 nations, the three original items loaded onto one factor which explained 67% of the variance with acceptable reliability (0.754) and sampling adequacy (.676). Country level reliability and sampling adequacy were similar. This suggests that these three items are capturing different dimensions of one underlying construct. xxxii Researchers have suggested that education and training for entrepreneurship should positively impact entrepreneurial activity by enhancing instrumental skills required to startup and grow a business (Honig, 2004), by enhancing cognitive ability of individuals to manage the complexities involved in opportunity recognition and assessment (DeTienne and Chandler, 2004), and by affecting their cultural attitudes and behavioral dispositions (Peterman and Kennedy, 2003). Demonstrating these effects, however, has been a challenge. First, there may be considerable self-selection into entrepreneurship education. Secondly, the effects may be long term rather than instantaneous. For example, in the short term, graduates of entrepreneurship education may recognize the need to amass specific knowledge (Fiet and Patel, 2008) and decide to defer action. Thirdly, there is the need for adequate control groups to demonstrate effects. Fourthly, individuals may receive such education and training at several points in their lives, such as at school, university, or after formal education, and it may take the form of traditional learning or experiential immersion in the phenomenon, Endnotes
  • 67.
    66 Endnotes through a placement,for example. As a result of these issues, population-level evidence concerning the influence of entrepreneurship training and education on entrepreneurial activity is still lacking (Béchard and Grégoire, 2005). See Levie and Autio (2008) for a wider discussion. xxxiii A small subset of respondents in Angola were also asked these questions. As this sample was too small for the analysis undertaken here, Angola is not included in this chapter. xxxiv Chi-square tests were used to test for significant differences in proportions of training by age group for each country. Chi-square statistics returning p values of less than 0.05 were regarded as evidence of significant differences in proportions. xxxv Typically, between 18 and 36 experts completed a structured questionnaire containing statements about aspects of entrepreneurship education and training in the country. They rated each statement on a 5-point scale, where a score of 1 would be “not true,” of 3 would be neutral, and of 5 “completely true.” xxxvi The two measures of high-growth expectation were: expect to create at least 10 jobs and at least double current employment in 5 years time, and expect to create at least 20 jobs in 5 years time. These two measures were highly correlated across the 28 countries (r = .961, p = .000).