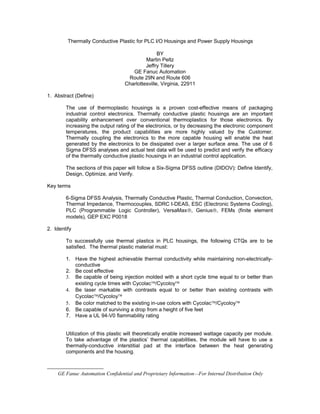
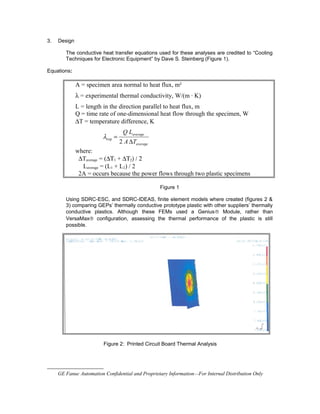
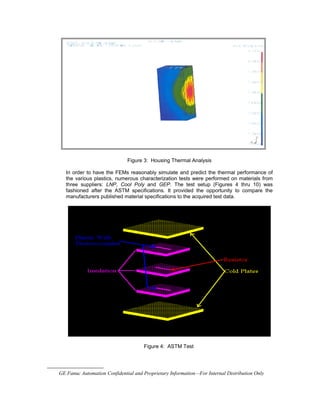
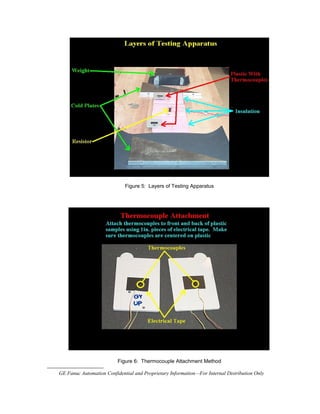
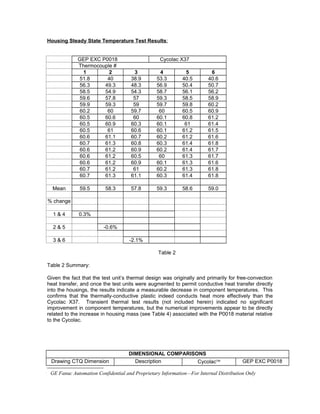
Thermally Conductive Plastic for PLC I/O Housings and Power Supply Housings
BY
Martin Peltz
Jeffry Tillery
GE Fanuc Automation
Route 29N and Route 606
Charlottesville, Virginia, 22911
1. Abstract (Define)
The use of thermoplastic housings is a proven cost-effective means of packaging
industrial control electronics. Thermally conductive plastic housings are an important
capability enhancement over conventional thermoplastics for those electronics. By
increasing the output rating of the electronics, or by decreasing the electronic component
temperatures, the product capabilities are more highly valued by the Customer.
Thermally coupling the electronics to the more capable housing will enable the heat
generated by the electronics to be dissipated over a larger surface area. The use of 6
Sigma DFSS analyses and actual test data will be used to predict and verify the efficacy
of the thermally conductive plastic housings in an industrial control application.
The sections of this paper will follow a Six-Sigma DFSS outline (DIDOV): Define Identify,
Design, Optimize, and Verify.
Key terms
6-Sigma DFSS Analysis, Thermally Conductive Plastic, Thermal Conduction, Convection,
Thermal Impedance, Thermocouples, SDRC I-DEAS, ESC (Electronic Systems Cooling),
PLC (Programmable Logic Controller), VersaMax®, Genius®, FEMs (finite element
models), GEP EXC P0018
2. Identify
To successfully use thermal plastics in PLC housings, the following CTQs are to be
satisfied. The thermal plastic material must:
1. Have the highest achievable thermal conductivity while maintaining non-electrically-
conductive
2. Be cost effective
3. Be capable of being injection molded with a short cycle time equal to or better than
existing cycle times with Cycolac™/Cycoloy™
4. Be laser markable with contrasts equal to or better than existing contrasts with
Cycolac™/Cycoloy™
5. Be color matched to the existing in-use colors with Cycolac™/Cycoloy™
6. Be capable of surviving a drop from a height of five feet
7. Have a UL 94-V0 flammability rating
Utilization of this plastic will theoretically enable increased wattage capacity per module.
To take advantage of the plastics’ thermal capabilities, the module will have to use a
thermally-conductive interstitial pad at the interface between the heat generating
components and the housing.

GE Fanuc Automation Confidential and Proprietary Information—For Internal Distribution Only
3. Design
The conductive heat transfer equations used for these analyses are credited to “Cooling
Techniques for Electronic Equipment” by Dave S. Steinberg (Figure 1).
Equations:
A = specimen area normal to heat flux, m²
λ = experimental thermal conductivity, W/(m · K)
L = length in the direction parallel to heat flux, m
Q = time rate of one-dimensional heat flow through the specimen, W
∆T = temperature difference, K
where:
∆Taverage = (∆Τ1 + ∆Τ2) / 2
Laverage = (L1 + L2) / 2
2A = occurs because the power flows through two plastic specimens
Figure 1
Using SDRC-ESC, and SDRC-IDEAS, finite element models where created (figures 2 &
3) comparing GEPs’ thermally conductive prototype plastic with other suppliers’ thermally
conductive plastics. Although these FEMs used a Genius® Module, rather than
VersaMax® configuration, assessing the thermal performance of the plastic is still
possible.
Figure 2: Printed Circuit Board Thermal Analysis

GE Fanuc Automation Confidential and Proprietary Information—For Internal Distribution Only
average
average
TA
LQ
∆
=
2
expλ
Figure 3: Housing Thermal Analysis
In order to have the FEMs reasonably simulate and predict the thermal performance of
the various plastics, numerous characterization tests were performed on materials from
three suppliers: LNP, Cool Poly and GEP. The test setup (Figures 4 thru 10) was
fashioned after the ASTM specifications. It provided the opportunity to compare the
manufacturers published material specifications to the acquired test data.
Figure 4: ASTM Test

GE Fanuc Automation Confidential and Proprietary Information—For Internal Distribution Only
Figure 5: Layers of Testing Apparatus
Figure 6: Thermocouple Attachment Method

GE Fanuc Automation Confidential and Proprietary Information—For Internal Distribution Only
Figure 7: Insulation Layers and Test Sample
Figure 8: Magnified View of Insulation Layer with Heat Source

GE Fanuc Automation Confidential and Proprietary Information—For Internal Distribution Only
Figure 9: Orientation and Alignment of Insulation and Test Sample
Figure 10: Assembled Testing Apparatus

GE Fanuc Automation Confidential and Proprietary Information—For Internal Distribution Only
The results of the characterization tests were then inserted into SDRC-ESC for the finite element
thermal analyses. Table 1 represents the analyses’ predictions vs. material:
Material Thermal Analyses’ Results
Comparisons of Zn, Al, Cool Poly™, Konduit™, and GEP # EXC P0018
Run Materials Boundary Conditions Results ( °C )
Module Walls PCB Smart
Switches
Thermal
Pad
Heat Load Radiation
View Factor
Flow Surfaces Module
Walls
PC
Boards
Smart
Switches
Material Emmisivity Thermal Conductivity (W/mK)
VIII N0. 7 Die
Cast Zinc
0.8 113 FR4 4oz
Copper
Ceramic Furon 15 W Note A Note B 82.1 82.8 83.6
IX 380 Die Cast
Aluminum
0.8 96.2 FR4 4oz
Copper
Ceramic Furon 15 W Note A Note B 82.7 83.2 84.2
X Cool Poly 0.8 20 FR4 4oz
Copper
Ceramic Furon 15W Note A Note B 91.9 90.4 93.2
XI Konduit 0.8 1 FR4 4oz
Copper
Ceramic Furon 15 W Note A Note B 116 113 117
XII 380 Die Cast
Aluminum
0.8 96.2 FR4 4oz
Copper
Ceramic Furon 30 W Note A Note B 101 102 104
XIII GEP # EXC
P0018
0.8 1.06 FR4 4oz
Copper
Ceramic Furon 15 W Note A Note B 115.5* 112.5* 116.5*
Notes:
A.) .5 on front face; 0 on base; 1 everywhere else
B.) Rough PCB's and all Module Walls except the front face, and the base
C.) * = extrapolated values based upon transfer function of thermal analysis model as derived from Minitab regression analysis of data
Table 1
4. Optimize
Given the results of the predictive thermal analyses and the temperature testing of
samples of the various thermally-conductive materials, GEP forwarded enough raw
material of #EXC P0018 to GE Fanuc’s molding supplier to manufacture sample
VersaMax® I/O housings. With these housings, a more realistic evaluation of the
plastics’ relative performance could be achieved.
To evaluate the thermal performance of the GEP # EXC P0018-molded VersaMax®
housing relative to the Cycolac™ plastic housing that is currently in production, two
IC200MDL331 “AC High Output” I/O modules were obtained. For each module, one of
the Poron™ vibration dampeners was replaced with a Furon™ thermally-conductive pad,
and four (4) thermocouples affixed as illustrated in Figures 11 and 12. The test
assemblies were then placed in a temperature chamber and made operational. A
Genius® block was used as a data-logger for the thermocouples.
The first series of tests intended to evaluate the thermal transient capabilities of the
housings. The chamber was programmed to cycle from 24° C to 60°C with temperature
measurements recorded every thirty (30) minutes for 48 hours.
The second series of tests evaluated the steady state characteristics of the housings.
The test assemblies were placed into the temperature chamber, which was programmed
to soak at the assemblies at 60° C until they and the chamber reached the same
temperature. The test assemblies were then made operational, and data collection
started. This test was run for four (4) hours. The test assemblies were then removed

GE Fanuc Automation Confidential and Proprietary Information—For Internal Distribution Only
and examined for any separation of the thermocouples, as well as any damage caused
from the effects of the heat. No detrimental effects were observed.
Figure 11: VerasMax® I/O Housing
Figure 12: I/O Module Electronics Assembly

GE Fanuc Automation Confidential and Proprietary Information—For Internal Distribution Only

Thermocouple
Thermocouple
Thermocouple location
Furon™ Thermal Pad
Heatsink
Power FET’s 4 on each side
of heatsink
Thermal Pad
Thermal Plastic Housing
Poron™ Pad
A
B
F
C
D
E
Housing Steady State Temperature Test Results:
GEP EXC P0018 Cycolac X37
Thermocouple #
1 2 3 4 5 6
51.8 40 38.9 53.3 40.5 40.6
56.3 49.3 48.3 56.9 50.4 50.7
58.5 54.9 54.3 58.7 56.1 56.2
59.6 57.8 57 59.3 58.5 58.9
59.9 59.3 59 59.7 59.8 60.2
60.2 60 59.7 60 60.5 60.9
60.5 60.6 60 60.1 60.8 61.2
60.5 60.9 60.3 60.1 61 61.4
60.5 61 60.6 60.1 61.2 61.5
60.6 61.1 60.7 60.2 61.2 61.6
60.7 61.3 60.8 60.3 61.4 61.8
60.6 61.2 60.9 60.2 61.4 61.7
60.6 61.2 60.5 60 61.3 61.7
60.6 61.2 60.9 60.1 61.3 61.6
60.7 61.2 61 60.2 61.3 61.8
60.7 61.3 61.1 60.3 61.4 61.8
Mean 59.5 58.3 57.8 59.3 58.6 59.0
% change
1 & 4 0.3%
2 & 5 -0.6%
3 & 6 -2.1%
Table 2
Table 2 Summary:
Given the fact that the test unit’s thermal design was originally and primarily for free-convection
heat transfer, and once the test units were augmented to permit conductive heat transfer directly
into the housings, the results indicate a measurable decrease in component temperatures. This
confirms that the thermally-conductive plastic indeed conducts heat more effectively than the
Cycolac X37. Transient thermal test results (not included herein) indicated no significant
improvement in component temperatures, but the numerical improvements appear to be directly
related to the increase in housing mass (see Table 4) associated with the P0018 material relative
to the Cycolac.
DIMENSIONAL COMPARISONS
Drawing CTQ Dimension Description Cycolac™ GEP EXC P0018

GE Fanuc Automation Confidential and Proprietary Information—For Internal Distribution Only
4.330 Overall length (A) 4.334 4.354
2.610 Overall width (B) 2.610 2.635
1.994 Bottom Step width (C) 1.994 2.003
1.970 Height (D) 1.959 1.968
0.062 Color bar hole (E) 0.061 0.061
4.101 Lens opening (length) (F) 4.105 4.110
• Nominal dimensions shown
• See Figure 11
Table 3
Table 3 Summary:
The tooling for this particular housing was designed with Cycolac and Cycoloy as the two
materials of intent. The P0018 material exhibits in the as-molded state slight to significant
dimensional variations as compared to the Cycolac material. Changing materials will require
changing the tooling to match the needed process capabilities of the product.
Weights
GEP Thermal Plastic Cycolac™ X37 Cycoloy™ C2800
73.6 grams 38.4 grams 44.3 grams
Table 4
5. Verify
Final verification of GEP EXC P0018 will not be achieved until the production plastic is
injection molded into an I/O housing specifically designed for its usage (Genius® X). The
tests described herein were performed on a VersaMax® Module Assembly that was designed
primarily for natural convection heat transfer. The module heatsink has a thin edge and by
default a smaller surface area. Consequently, this results in increasing that interface’s
thermal impedance. To verify the effectiveness of the plastic, our new tests will increase the
area of the conduction interface by increasing the contact surface area, and a Furon™ pad of
comparable interface surface area will be included. Reducing the thickness of the thermal
pad and increasing its surface area will decrease the thermal impedance--thereby increasing
the heat transfer to the thermal plastic housing.
The thermal tests previously performed in the Optimize phase will be repeated on new test
samples. Verification and acceptance of the GEP EXC P0018 material will be based on the
thermal performance verses final cost assessment, and in conjunction with the other required
CTQ’s.


GE Fanuc Automation Confidential and Proprietary Information—For Internal Distribution Only

GEF Thermal Tech Paper Final 040501

  • 1.
    Thermally Conductive Plasticfor PLC I/O Housings and Power Supply Housings BY Martin Peltz Jeffry Tillery GE Fanuc Automation Route 29N and Route 606 Charlottesville, Virginia, 22911 1. Abstract (Define) The use of thermoplastic housings is a proven cost-effective means of packaging industrial control electronics. Thermally conductive plastic housings are an important capability enhancement over conventional thermoplastics for those electronics. By increasing the output rating of the electronics, or by decreasing the electronic component temperatures, the product capabilities are more highly valued by the Customer. Thermally coupling the electronics to the more capable housing will enable the heat generated by the electronics to be dissipated over a larger surface area. The use of 6 Sigma DFSS analyses and actual test data will be used to predict and verify the efficacy of the thermally conductive plastic housings in an industrial control application. The sections of this paper will follow a Six-Sigma DFSS outline (DIDOV): Define Identify, Design, Optimize, and Verify. Key terms 6-Sigma DFSS Analysis, Thermally Conductive Plastic, Thermal Conduction, Convection, Thermal Impedance, Thermocouples, SDRC I-DEAS, ESC (Electronic Systems Cooling), PLC (Programmable Logic Controller), VersaMax®, Genius®, FEMs (finite element models), GEP EXC P0018 2. Identify To successfully use thermal plastics in PLC housings, the following CTQs are to be satisfied. The thermal plastic material must: 1. Have the highest achievable thermal conductivity while maintaining non-electrically- conductive 2. Be cost effective 3. Be capable of being injection molded with a short cycle time equal to or better than existing cycle times with Cycolac™/Cycoloy™ 4. Be laser markable with contrasts equal to or better than existing contrasts with Cycolac™/Cycoloy™ 5. Be color matched to the existing in-use colors with Cycolac™/Cycoloy™ 6. Be capable of surviving a drop from a height of five feet 7. Have a UL 94-V0 flammability rating Utilization of this plastic will theoretically enable increased wattage capacity per module. To take advantage of the plastics’ thermal capabilities, the module will have to use a thermally-conductive interstitial pad at the interface between the heat generating components and the housing.  GE Fanuc Automation Confidential and Proprietary Information—For Internal Distribution Only
  • 2.
    3. Design The conductiveheat transfer equations used for these analyses are credited to “Cooling Techniques for Electronic Equipment” by Dave S. Steinberg (Figure 1). Equations: A = specimen area normal to heat flux, m² λ = experimental thermal conductivity, W/(m · K) L = length in the direction parallel to heat flux, m Q = time rate of one-dimensional heat flow through the specimen, W ∆T = temperature difference, K where: ∆Taverage = (∆Τ1 + ∆Τ2) / 2 Laverage = (L1 + L2) / 2 2A = occurs because the power flows through two plastic specimens Figure 1 Using SDRC-ESC, and SDRC-IDEAS, finite element models where created (figures 2 & 3) comparing GEPs’ thermally conductive prototype plastic with other suppliers’ thermally conductive plastics. Although these FEMs used a Genius® Module, rather than VersaMax® configuration, assessing the thermal performance of the plastic is still possible. Figure 2: Printed Circuit Board Thermal Analysis  GE Fanuc Automation Confidential and Proprietary Information—For Internal Distribution Only average average TA LQ ∆ = 2 expλ
  • 3.
    Figure 3: HousingThermal Analysis In order to have the FEMs reasonably simulate and predict the thermal performance of the various plastics, numerous characterization tests were performed on materials from three suppliers: LNP, Cool Poly and GEP. The test setup (Figures 4 thru 10) was fashioned after the ASTM specifications. It provided the opportunity to compare the manufacturers published material specifications to the acquired test data. Figure 4: ASTM Test  GE Fanuc Automation Confidential and Proprietary Information—For Internal Distribution Only
  • 4.
    Figure 5: Layersof Testing Apparatus Figure 6: Thermocouple Attachment Method  GE Fanuc Automation Confidential and Proprietary Information—For Internal Distribution Only
  • 5.
    Figure 7: InsulationLayers and Test Sample Figure 8: Magnified View of Insulation Layer with Heat Source  GE Fanuc Automation Confidential and Proprietary Information—For Internal Distribution Only
  • 6.
    Figure 9: Orientationand Alignment of Insulation and Test Sample Figure 10: Assembled Testing Apparatus  GE Fanuc Automation Confidential and Proprietary Information—For Internal Distribution Only
  • 7.
    The results ofthe characterization tests were then inserted into SDRC-ESC for the finite element thermal analyses. Table 1 represents the analyses’ predictions vs. material: Material Thermal Analyses’ Results Comparisons of Zn, Al, Cool Poly™, Konduit™, and GEP # EXC P0018 Run Materials Boundary Conditions Results ( °C ) Module Walls PCB Smart Switches Thermal Pad Heat Load Radiation View Factor Flow Surfaces Module Walls PC Boards Smart Switches Material Emmisivity Thermal Conductivity (W/mK) VIII N0. 7 Die Cast Zinc 0.8 113 FR4 4oz Copper Ceramic Furon 15 W Note A Note B 82.1 82.8 83.6 IX 380 Die Cast Aluminum 0.8 96.2 FR4 4oz Copper Ceramic Furon 15 W Note A Note B 82.7 83.2 84.2 X Cool Poly 0.8 20 FR4 4oz Copper Ceramic Furon 15W Note A Note B 91.9 90.4 93.2 XI Konduit 0.8 1 FR4 4oz Copper Ceramic Furon 15 W Note A Note B 116 113 117 XII 380 Die Cast Aluminum 0.8 96.2 FR4 4oz Copper Ceramic Furon 30 W Note A Note B 101 102 104 XIII GEP # EXC P0018 0.8 1.06 FR4 4oz Copper Ceramic Furon 15 W Note A Note B 115.5* 112.5* 116.5* Notes: A.) .5 on front face; 0 on base; 1 everywhere else B.) Rough PCB's and all Module Walls except the front face, and the base C.) * = extrapolated values based upon transfer function of thermal analysis model as derived from Minitab regression analysis of data Table 1 4. Optimize Given the results of the predictive thermal analyses and the temperature testing of samples of the various thermally-conductive materials, GEP forwarded enough raw material of #EXC P0018 to GE Fanuc’s molding supplier to manufacture sample VersaMax® I/O housings. With these housings, a more realistic evaluation of the plastics’ relative performance could be achieved. To evaluate the thermal performance of the GEP # EXC P0018-molded VersaMax® housing relative to the Cycolac™ plastic housing that is currently in production, two IC200MDL331 “AC High Output” I/O modules were obtained. For each module, one of the Poron™ vibration dampeners was replaced with a Furon™ thermally-conductive pad, and four (4) thermocouples affixed as illustrated in Figures 11 and 12. The test assemblies were then placed in a temperature chamber and made operational. A Genius® block was used as a data-logger for the thermocouples. The first series of tests intended to evaluate the thermal transient capabilities of the housings. The chamber was programmed to cycle from 24° C to 60°C with temperature measurements recorded every thirty (30) minutes for 48 hours. The second series of tests evaluated the steady state characteristics of the housings. The test assemblies were placed into the temperature chamber, which was programmed to soak at the assemblies at 60° C until they and the chamber reached the same temperature. The test assemblies were then made operational, and data collection started. This test was run for four (4) hours. The test assemblies were then removed  GE Fanuc Automation Confidential and Proprietary Information—For Internal Distribution Only
  • 8.
    and examined forany separation of the thermocouples, as well as any damage caused from the effects of the heat. No detrimental effects were observed. Figure 11: VerasMax® I/O Housing Figure 12: I/O Module Electronics Assembly  GE Fanuc Automation Confidential and Proprietary Information—For Internal Distribution Only  Thermocouple Thermocouple Thermocouple location Furon™ Thermal Pad Heatsink Power FET’s 4 on each side of heatsink Thermal Pad Thermal Plastic Housing Poron™ Pad A B F C D E
  • 9.
    Housing Steady StateTemperature Test Results: GEP EXC P0018 Cycolac X37 Thermocouple # 1 2 3 4 5 6 51.8 40 38.9 53.3 40.5 40.6 56.3 49.3 48.3 56.9 50.4 50.7 58.5 54.9 54.3 58.7 56.1 56.2 59.6 57.8 57 59.3 58.5 58.9 59.9 59.3 59 59.7 59.8 60.2 60.2 60 59.7 60 60.5 60.9 60.5 60.6 60 60.1 60.8 61.2 60.5 60.9 60.3 60.1 61 61.4 60.5 61 60.6 60.1 61.2 61.5 60.6 61.1 60.7 60.2 61.2 61.6 60.7 61.3 60.8 60.3 61.4 61.8 60.6 61.2 60.9 60.2 61.4 61.7 60.6 61.2 60.5 60 61.3 61.7 60.6 61.2 60.9 60.1 61.3 61.6 60.7 61.2 61 60.2 61.3 61.8 60.7 61.3 61.1 60.3 61.4 61.8 Mean 59.5 58.3 57.8 59.3 58.6 59.0 % change 1 & 4 0.3% 2 & 5 -0.6% 3 & 6 -2.1% Table 2 Table 2 Summary: Given the fact that the test unit’s thermal design was originally and primarily for free-convection heat transfer, and once the test units were augmented to permit conductive heat transfer directly into the housings, the results indicate a measurable decrease in component temperatures. This confirms that the thermally-conductive plastic indeed conducts heat more effectively than the Cycolac X37. Transient thermal test results (not included herein) indicated no significant improvement in component temperatures, but the numerical improvements appear to be directly related to the increase in housing mass (see Table 4) associated with the P0018 material relative to the Cycolac. DIMENSIONAL COMPARISONS Drawing CTQ Dimension Description Cycolac™ GEP EXC P0018  GE Fanuc Automation Confidential and Proprietary Information—For Internal Distribution Only
  • 10.
    4.330 Overall length(A) 4.334 4.354 2.610 Overall width (B) 2.610 2.635 1.994 Bottom Step width (C) 1.994 2.003 1.970 Height (D) 1.959 1.968 0.062 Color bar hole (E) 0.061 0.061 4.101 Lens opening (length) (F) 4.105 4.110 • Nominal dimensions shown • See Figure 11 Table 3 Table 3 Summary: The tooling for this particular housing was designed with Cycolac and Cycoloy as the two materials of intent. The P0018 material exhibits in the as-molded state slight to significant dimensional variations as compared to the Cycolac material. Changing materials will require changing the tooling to match the needed process capabilities of the product. Weights GEP Thermal Plastic Cycolac™ X37 Cycoloy™ C2800 73.6 grams 38.4 grams 44.3 grams Table 4 5. Verify Final verification of GEP EXC P0018 will not be achieved until the production plastic is injection molded into an I/O housing specifically designed for its usage (Genius® X). The tests described herein were performed on a VersaMax® Module Assembly that was designed primarily for natural convection heat transfer. The module heatsink has a thin edge and by default a smaller surface area. Consequently, this results in increasing that interface’s thermal impedance. To verify the effectiveness of the plastic, our new tests will increase the area of the conduction interface by increasing the contact surface area, and a Furon™ pad of comparable interface surface area will be included. Reducing the thickness of the thermal pad and increasing its surface area will decrease the thermal impedance--thereby increasing the heat transfer to the thermal plastic housing. The thermal tests previously performed in the Optimize phase will be repeated on new test samples. Verification and acceptance of the GEP EXC P0018 material will be based on the thermal performance verses final cost assessment, and in conjunction with the other required CTQ’s.   GE Fanuc Automation Confidential and Proprietary Information—For Internal Distribution Only