Download as PDF, PPTX
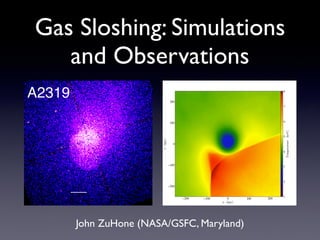
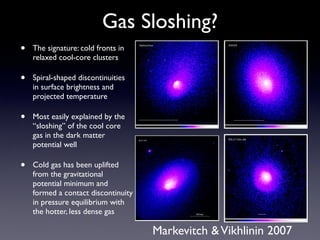
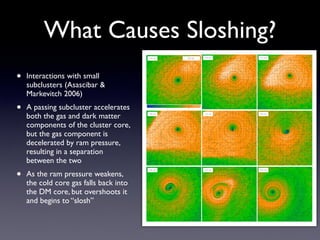
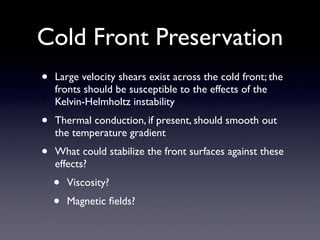
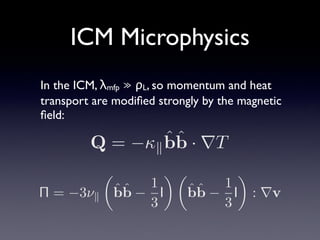
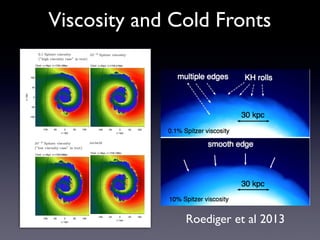
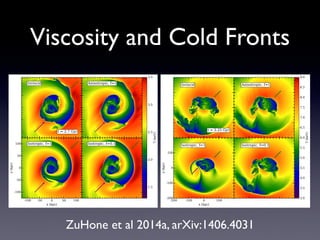
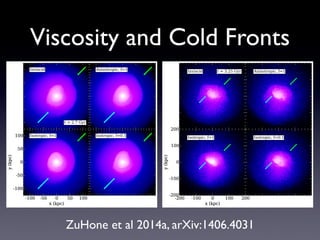

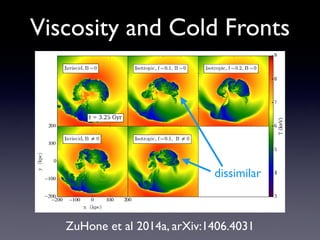
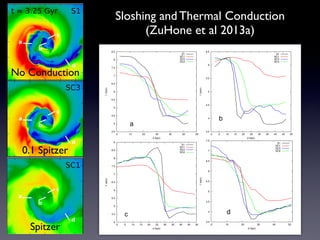
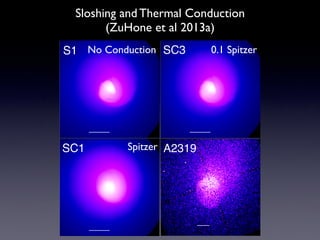
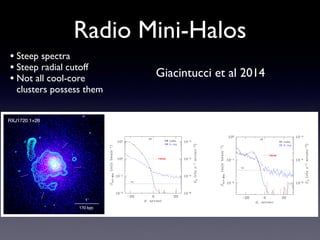
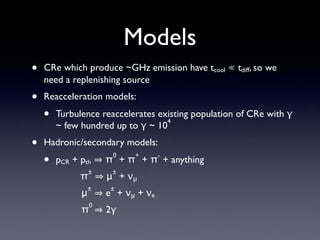
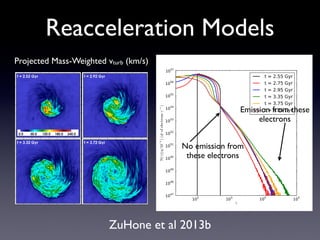
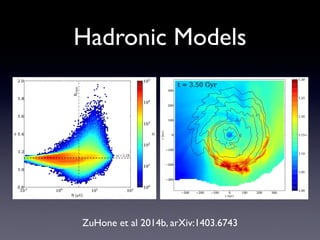

The document discusses gas sloshing in galaxy clusters, particularly the observation of cold fronts and the dynamics involved in their formation. It highlights the mechanisms causing sloshing, such as interactions with subclusters, and addresses the role of viscosity, magnetic fields, and thermal conduction in stabilizing cold fronts. Furthermore, it raises several open questions regarding the formation of large-scale fronts and the origins of radio mini-halos in relation to particle acceleration and spectral steepening.