Download to read offline
![Astronomy & Astrophysics manuscript no. aanda ©ESO 2024
August 16, 2024
JWST MIRI and NIRCam observations of NGC 891 and its
circumgalactic medium
Jérémy Chastenet1 ⋆, Ilse De Looze1 ⋆⋆, Monica Relaño2, 3 , Daniel A. Dale4 , Thomas G. Williams5 ,
Simone Bianchi6 , Emmanuel M. Xilouris7 , Maarten Baes1 , Alberto D. Bolatto8 , Martha L. Boyer9 ,
Viviana Casasola10 , Christopher J. R. Clark11 , Filippo Fraternali12 , Jacopo Fritz13 , Frédéric Galliano14 ,
Simon C. O. Glover15 , Karl D. Gordon9, 1 , Hiroyuki Hirashita16, 17 , Robert Kennicutt19 ,
Kentaro Nagamine17, 18, 20, 21 , Florian Kirchschlager1 , Ralf S. Klessen15, 22 , Eric W. Koch23 ,
Rebecca C. Levy19⋆⋆⋆ , Lewis McCallum24, Suzanne C. Madden14 , Anna F. McLeod25 , Sharon E. Meidt1 ,
Aleksandr V. Mosenkov26 , Helena M. Richie27 , Amélie Saintonge28 , Karin M. Sandstrom29 ,
Evan E. Schneider27, Evgenia E. Sivkova1, J. D. T. Smith30 , Matthew W. L. Smith31 , Arjen van der Wel1 ,
Stefanie Walch32, Fabian Walter33 , and Kenneth Wood24
(Affiliations can be found after the references)
Received X; X
ABSTRACT
We present new JWST observations of the nearby, prototypical edge-on, spiral galaxy NGC 891. The northern half of the disk was observed with
NIRCam in its F150W and F277W filters. Absorption is clearly visible in the mid-plane of the F150W image, along with vertical dusty plumes
that closely resemble the ones seen in the optical. A ∼10×3 kpc2
area of the lower circumgalactic medium (CGM) was mapped with MIRI F770W
at 12 pc scales. Thanks to the sensitivity and resolution of JWST, we detect dust emission out to ∼ 4 kpc from the disk, in the form of filaments,
arcs, and super-bubbles. Some of these filaments can be traced back to regions with recent star formation activity, suggesting that feedback-driven
galactic winds play an important role in regulating baryonic cycling. The presence of dust at these altitudes raises questions about the transport
mechanisms at play and suggests that small dust grains are able to survive for several tens of million years after having been ejected by galactic
winds in the disk-halo interface. We lay out several scenarios that could explain this emission: dust grains may be shielded in the outer layers
of cool dense clouds expelled from the galaxy disk, and/or the emission comes from the mixing layers around these cool clumps where material
from the hot gas is able to cool down and mix with these cool cloudlets. This first set of data and upcoming spectroscopy will be very helpful to
understand the survival of dust grains in energetic environments, and their contribution to recycling baryonic material in the mid-plane of galaxies.
Key words. Galaxies: individual: NGC 891 – ISM: kinematics and dynamics – (ISM:) dust, extinction
1. Introduction
The disk-halo interface of galaxies is an active region, where
inflow and outflow processes occur. These mechanisms are fun-
damental to galaxy formation and evolution scenarios, as they
strongly affect the star formation rate and metallicity of a galaxy,
by the recycling of galactic material and inflows of pristine
(“zero-metallicity”) gas. Understanding the interaction between
the disk and the circumgalactic medium (CGM; see a review by
Faucher-Giguère & Oh 2023) is therefore important to constrain
galaxy evolution, which is instrumental in comprehending the
diversity of galaxies we observe today.
Gas in the disk-halo interface can come from gas accretion or
cooling of the CGM, or ejected material from the mid-plane of
galaxies (Marinacci et al. 2010; Lehner & Howk 2011; Marasco
et al. 2022). In some cases, these processes can be tied to a single
event, and take the form of galactic fountains (Bregman 1980;
Melioli et al. 2008; Fraternali & Binney 2006; Armillotta et al.
2016; Li et al. 2023): after being expelled from the disk, material
can cool down in the disk-halo interface and fall back down in
the mid-plane of the galaxy. The multitude of recent detections
⋆
jeremy.chastenet@ugent.be
⋆⋆
PI: ilse.delooze@ugent.be
⋆⋆⋆
NSF Astronomy & Astrophysics Postdoctoral Fellow
of massive galactic outflows in particular (Veilleux et al. 2005,
2020) has reinforced their importance in regulating galaxy evo-
lution, but their main driving forces (supernovae, stellar winds,
ionising radiation, supermassive black holes, cosmic rays) have
yet to be identified. Characterising the efficiency of these various
feedback mechanisms in regulating a galaxy’s vertical disk scale
heights and in driving feedback-driven outflows are among the
major challenges that current galaxy evolution models face (e.g.,
Sancisi et al. 2008; Fraternali & Binney 2008; Marinacci et al.
2011; Gentile et al. 2013; Naab & Ostriker 2017; Li et al. 2021;
Otsuki & Hirashita 2024).
Simulations can be a powerful tool to understand these ex-
change mechanisms, and sort them with respect to their rela-
tive importance in driving gas in and out of the disk. However,
large-scale cosmological simulations typically do not resolve the
extra-planar layers. Some discrepancies have been found be-
tween the mass outflow rates predicted by these simulations and
the current observed rates. On the other hand, high-resolution
simulations can help focus on a direct comparison with disk-
halo interface observations. Many works have focused on the
gas distributions surrounding individual galaxies, through cos-
mological zoom-in simulations (Kim et al. 2016; Marinacci et al.
2017; Hopkins et al. 2018; Ramesh & Nelson 2024) and iso-
lated galaxy simulations that self-consistently drive their out-
Article number, page 1 of 16
arXiv:2408.08026v1
[astro-ph.GA]
15
Aug
2024](https://image.slidesharecdn.com/2408-240822150149-34b24ed1/75/JWST-MIRI-and-NIRCam-observations-of-NGC-891-and-its-circumgalactic-medium-1-2048.jpg)
![A&A proofs: manuscript no. aanda
2h22m48s 44s 40s 36s 32s
42°26'
25'
24'
23'
22'
RA (ICRS)
Dec
(ICRS)
F150W
1 kpc
0
2
4
6
8
10
12
14
Surface
brightness
[MJy/sr]
2h22m48s 44s 40s 36s 32s
42°26'
25'
24'
23'
22'
RA (ICRS)
Dec
(ICRS)
F277W
1 kpc
0
2
4
6
8
10
12
14
Surface
brightness
[MJy/sr]
2h22m50s 45s 40s 35s
42°21'00"
20'30"
00"
19'30"
00"
RA (ICRS)
Dec
(ICRS)
1
k
p
c
2
k
p
c
5
k
p
c
1
0
k
p
c
F770W
1 kpc
0.0
0.5
1.0
1.5
2.0
2.5
3.0
3.5
4.0
Surface
brightness
[MJy/sr]
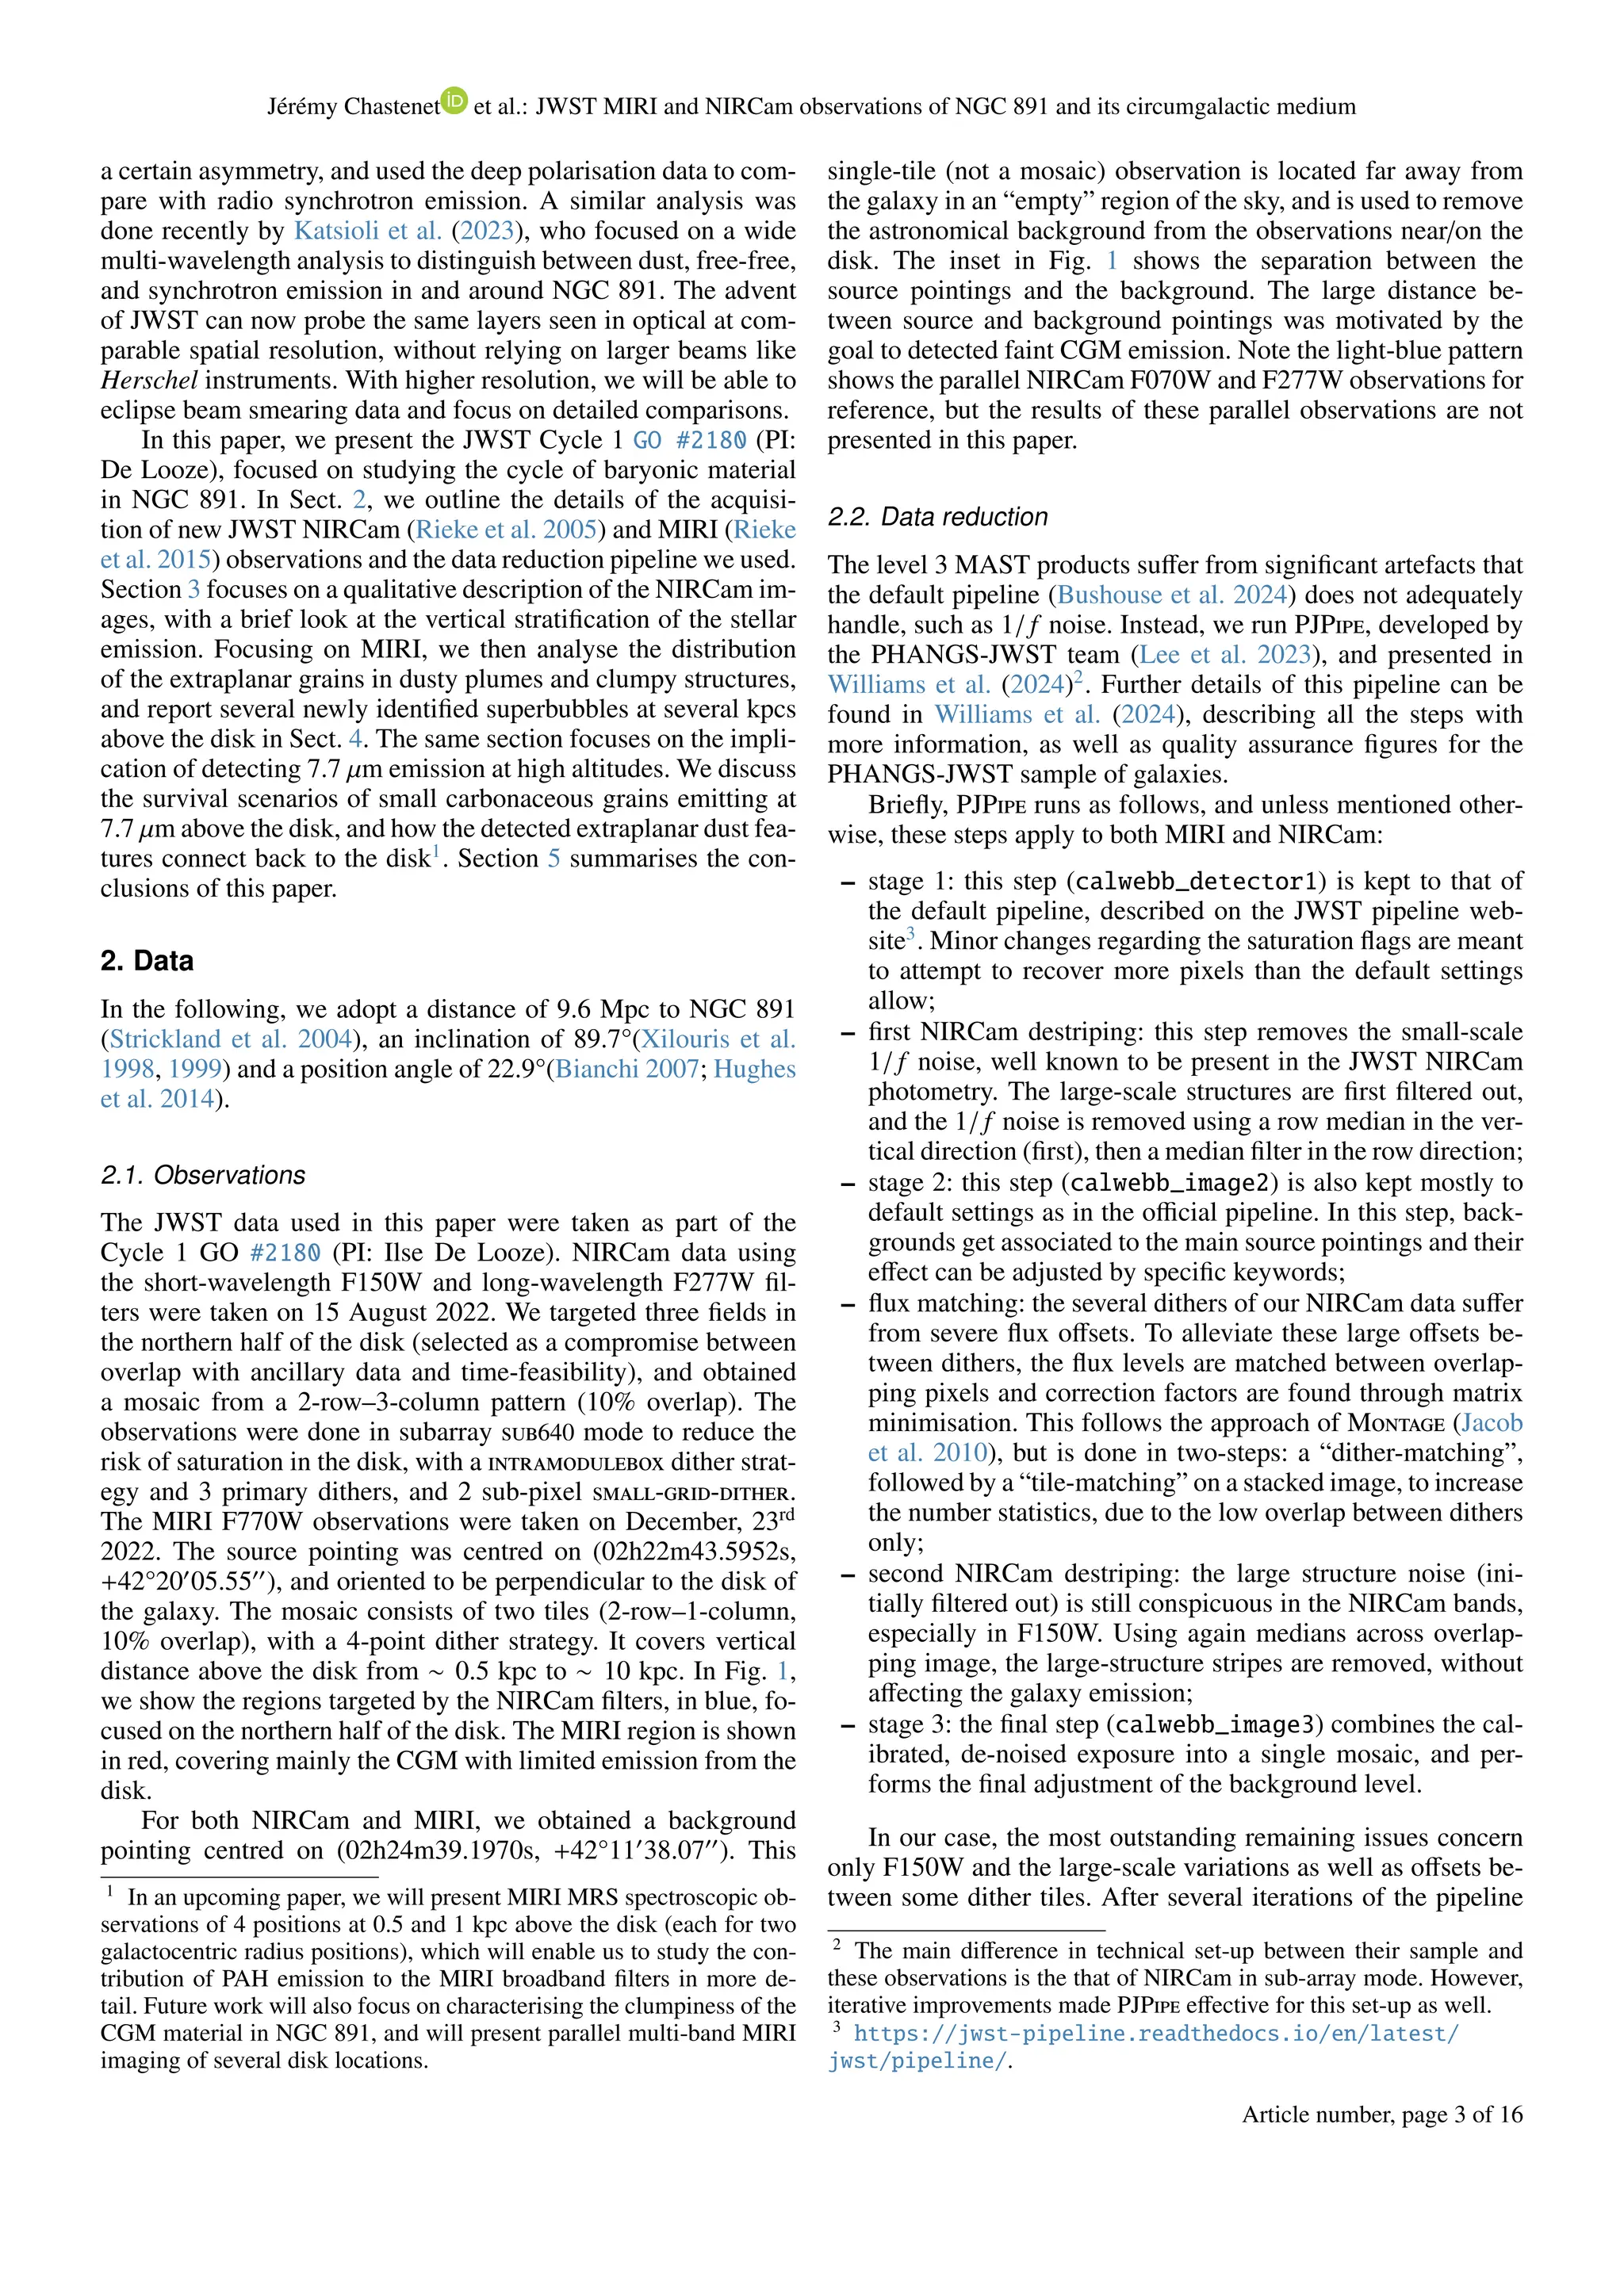
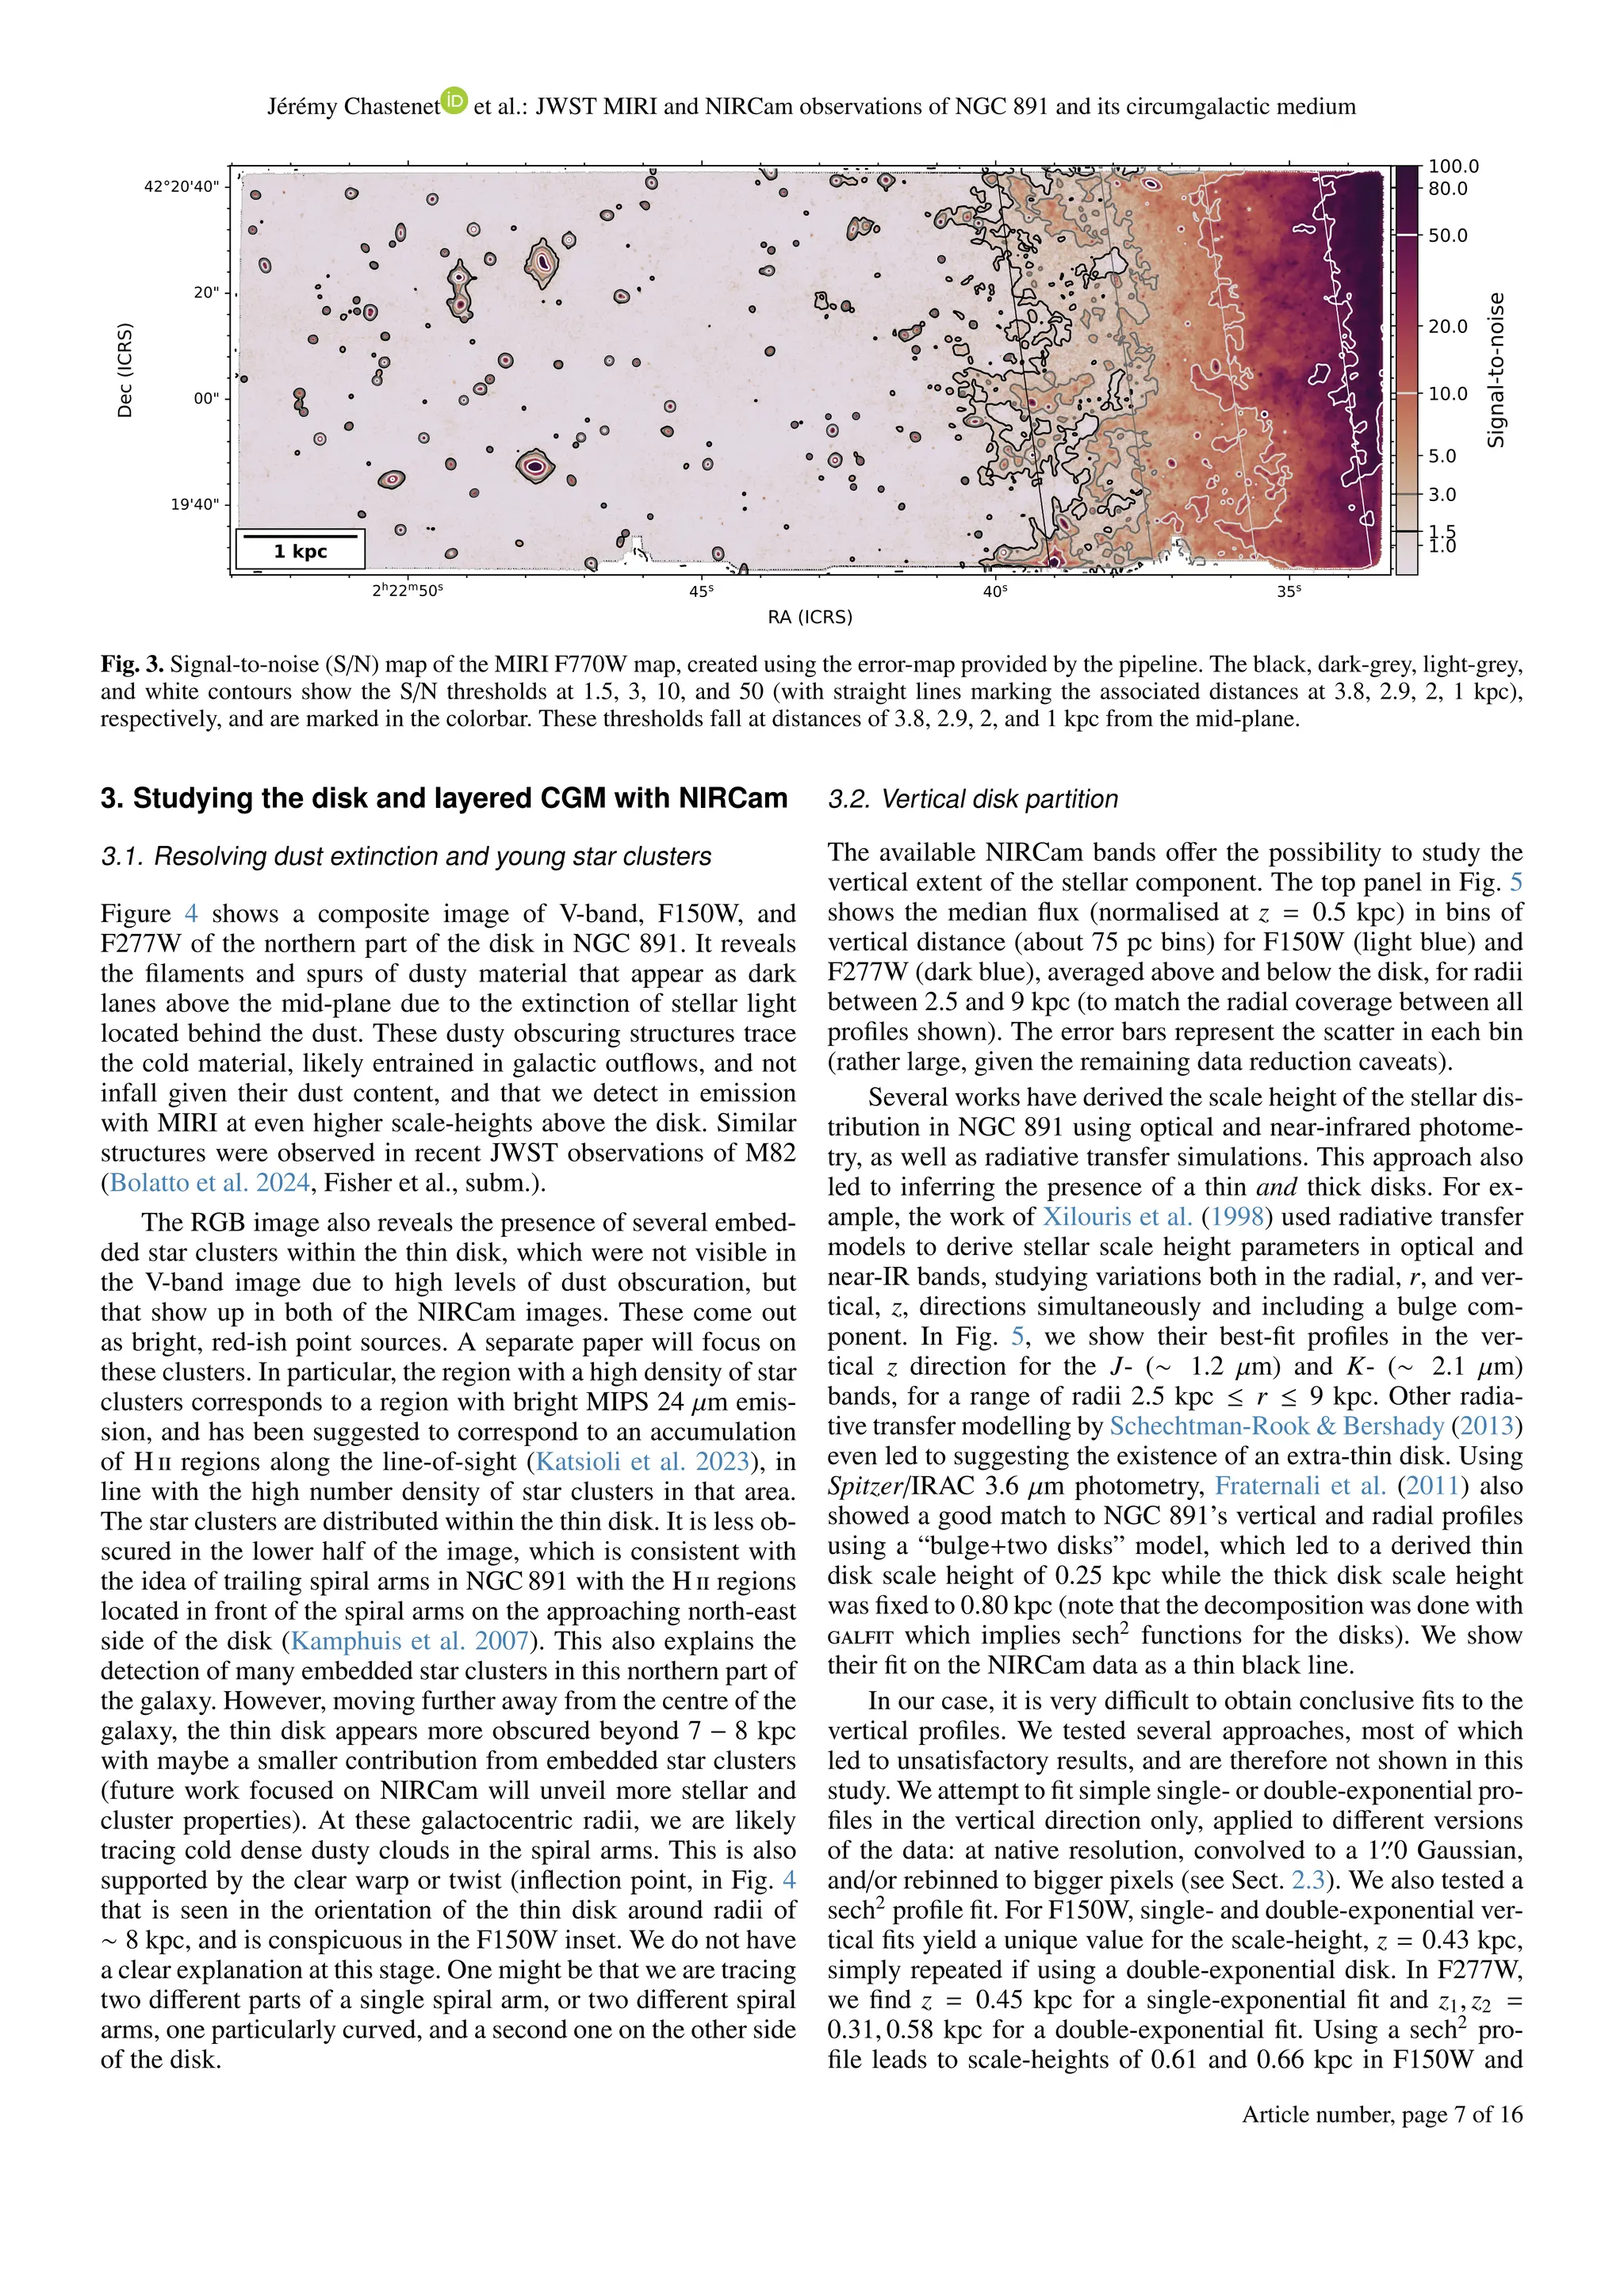
Fig. 2. Top left: NIRCam F150W data, at native ∼ 0.05′′
resolution. The mid-plane shows conspicuous absorption. The background in that band
shows large discrepancies, due to the difficulty to correct for both large structure stripes and offsets between the individual dithers. The small
squares are gaps in the dither-pattern coverage. Top right: NIRCam F277W data, at native ∼ 0.092′′
resolution. Some absorption is visible in
the mid-plane, and the image shows a much smoother background than for the F150W mosaic. Bottom: MIRI F770W data, at native ∼ 0.25′′
resolution, with radial distance indicators at 1, 2, 5, and 10 kpc from the mid-plane. The mid-IR image shows many filamentary structures as far
out as ∼ 4 kpc.
Article number, page 6 of 16](https://image.slidesharecdn.com/2408-240822150149-34b24ed1/75/JWST-MIRI-and-NIRCam-observations-of-NGC-891-and-its-circumgalactic-medium-6-2048.jpg)
![A&A proofs: manuscript no. aanda
2h22m42s 40s 38s 36s
42°24'00"
23'30"
00"
22'30"
00"
21'30"
RA [J2000]
Declination
[J2000]
r 7 kpc
r 3 kpc
Inflection point
Higher density
of clusters?
V-band
F150W
F277W
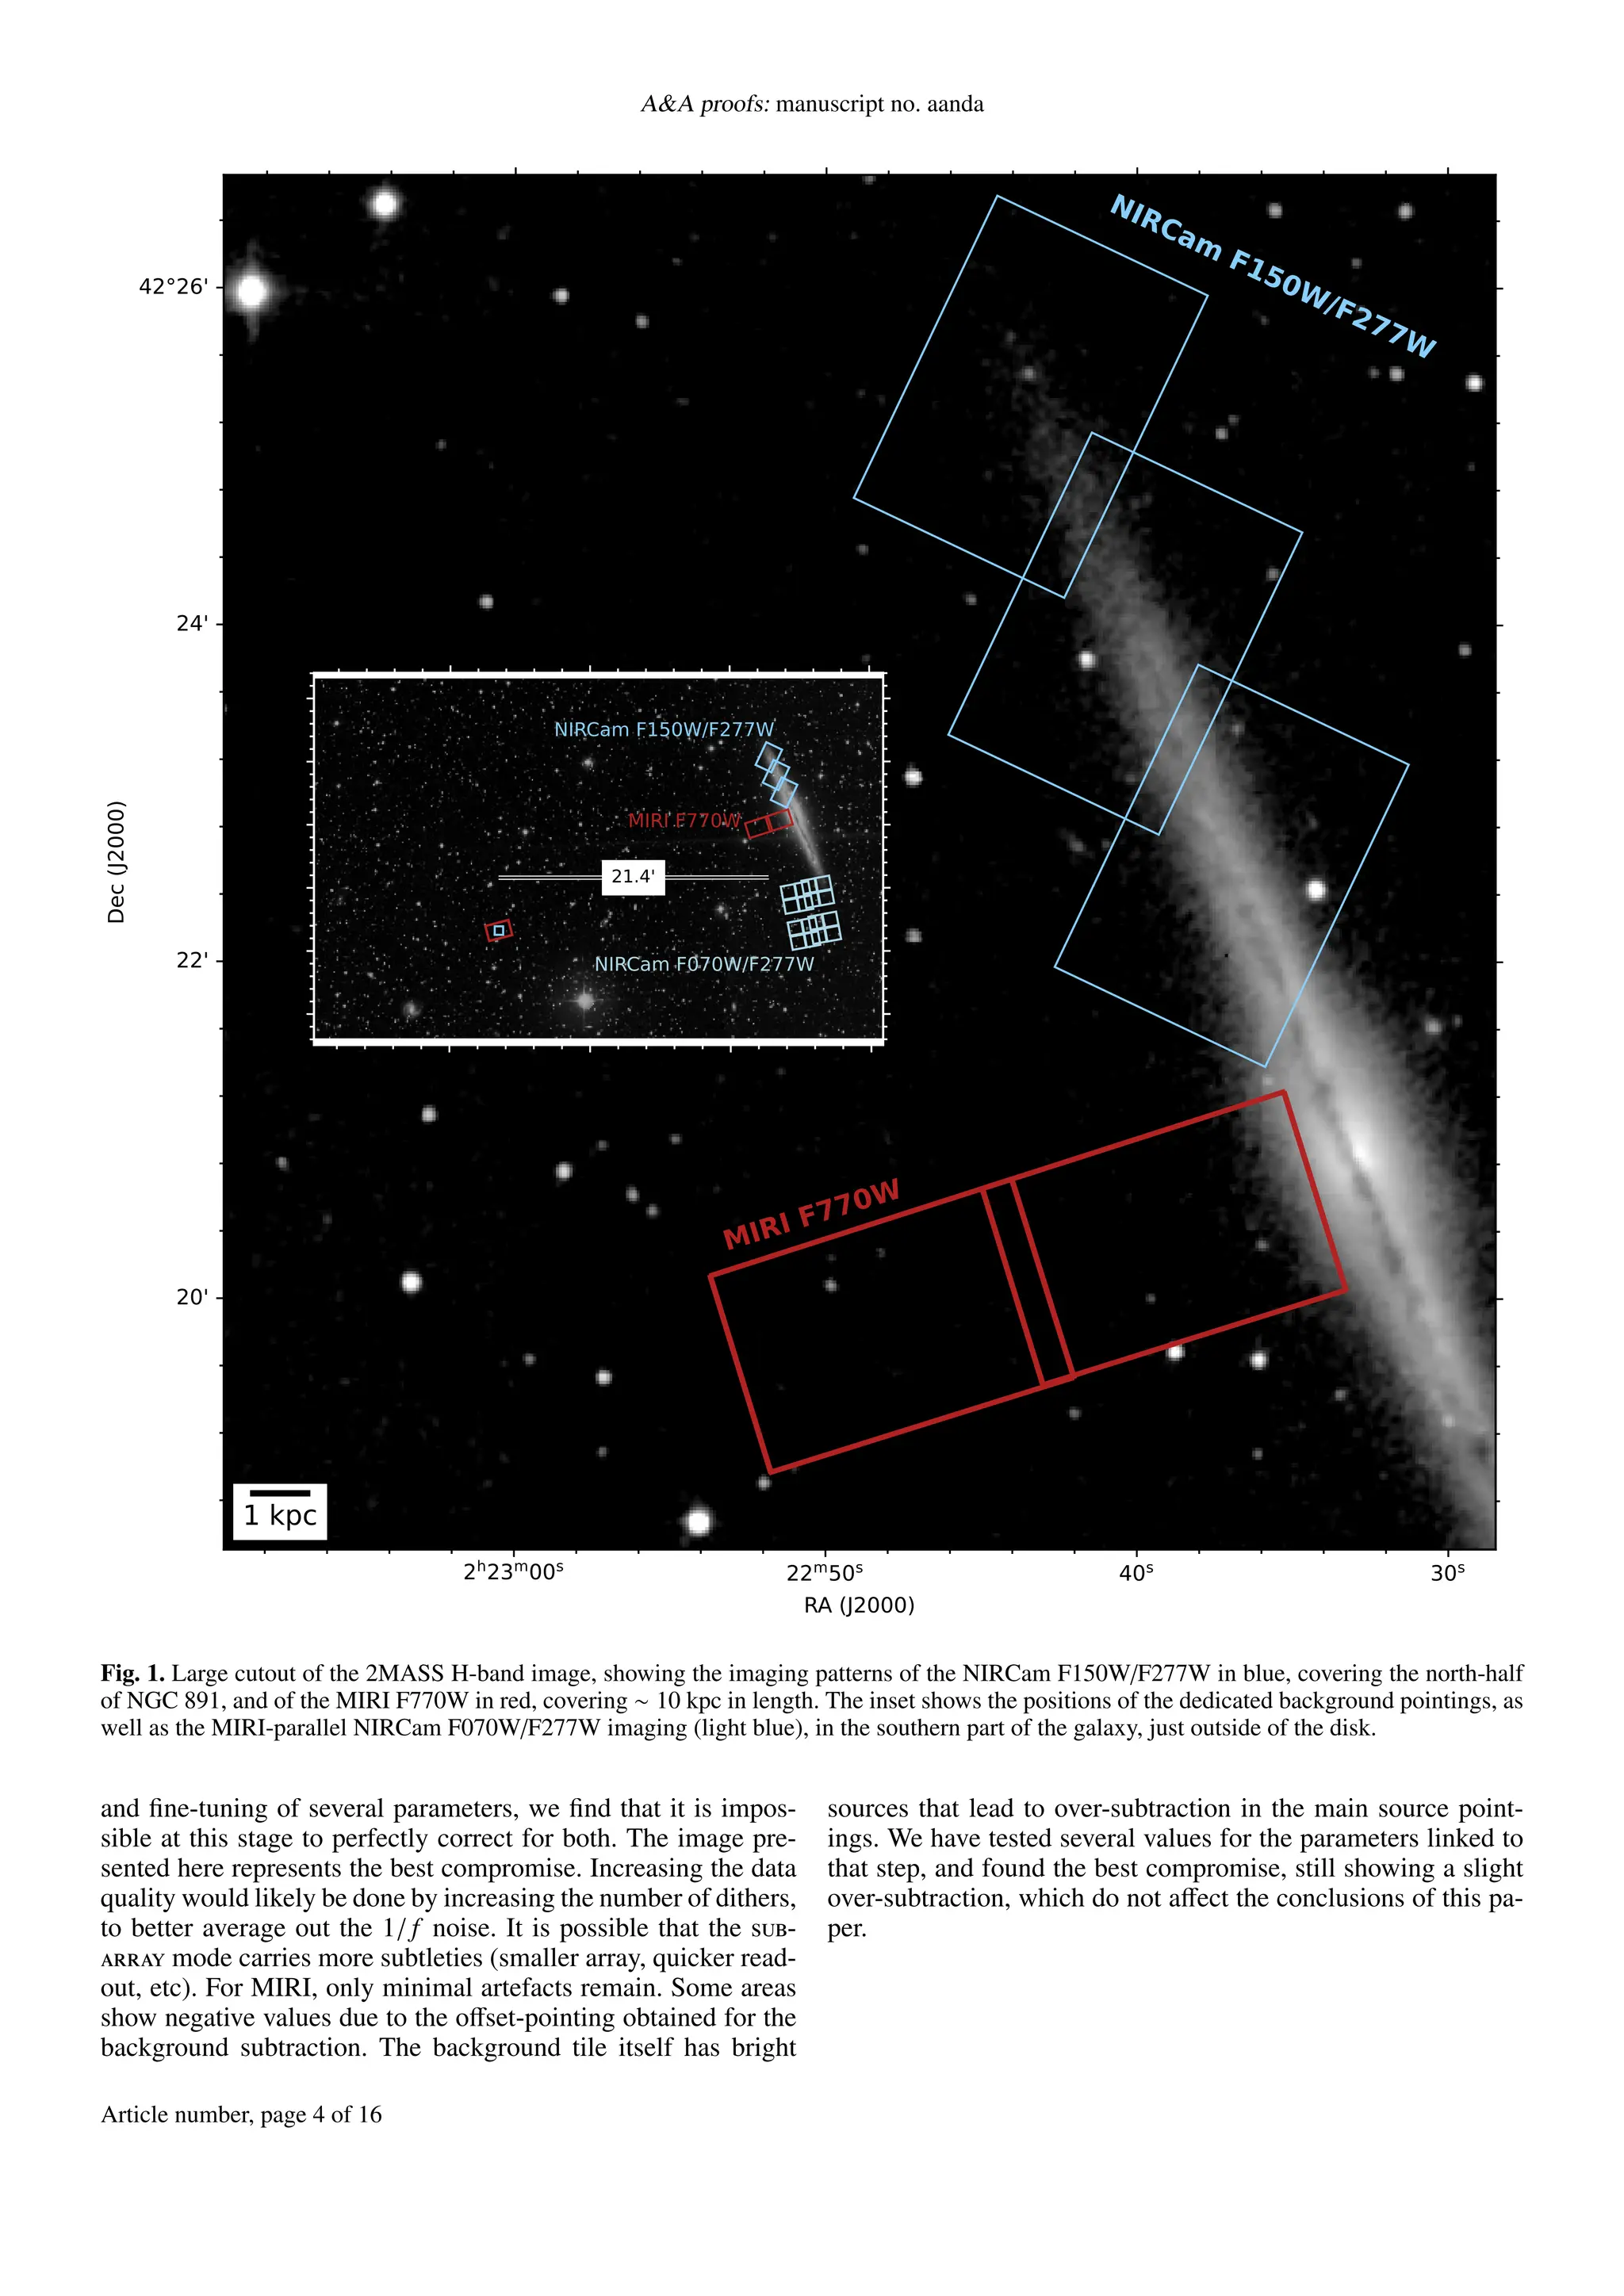
Fig. 4. Multi-colour image with red: F277W, green: F150W, and blue: V-band, showing the coverage where all data overlap (the V-band and
F277W images were adjusted to show the same spatial coverage, including dither gaps), and individual images shown in insets on the right. The
NIRCam data was convolved to a 0.2′′
Gaussian PSF. We indicate galactocentric radii r at 3 and 7 kpc. Conspicuous dark features show dusty
filaments seen in extinction perpendicular to the disk. We can also notice the presence of star clusters, some obscured by dust, and some are not.
F277W, respectively. However, both these fits can easily be bet-
ter adjusted by eye, meaning they are not quite “best fits.” We
found that the large scatter (used as error) in the plane of the disk
due to the visible point sources, and/or background irregularities
on each side of the plane, leads to a poor fit, forcing the flux val-
ues at high altitudes to be (wrongly) more constraining. In none
of the cases we tried are the associated errors reasonable to make
them trustworthy results, and we therefore do not show them6
.
A separate paper focused on NIRCam and other optical/near-IR
bands will tackle this issue in better details. Differences with val-
ues of scale-heights reported in the literature may be related to
modelling assumptions that are not addressed here, e.g., the use
6
We used the Python package scipy and its curve_fit function.
Article number, page 8 of 16](https://image.slidesharecdn.com/2408-240822150149-34b24ed1/75/JWST-MIRI-and-NIRCam-observations-of-NGC-891-and-its-circumgalactic-medium-8-2048.jpg)
![Jérémy Chastenet et al.: JWST MIRI and NIRCam observations of NGC 891 and its circumgalactic medium
0.0 0.2 0.4 0.6 0.8 1.0 1.2 1.4
Distance above disk, z [kpc]
-1.0
0.0
1.0
2.0
3.0
4.0
5.0
6.0
arbitrary
units
Fraternali et al. (2011), IRAC 1
Xilouris et al. (1998), J-band
Xilouris et al. (1998), K-band
F150W
F277W
30 20 10 0 10 20 30
Distance above disk, z ['']
1.5 1.0 0.5 0.0 0.5 1.0 1.5
Distance above disk, z [kpc]
100
101
norm.
units
F150W
F277W
B
R
I
Fig. 5. Top: NIRCam vertical profiles shown with symbols, in light blue
for F150W and dark blue for F277W. We also show the fit from Frater-
nali et al. (2011) using IRAC data (black line) and two fits from the
radiative transfer models of Xilouris et al. (1998). In all cases, we aver-
age the vertical profiles over galactocentric radii 2.5 kpc ≤ r ≤ 9 kpc,
so that the radial coverage is the same. Bottom: Emission profiles across
the disk at r ∼ 8 kpc showing the NIRCam data, and three optical bands.
The images have all been normalised to the average values at z = 1 kpc,
due to different units, for an easier comparison. The upturn at 1.2 kpc in
F150W is an artefact due to one of the dither offsets mentioned in the
text.
of a bulge component and the simultaneous variations in both
radial and vertical directions, or taking into account absorption
lanes, which has been shown to affect the estimation of scale-
heights (Xilouris et al. 1998; Savchenko et al. 2023). Given the
current quality of the NIRCam data, we do not investigate these
avenues further in this paper. A separate study focused on re-
solving NIRCam data reduction issues and subsequent analysis
will tackle the vertical stratification of this edge-on galaxy in the
near-IR.
To allow for a better visualisation of the vertical structure
without averaging in the radial direction, the bottom panel of
Fig. 5 shows the vertical profiles of the NIRCam data at an arbi-
trary galactocentric radius (r ∼ 8 kpc), normalised to the mean
value at z ∼ 1 kpc. The dust extinction is clearly visible in the dip
of the F150W emission (around −0.1 kpc; light blue line), while
the F277W data shows only a mild feature. We compare these
profiles to optical emission in the B, R, and I bands, in grey.
4. Resolving the inner circumgalactic medium with
MIRI F770W
4.1. Distribution of circumgalactic dust
While the presence of circumgalactic dust in NGC 891 has been
known for a while (e.g., Howk & Savage 1997; Burgdorf et al.
2007; Whaley et al. 2009), the resolution of prior instrumenta-
tion (e.g., ISO, Spitzer, Herschel) did not allow a study of its
intricate structure on scales smaller than 100 pc. With JWST, we
are able to map out the resolved circumgalactic dust emission in
a 3.3 kpc-wide strip of extra-planar material around a galacto-
centric radius of r = 0 kpc extending from z ∼ 0.5 to ∼ 10 kpc
above the disk, down to scales of 12 pc (i.e., 0′′
.25 FWHM of
MIRI F770W, see Fig. 2). The high spatial resolution of JWST
shows that the inner CGM material is not homogeneously dis-
tributed, but is rather dominated by small-scale structures (e.g.,
arcs and filaments tens of pc wide and hundreds of pc long)
where densities are locally enhanced (see Fig. 2). On the small-
est scales, we observe several clumpy structures that resemble
those seen in the CGM of the starburst galaxy M82, with JWST
(Fisher et al., subm.). They also somewhat mirror cool clumps
have been inferred through observations of Mg ii absorbers (e.g.,
Ménard et al. 2010; Lan & Fukugita 2017), but these were found
on larger scales. These cool clumps have average hydrogen num-
ber densities of 0.1 cm−3
and gas temperatures of Tgas ∼ 104
K,
and were postulated to have formed through thermal instabili-
ties and/or shock compression (Buie et al. 2018, 2020; Liang &
Remming 2020). They are also the perfect sites for grain pro-
cessing to take place (Hirashita & Lan 2021). A possible mech-
anism to explain the presence of dust in these clumps would
involve (1) large grains (a > 0.01 − 0.03 µm) being expelled
from the disk through galactic winds (Zu et al. 2011; Aoyama
et al. 2018; Schneider et al. 2020; Richie et al. 2024) and ra-
diative feedback processes (Sivkova et al. 2021), and (2) sub-
sequently undergoing shattering, transferring the predominantly
large grain population to the smaller grain sizes that are detected
in the JWST/MIRI F770W filter. That said, if radiation pressure
dominates, it should not be dependent on size distribution and
small grains could directly be pushed out of the disk, too. We
will discuss the statistical properties of these small-scale clump
structures in an upcoming paper (Chastenet et al., in prep).
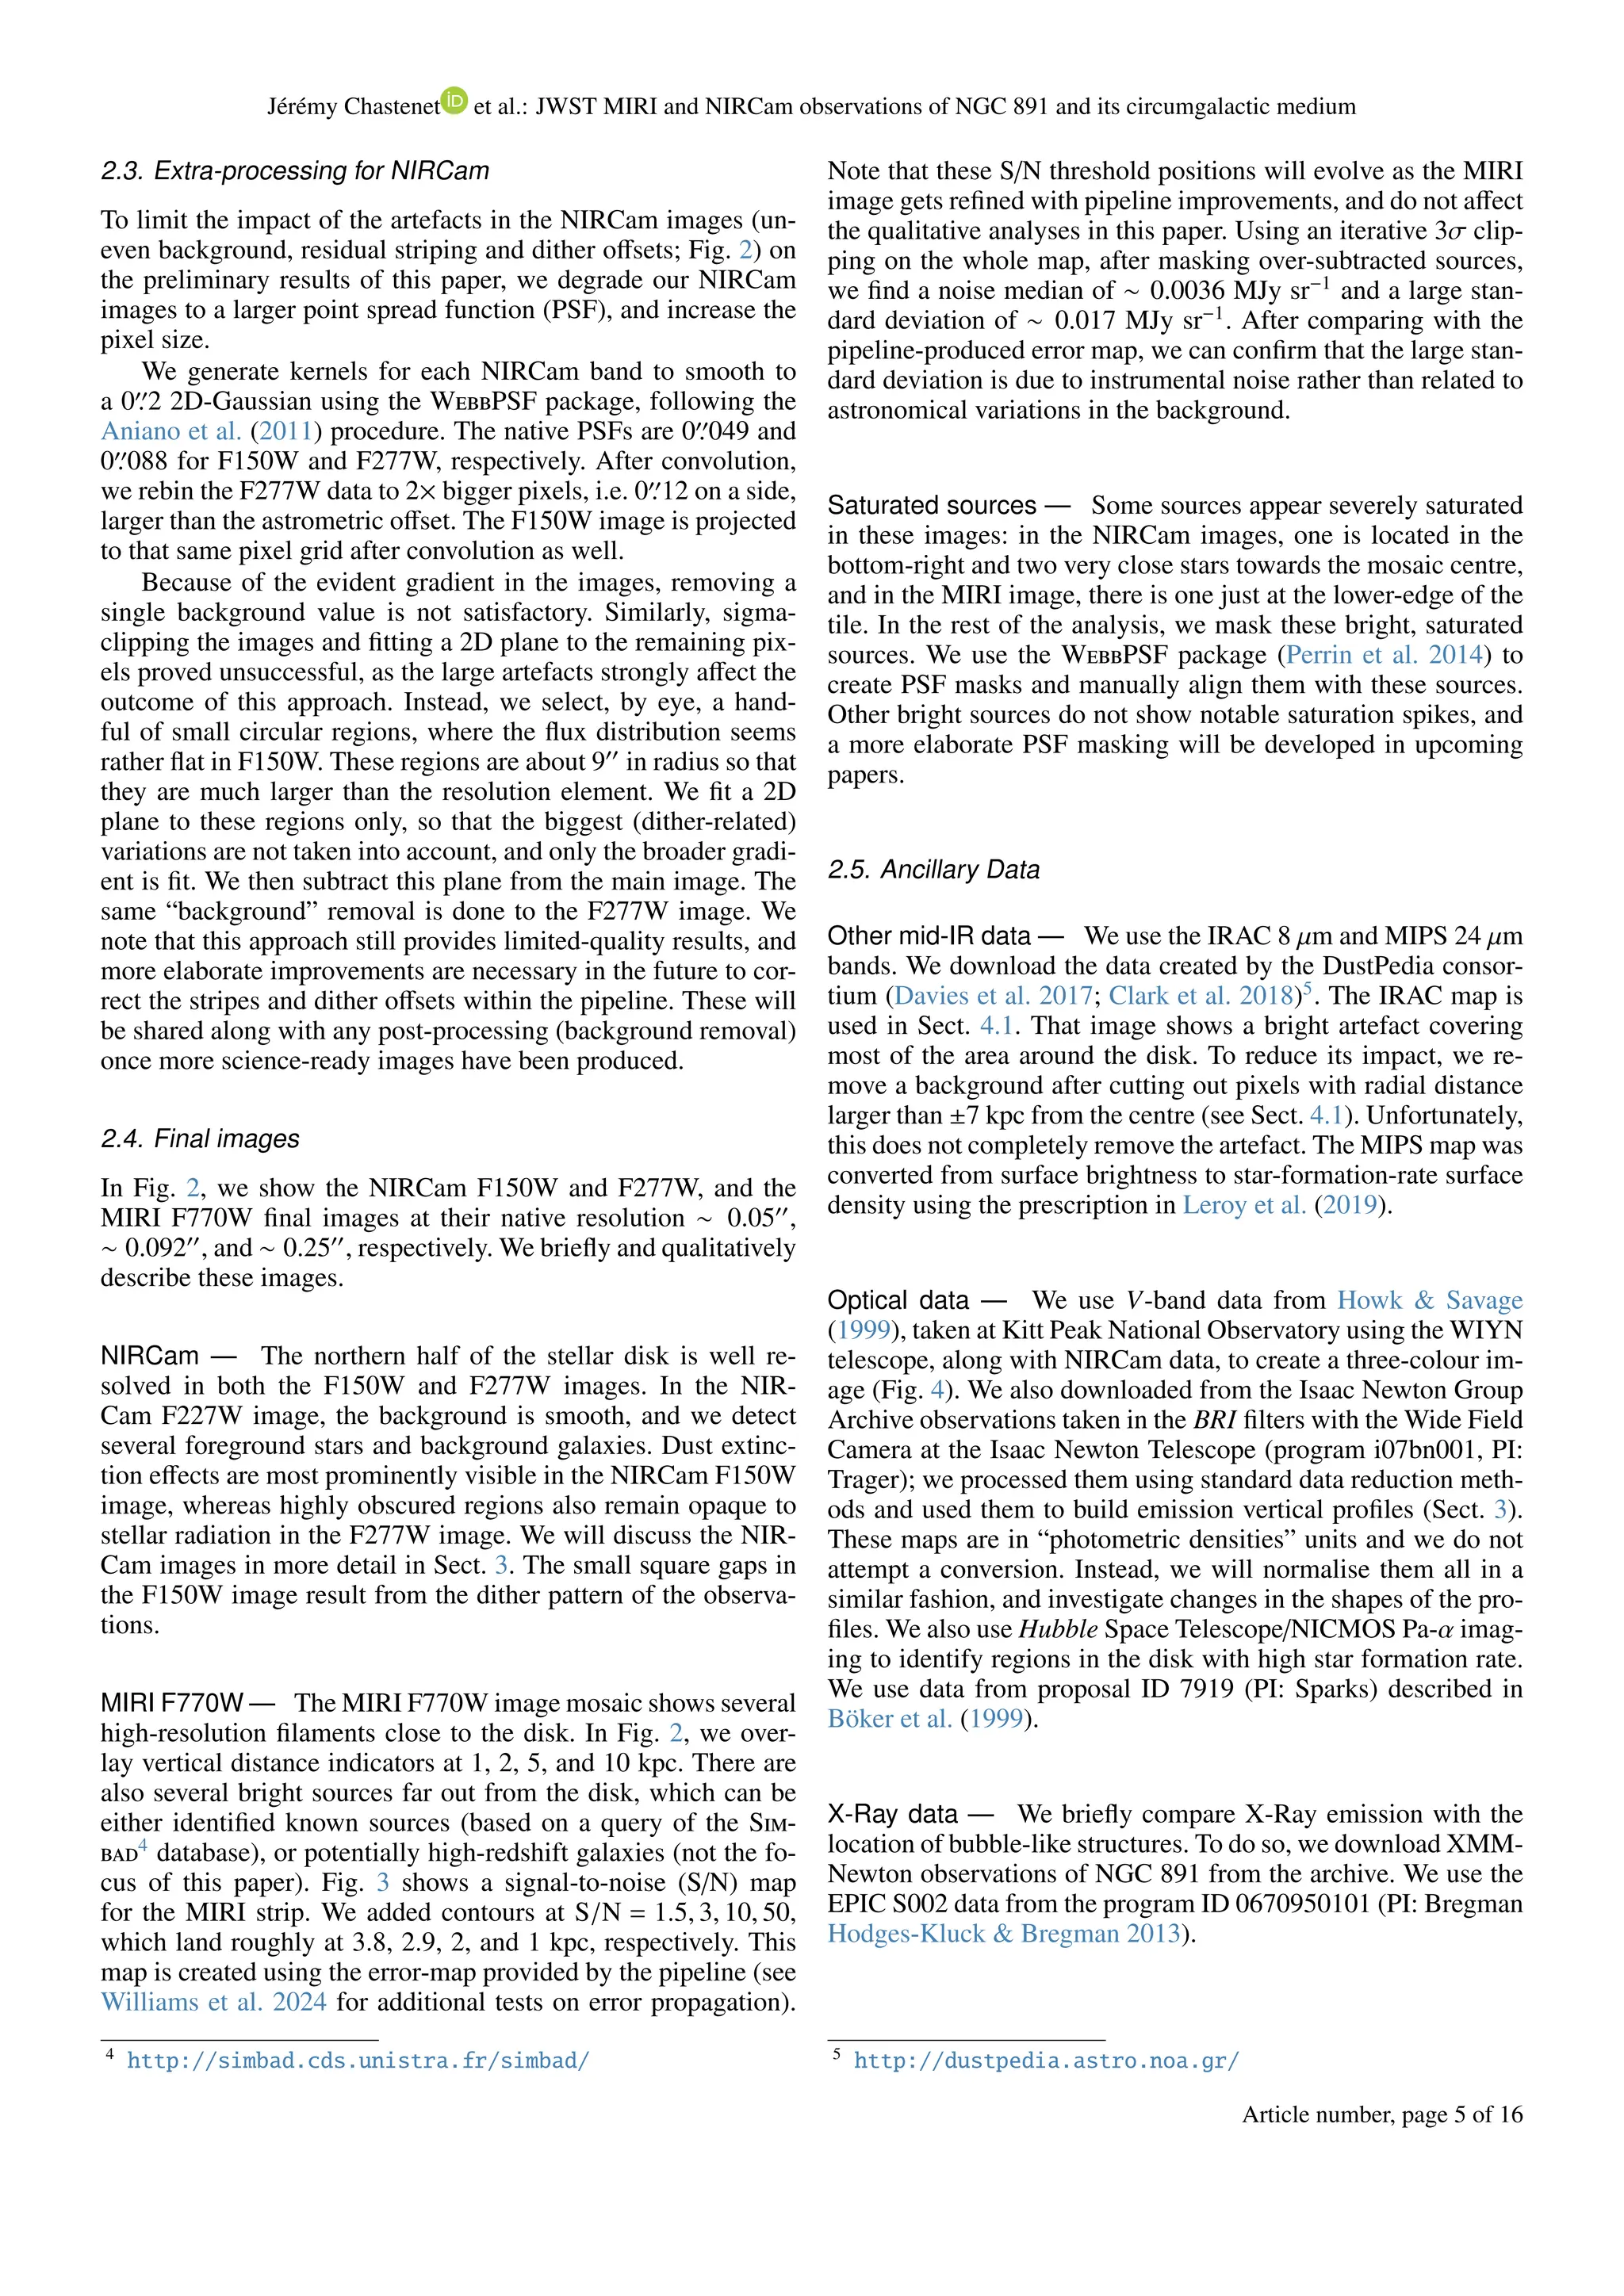
Figure 6 shows the vertical profiles of mid-infrared observa-
tions. We compute the median fluxes in the MIRI F770W map
in bins of distances and fit a double-exponential profile to this
distribution, following
S λ(z) = S d,1 × exp −
z
z1
!
+ S d,2 × exp −
z
z2
!
, (1)
where S λ is the measured surface brightness in MJy sr−1
, z1, z2
are the dust scale-heights, and z is the distance from the disk. In
Fig. 6, the filled symbols are those used for these fits that pass a
3σ S/N cut, and only for z ≤ 2 kpc. The red lines show the fit
to the MIRI F770W data, with the dashed one being a fit with
a single-exponential, and the solid-line with two; the latter leads
to scale-heights of (0.29±0.65, 0.75±0.78) kpc, where the large
uncertainties are due to lack of coverage all the way to the disk.
For reference, we show IRAC and ISO data. In diamond sym-
bols, we show the binned medians of the IRAC 8 image cutting
out pixels further away than ±7 kpc in radius, similarly to what
Article number, page 9 of 16](https://image.slidesharecdn.com/2408-240822150149-34b24ed1/75/JWST-MIRI-and-NIRCam-observations-of-NGC-891-and-its-circumgalactic-medium-9-2048.jpg)
![A&A proofs: manuscript no. aanda
was done in Bocchio et al. (2016). The square symbols show the
binned medians in the ISO 7.7 µm map used by Whaley et al.
(2009). There is an apparent offset between these ancillary data
and the MIRI profile: we point out that there is a clear, bright
artefact in the IRAC 8 image, covering the area we are inter-
ested in. Our efforts have not managed to bring it down to a rea-
sonable, background-like level. Additionally, both the IRAC and
ISO data are at a (much) coarser resolution, with very different
transmission curves, which will inevitably affect the measured
fluxes. Finally, the spatial coverage of these three (MIRI, IRAC,
ISO) datasets is quite different, and sample a large range of (non-
overlapping) radii and altitudes. However, the IRAC profile does
show a very similar shape to that of the MIRI data.
The scale-height of the thick dust disk measured from the
MIRI 7.7 µm map is consistent with values from the literature
around those wavelengths (Whaley et al. 2009; Bocchio et al.
2016, ∼ 0.3 − 0.6 kpc), and suggest a steep decline in the abun-
dance of the smallest dust grains going away from the galaxy
mid-plane further out into the inner CGM. Given the higher
scale-heights inferred for large grains from far-IR and sub-mm
imaging (thick disk: z2 ∼ 1 kpc at 250 µm, Bocchio et al. 2016),
this suggests that the abundance of small grains decreases more
steeply than the mass fraction of large grains with altitude above
the mid-plane (although note that small and large grains will be
sensitive to different illuminating radiation fields). This result
is at odds with results in the literature, including for NGC 891
(Katsioli et al. 2023) and will require further analysis to under-
stand how the small-to-large grain ratio is altered in the disk-halo
connection region of NGC 891 and other galaxies. Note that the
distance threshold at which to stop considering data for expo-
nential fit (here, 2 kpc) has a significant impact on the fit. This is
most likely due to the lack of data all the way to the galaxy mid-
plane, in the case of the MIRI data. Considering that the largest
scale-height is smaller than 1 kpc, the lack of coverage below
that vertical height becomes critical.
4.2. Super-bubbles in NGC 891
On scales of a few tens of parsecs, we are able to discern sev-
eral prominent outflow features above the disk including dusty
chimneys, arcs, and parabolic structures that resemble large-
scale bubbles. Some of these structures are shown in the MIRI
strip, and in zoomed insets in Fig. 7. The first panel (1) reveals
an arc-like structure that resembles the walls of a former super-
bubble after breaking out of the thin disk. The shells in pan-
els (2) and (3) might correspond to similar super-bubbles where
multiple SNe in a star cluster were needed to create a struc-
ture of this size (see, e.g., Barnes et al. 2022, for a discussion
of pre-supernova feedback mechanisms with H ii region sizes).
These bubbles are formed through the continuous energy input
from SNe and stellar feedback processes, and expand into the
surrounding ISM creating a shell of swept up interstellar ma-
terial. While the swept-up material collapses into a cool dense
shell (Castor et al. 1975), the interior of the bubble contains ten-
uous, hot (> 106
K) gas that should be visible in low-energy
X-ray emission. Matching the location of these dusty super-
bubbles with XMM-Newton soft X-ray (0.3–2.0 keV) observa-
tions (Temple et al. 2005), we can see that the shell structure in
panel (3) is filled with low-energy X-ray radiation. This con-
firms our hypothesis that these dense shell correspond to the
walls of super-bubbles. Due to sensitivity limitations, we are un-
able to verify whether the other bubbles further out are similarly
filled with a hot tenuous gas. Examples of such super-bubbles
have been observed in our own Milky Way in the Cygnus super-
0 10 20 30 40 60 80
Distance from disk [00
]
0.0 0.5 1.0 1.5 2.0 2.5 3.0 3.5 4.0
Distance from disk [kpc]
0.01
0.10
1.00
10.0
100.
Surface
brightness
[MJy
sr
1
]
MIRI F770W; double-exp fit
MIRI; single-exp fit
IRAC 8 m
ISO 7.7 m (Whaley et al. 2009)
Fig. 6. Vertical profiles of the MIRI F770W image at native resolu-
tion (red; the MIRI measurements do not extend inward of 0.5 kpc,
Fig. 2), Spitzer/IRAC 8 µm (shades of orange), and ISO 7.7 µm (dark-
orange), with error bars showing one standard deviation in each bin. The
filled symbols mark the ones used for fitting a double-exponential (un-
less mentioned otherwise) profile to the running medians, which must
have S/N ≥ 3. See text for details on the fits.
bubble and Aquila super-shell with diameter sizes of 0.5 − 1 kpc
(Cash et al. 1980; Maciejewski et al. 1996). Similar shells were
already detected through dust extinction in the optical and Hα
emission in NGC 891 with similar super-bubble sizes up to 1 kpc
(e.g., Rossa et al. 2004). The sizes observed here are larger than
those found in a recent study by Watkins et al. (2023). However,
these bubbles are found in a sample of low-inclination galaxies,
and at different radii, which leads to finding different morpholo-
gies and sizes due to the varying galaxy properties.
Within the dense ISM of the thin disk, the shell expansion
will decelerate until the super-bubble breaks out of the thin disk
and can accelerate again in the direction of the pressure gradi-
ent due to the exponential fall off in density—creating a negative
density gradient—above the disk. When the super-bubble accel-
erates into the halo, the interface between the hot bubble inte-
rior and the dense cold shell becomes prone to instabilities such
as Rayleigh-Taylor instabilities creating finger-like structures.
Eventually, turbulent mixing of the two layers will cause the
shell to break up (Baumgartner & Breitschwerdt 2013), which
often leaves structures that resemble dusty chimneys as observed
in NGC 891 (e.g., Howk & Savage 2000). Numerical simulations
of the breakout of super-bubbles (Mac Low & McCray 1988;
Mac Low et al. 1989; Gatto et al. 2015) suggest that the super-
bubble could survive out to 1 to 2 vertical scale heights before
the cold dense shell starts accelerating and will start fragment-
ing.
The top of the super-bubble structure in Panel (3) of Fig. 7
is located about z = 1.3 kpc above the mid plane, while the
super-bubble in Panel (2) extends out to z = 3.2 kpc above
the disk. These bubble have similar sizes compared to the scale
heights of the thin and thick disks in NGC 891. Specifically, the
Article number, page 10 of 16](https://image.slidesharecdn.com/2408-240822150149-34b24ed1/75/JWST-MIRI-and-NIRCam-observations-of-NGC-891-and-its-circumgalactic-medium-10-2048.jpg)
![A&A proofs: manuscript no. aanda
2h22m40s 38s 36s 34s
42°20'40"
20"
00"
19'40"
RA (ICRS)
Dec
(ICRS)
2
3
1
1 kpc
500 pc 250 pc
500 pc
Fig. 7. Cut-out of the MIRI strip closest to the disk in the left panel, with soft X-ray 95th
percentile contours in grey. We bring out three locations
showing visible extended structures in boxes 1 through 3. These are shown on the right hand side, marked with arc-likes structures (by hand).
2h22m38s 36s 34s 32s
42°21'00"
20'40"
20"
00"
RA [J2000]
Dec
[J2000]
SN 1986J
SFR =0.1 M yr 1 kpc 2
IPa =0.2 counts s 1 0.0
0.1
0.5
1.0
1.5
2.0
3.0
4.0
5.0
Surface
brightness
[MJy
sr
1
]
Fig. 8. IRAC 8 µm unsharp-mask, shown in grey, with the MIRI image
overlayed. The white contours show the continuation of the structures in
the IRAC unsharp-mask, nicely following some of the structure visible
in high-resolution in the MIRI map. We show contours of star formation
rate surface density of 0.1 M⊙ yr−1
kpc−2
derived from the MIPS-24 µm
image, and intensity of Pa-α, another tracer of recent star formation.
The cross at the bottom-right shows the location of SN1986J.
cuss what physical conditions are needed for PAHs to survive
out to these large extraplanar distances.
4.5. Survival of PAHs out to 4 kpc
Assuming that the extra-planar emission originates from small
carbonaceous dust, we can ask ourselves how the smallest dust
particles can survive out to 4 kpc above the disk. Typical outflow
velocities of 50 − 75 km s−1
for cold material leaving the disk
have been inferred based on H i data of NGC 891 (Fraternali
& Binney 2006, 2008), and are consistent with velocities esti-
mated from the combined effects of radiation pressure on dust
grains, gravity, and gas drag (Sivkova et al. 2018, and in prep).
This would imply that it takes 50 − 80 Myr for the material to
reach these altitudes above the disk. We note that higher veloci-
ties are plausible, and the currently measured outflow velocities
may furthermore not resemble those that pushed out material out
of the disk in the past. For example, the turbulent mixing of hot
gas with cool clouds can boost the velocities of the cool material
entrained in hot galactic winds. Also, if NGC 891 experienced a
starburst episode before, the star formation feedback may have
been more violent resulting in higher outflow velocities. This im-
plies that our estimated lifetimes (50−80 Myr) for PAHs detected
at 4 kpc above the disk are likely to be considered as strict upper
limits. These dynamical timescales are several orders of magni-
tude longer than the average lifetime of PAHs in a tenuous hot
gas (of the order of 1000 years; Micelotta et al. 2010). This re-
quires that the PAHs must be shielded from harsh environments
in pockets of cool dense regions—manifested as clumpy struc-
tures and cool dense shells around the super-bubbles. PAHs may
also be found in a mixing layer of cool, diffuse ionised gas that
connects the warm gas and the cold dense cloudlets, providing
an additional source of emission. Past works have already shown
the existence of PAHs on the surfaces of cold clouds in hot gas
for long periods (Micelotta et al. 2010).
Simulations (Schneider & Robertson 2017; Tan & Fielding
2024) demonstrate that cold (100 − 1000 K), dense, presumably
dust-rich clouds can be accelerated out of the disk via a variety
of mechanisms, including, e.g., ram pressure from super bubbles.
As these clouds experience hydrodynamic instabilities from the
wind, they are mixed with the hot phase and accelerated, leading
to a multiphase structure, including cold dense clumps closer to
the disk, a cool (104
K) ionised phase that is being accelerated,
and a transient mixed phase (105
K) that either gets incorporated
into the hot phase of the wind or cools back onto the clouds. In
this scenario, the cool, 104
K layer would still be able to shield
small dust grains, but we would expect shattering to be more
Article number, page 12 of 16](https://image.slidesharecdn.com/2408-240822150149-34b24ed1/75/JWST-MIRI-and-NIRCam-observations-of-NGC-891-and-its-circumgalactic-medium-12-2048.jpg)

This document presents new observations from the James Webb Space Telescope (JWST) of the edge-on spiral galaxy NGC 891, focusing on its circumgalactic medium. The study detects dust emission extending up to ~4 kpc from the disk, revealing structures such as filaments and arcs, which suggest feedback-driven galactic winds are crucial in regulating baryonic cycling. The findings underline the long-term survival of dust grains in energetic environments and their role in galaxy evolution.


