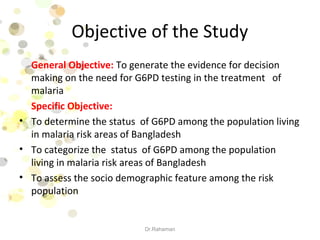
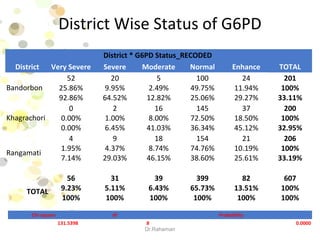
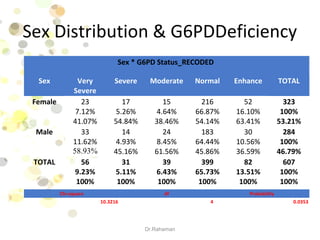
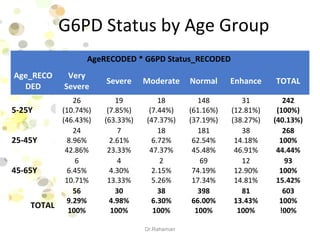
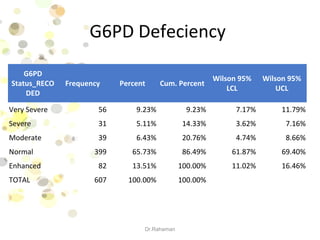
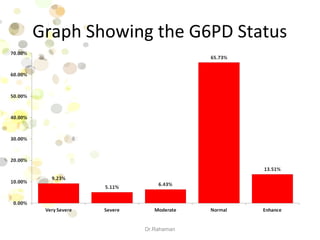
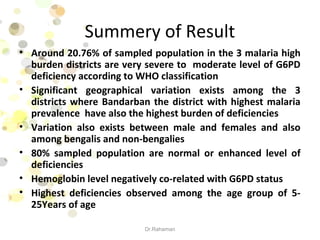
Glucose-6-phosphate dehydrogenase deficiency in people
living in malaria high endemic districts of Bangladesh
Dr.Rahaman
Dr.Md Mosiqure Rahaman Bitu
Epidemiologist,
NMEP
Physiology of G6PD
Dr.Rahaman
Glucose-6-phosphate
6-Phosphogluconate
+NADPH+H+
In case of G6PD deficiency
Inadequate Supply of
NADPH
Reduced Hb oxidation
G6PD Enzyme
G6PD Deficiency Global Scenario
Dr.Rahaman
Objective of the Study
General Objective: To generate the evidence for decision
making on the need for G6PD testing in the treatment of
malaria
Specific Objective:
• To determine the status of G6PD among the population living
in malaria risk areas of Bangladesh
• To categorize the status of G6PD among the population
living in malaria risk areas of Bangladesh
• To assess the socio demographic feature among the risk
population
Dr.Rahaman
Sample Size & Method
A cross-sectional study with 600 samples were under-taken to estimate
the population prevalence of G6PDd in 3 malaria endemic districts of
Bangladesh using CareStart™ G6PD Biosensor. Hemoglobin level of each
patient will be measured by portable hemoglobin meter.
In each district, 2 high endemic upazilas were selected from each district
based on the district health records in coordination with Brac .Then 1
unions were randomly selected from each upazila. A sampling frame
will be prepared from HHs list and 100 HH were selected randomly from
each union. Among the HHs sample were collected following the
inclusion and exclusion criteria. Each upazila team will comprise 1
medical technologist, 1 data collector and 1 field staff supervised by
Research Assistant. Each team collected data from 10 respondents each
day and data collection will be completed by 25 days. Data will be
analyzed in Epi info and the result will be plotted according to WHO
classification of G6PD deficiency. Analysis done by EPI-Info software
Dr.Rahaman
Instrument Used
Dr.Rahaman
Care Start G6PD Biosensor Hemoglobin Meter
WHO Classification
Dr.Rahaman
Age Distribution
Dr.Rahaman
Geographical Distribution
Dr.Rahaman
Frequency Percent Valid Percent
Cumulative
Percent
Bandorbon 201 33.1 33.1 33.3
Khagrachori 199 32.8 32.8 66.1
Rangamati 206 33.9 33.9 100.0
Total 607 100.0 100.0
District
Sex Distribution
Dr.Rahaman
Ethnicity Distribution
Dr.Rahaman-Epidemiologist-NMEP
Educational Status
Education Frequency Percent
Cum.
Percent
Wilson 95%
LCL
Wilson 95%
UCL
B.A 27 4.88% 4.88% 3.38% 7.01%
B.B.S 2 0.36% 5.24% 0.10% 1.31%
B.S.C 1 0.18% 5.42% 0.03% 1.02%
H..S.C 1 0.18% 5.61% 0.03% 1.02%
H.S.C 69 12.48% 18.08% 9.98% 15.49%
J..S.C 1 0.18% 18.26% 0.03% 1.02%
J.S.C 119 21.52% 39.78% 18.30% 25.13%
M.A 13 2.35% 42.13% 1.38% 3.98%
M.S.C 1 0.18% 42.31% 0.03% 1.02%
P.S.C 127 22.97% 65.28% 19.65% 26.65%
Pre Schooling 102 18.44% 83.73% 15.43% 21.89%
S.S.C 90 16.27% 100.00% 13.43% 19.58%
TOTAL 553 100.00% 100.00%
Dr.Rahaman
Occupational Status
Occupation Frequency Percent
Cum.
Percent
Wilson
95% LCL
Wilson
95% UCL
Business 53 8.73% 8.73% 6.74% 11.24%
Fermar 57 9.39% 18.12% 7.32% 11.97%
House Wife 214 35.26% 53.38% 31.56% 39.14%
Labour 31 5.11% 58.48% 3.62% 7.16%
Service 76 12.52% 71.00% 10.12% 15.39%
Student 176 29.00% 100.00% 25.53% 32.73%
TOTAL 607 100.00% 100.00%
Dr.Rahaman
District Wise Status of G6PD
District * G6PD Status_RECODED
District Very Severe Severe Moderate Normal Enhance TOTAL
Bandorbon
52
25.86%
92.86%
20
9.95%
64.52%
5
2.49%
12.82%
100
49.75%
25.06%
24
11.94%
29.27%
201
100%
33.11%
Khagrachori
0
0.00%
0.00%
2
1.00%
6.45%
16
8.00%
41.03%
145
72.50%
36.34%
37
18.50%
45.12%
200
100%
32.95%
Rangamati
4
1.95%
7.14%
9
4.37%
29.03%
18
8.74%
46.15%
154
74.76%
38.60%
21
10.19%
25.61%
206
100%
33.19%
TOTAL
56
9.23%
100%
31
5.11%
100%
39
6.43%
100%
399
65.73%
100%
82
13.51%
100%
607
100%
100%
Dr.Rahaman
Chi-square df Probability
131.5398 8 0.0000
Distribution of G6PD by Ethnicity
Ethnicity * G6PD Status_RECODED
Ethnicity
Very
Severe
Severe Moderate Normal Enhanced TOTAL
Bengali
23
10.27%
41.82%
11
4.91%
35.48%
20
8.93%
54.05%
137
61.16%
34.42%
33
14.73%
40.24%
224
100%
37.15%
Non-
Bengali
32
8.44%
58.18%
20
5.28%
64.52%
17
4.49%
45.95%
261
68.87%
65.58%
49
12.93%
59.76%
379
100%
62.85%
TOTAL
55
9.12%
100%
31
5.14%
100%
37
6.14%
100%
398
66.00%
100%
82
13.60%
100%
603
100%
100%
Dr.Rahaman
Chi-square df Probability
6.6831 4 0.1536
Sex Distribution & G6PDDeficiency
Dr.Rahaman
Sex * G6PD Status_RECODED
Sex Very
Severe
Severe Moderate Normal Enhance TOTAL
Female 23
7.12%
41.07%
17
5.26%
54.84%
15
4.64%
38.46%
216
66.87%
54.14%
52
16.10%
63.41%
323
100%
53.21%
Male 33
11.62%
58.93%
14
4.93%
45.16%
24
8.45%
61.56%
183
64.44%
45.86%
30
10.56%
36.59%
284
100%
46.79%
TOTAL 56
9.23%
100%
31
5.11%
100%
39
6.43%
100%
399
65.73%
100%
82
13.51%
100%
607
100%
100%
Chi-square df Probability
10.3216 4 0.0353
G6PD Status by Age Group
AgeRECODED * G6PD Status_RECODED
Age_RECO
DED
Very
Severe
Severe Moderate Normal Enhance TOTAL
5-25Y
26
(10.74%)
(46.43%)
19
(7.85%)
(63.33%)
18
(7.44%)
(47.37%)
148
(61.16%)
(37.19%)
31
(12.81%)
(38.27%)
242
(100%)
(40.13%)
25-45Y
24
8.96%
42.86%
7
2.61%
23.33%
18
6.72%
47.37%
181
62.54%
45.48%
38
14.18%
46.91%
268
100%
44.44%
45-65Y
6
6.45%
10.71%
4
4.30%
13.33%
2
2.15%
5.26%
69
74.19%
17.34%
12
12.90%
14.81%
93
100%
15.42%
TOTAL
56
9.29%
100%
30
4.98%
100%
38
6.30%
100%
398
66.00%
100%
81
13.43%
100%
603
100%
!00%
Dr.Rahaman
Histogram of Hb(gm/dl)
Dr.Rahaman
G6PD Status
Dr.Rahaman
Relationship between Hb level & G6PD
Dr.Rahaman
Relationship between Hb level & G6PD
Dr.Rahaman
G6PD Status Pearson Correlation 1 -.208**
Sig. (2-tailed) 0.000
N 607 607
Hb level(gm/dl) Pearson Correlation -.208** 1
Sig. (2-tailed) 0.000
N 607 607
**. Correlation is significant at
the 0.01 level (2-tailed).
Relationship between Age & G6PD
Dr.Rahaman
G6PD Defeciency
G6PD
Status_RECO
DED
Frequency Percent Cum. Percent
Wilson 95%
LCL
Wilson 95%
UCL
Very Severe 56 9.23% 9.23% 7.17% 11.79%
Severe 31 5.11% 14.33% 3.62% 7.16%
Moderate 39 6.43% 20.76% 4.74% 8.66%
Normal 399 65.73% 86.49% 61.87% 69.40%
Enhanced 82 13.51% 100.00% 11.02% 16.46%
TOTAL 607 100.00% 100.00%
Dr.Rahaman
Graph Showing the G6PD Status
Dr.Rahaman
Summery of Result
• Around 20.76% of sampled population in the 3 malaria high
burden districts are very severe to moderate level of G6PD
deficiency according to WHO classification
• Significant geographical variation exists among the 3
districts where Bandarban the district with highest malaria
prevalence have also the highest burden of deficiencies
• Variation also exists between male and females and also
among bengalis and non-bengalies
• 80% sampled population are normal or enhanced level of
deficiencies
• Hemoglobin level negatively co-related with G6PD status
• Highest deficiencies observed among the age group of 5-
25Years of age
Dr.Rahaman
Recommendations
• Include of G6PD testing in national malaria treatment guideline
• Determine level of the health care system where G6PD testing and PQ
administration should be Introducing/expanding a G6PD testing system
at country level
• Develop plan for pilot implementation and progressive scale-up.
• Cross-checking the result of this study by using qualitative method
• Behaviour change communication for demand creation among health
care providers and patients
• Pharmacovigilance to strengthen monitoring of Primaquin
administration in combination with other Acute Hemolytic Anaemia-
inducing medicines in G6PD-deficient patient
Dr.Rahaman
Dr.Rahaman

G6 pd analysis

  • 1.
    Glucose-6-phosphate dehydrogenase deficiencyin people living in malaria high endemic districts of Bangladesh Dr.Rahaman Dr.Md Mosiqure Rahaman Bitu Epidemiologist, NMEP
  • 2.
    Physiology of G6PD Dr.Rahaman Glucose-6-phosphate 6-Phosphogluconate +NADPH+H+ Incase of G6PD deficiency Inadequate Supply of NADPH Reduced Hb oxidation G6PD Enzyme
  • 3.
    G6PD Deficiency GlobalScenario Dr.Rahaman
  • 4.
    Objective of theStudy General Objective: To generate the evidence for decision making on the need for G6PD testing in the treatment of malaria Specific Objective: • To determine the status of G6PD among the population living in malaria risk areas of Bangladesh • To categorize the status of G6PD among the population living in malaria risk areas of Bangladesh • To assess the socio demographic feature among the risk population Dr.Rahaman
  • 5.
    Sample Size &Method A cross-sectional study with 600 samples were under-taken to estimate the population prevalence of G6PDd in 3 malaria endemic districts of Bangladesh using CareStart™ G6PD Biosensor. Hemoglobin level of each patient will be measured by portable hemoglobin meter. In each district, 2 high endemic upazilas were selected from each district based on the district health records in coordination with Brac .Then 1 unions were randomly selected from each upazila. A sampling frame will be prepared from HHs list and 100 HH were selected randomly from each union. Among the HHs sample were collected following the inclusion and exclusion criteria. Each upazila team will comprise 1 medical technologist, 1 data collector and 1 field staff supervised by Research Assistant. Each team collected data from 10 respondents each day and data collection will be completed by 25 days. Data will be analyzed in Epi info and the result will be plotted according to WHO classification of G6PD deficiency. Analysis done by EPI-Info software Dr.Rahaman
  • 6.
    Instrument Used Dr.Rahaman Care StartG6PD Biosensor Hemoglobin Meter
  • 7.
  • 8.
  • 9.
    Geographical Distribution Dr.Rahaman Frequency PercentValid Percent Cumulative Percent Bandorbon 201 33.1 33.1 33.3 Khagrachori 199 32.8 32.8 66.1 Rangamati 206 33.9 33.9 100.0 Total 607 100.0 100.0 District
  • 10.
  • 11.
  • 12.
    Educational Status Education FrequencyPercent Cum. Percent Wilson 95% LCL Wilson 95% UCL B.A 27 4.88% 4.88% 3.38% 7.01% B.B.S 2 0.36% 5.24% 0.10% 1.31% B.S.C 1 0.18% 5.42% 0.03% 1.02% H..S.C 1 0.18% 5.61% 0.03% 1.02% H.S.C 69 12.48% 18.08% 9.98% 15.49% J..S.C 1 0.18% 18.26% 0.03% 1.02% J.S.C 119 21.52% 39.78% 18.30% 25.13% M.A 13 2.35% 42.13% 1.38% 3.98% M.S.C 1 0.18% 42.31% 0.03% 1.02% P.S.C 127 22.97% 65.28% 19.65% 26.65% Pre Schooling 102 18.44% 83.73% 15.43% 21.89% S.S.C 90 16.27% 100.00% 13.43% 19.58% TOTAL 553 100.00% 100.00% Dr.Rahaman
  • 13.
    Occupational Status Occupation FrequencyPercent Cum. Percent Wilson 95% LCL Wilson 95% UCL Business 53 8.73% 8.73% 6.74% 11.24% Fermar 57 9.39% 18.12% 7.32% 11.97% House Wife 214 35.26% 53.38% 31.56% 39.14% Labour 31 5.11% 58.48% 3.62% 7.16% Service 76 12.52% 71.00% 10.12% 15.39% Student 176 29.00% 100.00% 25.53% 32.73% TOTAL 607 100.00% 100.00% Dr.Rahaman
  • 14.
    District Wise Statusof G6PD District * G6PD Status_RECODED District Very Severe Severe Moderate Normal Enhance TOTAL Bandorbon 52 25.86% 92.86% 20 9.95% 64.52% 5 2.49% 12.82% 100 49.75% 25.06% 24 11.94% 29.27% 201 100% 33.11% Khagrachori 0 0.00% 0.00% 2 1.00% 6.45% 16 8.00% 41.03% 145 72.50% 36.34% 37 18.50% 45.12% 200 100% 32.95% Rangamati 4 1.95% 7.14% 9 4.37% 29.03% 18 8.74% 46.15% 154 74.76% 38.60% 21 10.19% 25.61% 206 100% 33.19% TOTAL 56 9.23% 100% 31 5.11% 100% 39 6.43% 100% 399 65.73% 100% 82 13.51% 100% 607 100% 100% Dr.Rahaman Chi-square df Probability 131.5398 8 0.0000
  • 15.
    Distribution of G6PDby Ethnicity Ethnicity * G6PD Status_RECODED Ethnicity Very Severe Severe Moderate Normal Enhanced TOTAL Bengali 23 10.27% 41.82% 11 4.91% 35.48% 20 8.93% 54.05% 137 61.16% 34.42% 33 14.73% 40.24% 224 100% 37.15% Non- Bengali 32 8.44% 58.18% 20 5.28% 64.52% 17 4.49% 45.95% 261 68.87% 65.58% 49 12.93% 59.76% 379 100% 62.85% TOTAL 55 9.12% 100% 31 5.14% 100% 37 6.14% 100% 398 66.00% 100% 82 13.60% 100% 603 100% 100% Dr.Rahaman Chi-square df Probability 6.6831 4 0.1536
  • 16.
    Sex Distribution &G6PDDeficiency Dr.Rahaman Sex * G6PD Status_RECODED Sex Very Severe Severe Moderate Normal Enhance TOTAL Female 23 7.12% 41.07% 17 5.26% 54.84% 15 4.64% 38.46% 216 66.87% 54.14% 52 16.10% 63.41% 323 100% 53.21% Male 33 11.62% 58.93% 14 4.93% 45.16% 24 8.45% 61.56% 183 64.44% 45.86% 30 10.56% 36.59% 284 100% 46.79% TOTAL 56 9.23% 100% 31 5.11% 100% 39 6.43% 100% 399 65.73% 100% 82 13.51% 100% 607 100% 100% Chi-square df Probability 10.3216 4 0.0353
  • 17.
    G6PD Status byAge Group AgeRECODED * G6PD Status_RECODED Age_RECO DED Very Severe Severe Moderate Normal Enhance TOTAL 5-25Y 26 (10.74%) (46.43%) 19 (7.85%) (63.33%) 18 (7.44%) (47.37%) 148 (61.16%) (37.19%) 31 (12.81%) (38.27%) 242 (100%) (40.13%) 25-45Y 24 8.96% 42.86% 7 2.61% 23.33% 18 6.72% 47.37% 181 62.54% 45.48% 38 14.18% 46.91% 268 100% 44.44% 45-65Y 6 6.45% 10.71% 4 4.30% 13.33% 2 2.15% 5.26% 69 74.19% 17.34% 12 12.90% 14.81% 93 100% 15.42% TOTAL 56 9.29% 100% 30 4.98% 100% 38 6.30% 100% 398 66.00% 100% 81 13.43% 100% 603 100% !00% Dr.Rahaman
  • 18.
  • 19.
  • 20.
    Relationship between Hblevel & G6PD Dr.Rahaman
  • 21.
    Relationship between Hblevel & G6PD Dr.Rahaman G6PD Status Pearson Correlation 1 -.208** Sig. (2-tailed) 0.000 N 607 607 Hb level(gm/dl) Pearson Correlation -.208** 1 Sig. (2-tailed) 0.000 N 607 607 **. Correlation is significant at the 0.01 level (2-tailed).
  • 22.
    Relationship between Age& G6PD Dr.Rahaman
  • 23.
    G6PD Defeciency G6PD Status_RECO DED Frequency PercentCum. Percent Wilson 95% LCL Wilson 95% UCL Very Severe 56 9.23% 9.23% 7.17% 11.79% Severe 31 5.11% 14.33% 3.62% 7.16% Moderate 39 6.43% 20.76% 4.74% 8.66% Normal 399 65.73% 86.49% 61.87% 69.40% Enhanced 82 13.51% 100.00% 11.02% 16.46% TOTAL 607 100.00% 100.00% Dr.Rahaman
  • 24.
    Graph Showing theG6PD Status Dr.Rahaman
  • 25.
    Summery of Result •Around 20.76% of sampled population in the 3 malaria high burden districts are very severe to moderate level of G6PD deficiency according to WHO classification • Significant geographical variation exists among the 3 districts where Bandarban the district with highest malaria prevalence have also the highest burden of deficiencies • Variation also exists between male and females and also among bengalis and non-bengalies • 80% sampled population are normal or enhanced level of deficiencies • Hemoglobin level negatively co-related with G6PD status • Highest deficiencies observed among the age group of 5- 25Years of age Dr.Rahaman
  • 26.
    Recommendations • Include ofG6PD testing in national malaria treatment guideline • Determine level of the health care system where G6PD testing and PQ administration should be Introducing/expanding a G6PD testing system at country level • Develop plan for pilot implementation and progressive scale-up. • Cross-checking the result of this study by using qualitative method • Behaviour change communication for demand creation among health care providers and patients • Pharmacovigilance to strengthen monitoring of Primaquin administration in combination with other Acute Hemolytic Anaemia- inducing medicines in G6PD-deficient patient Dr.Rahaman
  • 27.