The study investigates the Ranque-Hilsch vortex tube, a device used for producing localized cooling by separating compressed air into hot and cold streams. Utilizing computational fluid dynamics (CFD) with ANSYS Fluent, the research analyzes flow characteristics, pressure, and temperature distributions within the vortex tube, showing that the results align closely with experimental values. The findings indicate that CFD analysis is an effective alternative for understanding the complex flow dynamics of vortex tubes.
![International Journal of Engineering Science Invention
ISSN (Online): 2319 – 6734, ISSN (Print): 2319 – 6726
www.ijesi.org ||Volume 3 Issue 11 || November 2014 || PP.51-55
www.ijesi.org 51 | Page
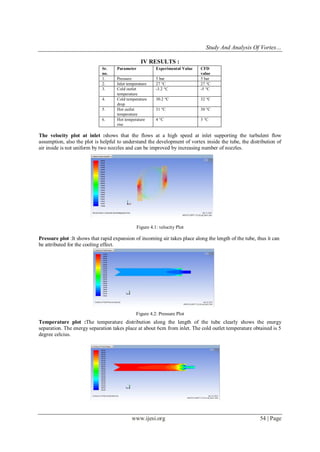
Study and Analysis of Vortex Tube
1,
Prof. Uday V. Aswalekar , 2,
Ritesh S. Solanki , 3,
Vedang S. Kaul , 4,
Shrutika
S. Borkar , 5,
Shankar R. Kambale
1,2,3,4,5,
Department of Mechanical Engineering, Vidyavardhini’s College of Engineering and Technology, Vasai,
Maharashtra, India
ABSTRACT : The Ranque-Hilsch Vortex Tube is a simple mechanical device that produces localized cooling
effect by separating compressed air into hot and cold streams. It is being used in several applications due to its
simplicity, robustness and maintenance free service. Its design still depends on experiment based empirical
relations and thumb rules. Capturing complete flow and energy separation features of vortex tube through
experimentation is difficult due to the complexity associated to flow. Numerical investigation of the vortex tube
presented here intends to bring out unexplored features. The present work is based on vortex tube of L/d ratio
10 having two straight nozzles of circular cross-section. Solid Works 2010 software is used to generate the 3-D
model of cavity domain. The flow is analyzed using ANSYS FLUENT 13.0 wherein the , pressure distribution
and temperature distribution along the length of vortex tube is studied. The pathlines are observed to match
with the theoretically stated generally for vortex tube.
KEYWORDS: Energy separation, Ranque-hilsch, Temperature distribution, Turbulence model, Vortex tube,
L/d ratio, 3-D model, Pathlines.
Nomenclatures :
L = Length of tube
d = Diameter of tube
I. INTRODUCTION
It is one of the non-conventional type refrigerating systems for the production of refrigeration. It
consists of nozzle, diaphragm, valve, hot-air side, cold-air side. Compressed air is passed through the nozzle as
shown in Figure. Here, air expands and acquires high velocity due to particular shape of the nozzle. A vortex
flow is created in the chamber and air travels in spiral like motion along the periphery of the hot side.[2] This
flow is restricted by the valve. When the pressure of the air near valve is made more than outside by partly
closing the valve, a reversed axial flow through the core of the hot side starts from high-pressure region to low-
pressure region. During this process, heat transfer takes place between reversed stream and forward stream.
Therefore, air stream through the core gets cooled below the inlet temperature of the air in the vortex tube, while
air stream in forward direction gets heated up. The cold stream is escaped through the diaphragm hole into the
cold side, while hot stream is passed through the opening of the valve. By controlling the opening of the valve,
the quantity of the cold air and its temperature can be varied.[3] This paper aims at analyzing the flow
characteristics inside vortex tube using ANSYS 13.0 fluent to show the behavior of air inside the tube which is
unpredictable using experimental setups.
Figure 1.1: Schematic diagram of Vortex tube](https://image.slidesharecdn.com/g031102051055-150127034548-conversion-gate01/85/Study-and-Analysis-of-Vortex-Tube-1-320.jpg)
![Study And Analysis Of Vortex…
www.ijesi.org 52 | Page
II. EXPERIMENTAL MODEL OF VORTEX TUBE
Two holes were first made at tangent to the acrylic tube. These two holes acted as a vortex generator
and created a vortex flow when pressurized air was passed through them. The nylon block was then drilled with
a 12mm hole, which was the outside diameter of the acrylic tube. A countersunk hole was then drilled to make
the passage for air and the hose connections. The two silicon tubes were then assembled together and attached to
one end of the acrylic tube. This acted as the cold end of the vortex tube. The conical valve was then made on a
lathe with a taper of 30º. The dimensions were computed empirically using the data given by Prabakaran et
al.[1]
Figure 2.1: Fabricated Experimental tube
Table 1: Dimensions Used For Manufacturing
Table 2: Dimensions used in Solid Modeling
III. NUMERICAL MODEL OF VORTEX TUBE
The length of the fabricated tube is too large to be observed efficiently on the analysis software. As the
software damps the energy and does not give appropriate results. Thus the length of tube is shortened to 8 cm,
ensuring that it will not affect the performance of the tube.
Modeling : A CFD analysis was carried out on the tube fabricated. The fluid domain is constructed in
SOLIDWORKS as shown below :
Figure 3.1: Fluid Cavity Domain
Sr.no. Element Dimension(mm)
1. Tube diameter 8
2. Tube length 420
3. Nozzle diameter 1.5
4. Cold exit
diameter
3
Sr.no. Element Dimension(mm)
1. Tube diameter 8
2. Tube length 80
3. Nozzle diameter 1.5
4. Cold exit
diameter
3](https://image.slidesharecdn.com/g031102051055-150127034548-conversion-gate01/85/Study-and-Analysis-of-Vortex-Tube-2-320.jpg)
![Study And Analysis Of Vortex…
www.ijesi.org 53 | Page
Meshing : This model was then imported in ANSYS WORKBENCH. It was then meshed using ICEM CFD.
An unstructured tetrahedral mesh was created as shown in figure below.
Figure 3.2: Meshing of model
Solver settings :
Assumptions :
[1] The working medium is ideal gas-air
[2] There is no heat interaction of the computation domain with the surroundings
[3] Flow is steady, turbulent and compressible
[4] Body force is negligible
Boundary conditions :
[1] Inlet :
[2] Pressure = 5 bar(gauge)
[3] Hot outlet :
[4] Pressure = 1 bar(gauge)
[5] Cold outlet :
Pressure = 0 bar(gauge)
The solver was set for a three dimensional steady, compressible pressure based SIMPLE scheme with SECOND-
ORDER UPWIND scheme for convective terms and standard k–ε model to capture turbulence. Ideal gas equation
has been activated to capture temperature redistribution occurring due to energy separation.
100 iterations were carried out on this setup. The residue behavior while solving is observed in Figure 5.
It shows that the solution had almost converged for momentum and not for energy. This situation still satisfies the
analysis.
Chart 1: Residual Graph](https://image.slidesharecdn.com/g031102051055-150127034548-conversion-gate01/85/Study-and-Analysis-of-Vortex-Tube-3-320.jpg)
![Study And Analysis Of Vortex…
www.ijesi.org 55 | Page
Pathlines : The pathlines representing the flow path is as shown figure.
Figure 4.4: Pathlines
IV. CONCLUSION
Cold end temperature obtained by CFD = - 5 ºC
Cold end temperature obtained through the model = - 3 ºC
Thus the results obtained through CFD are near to that obtained experimentally
The temperature plot obtained through CFD is same as hat obtained through the model experimentally
The temperature and pressure plot obtained though CFD analysis shows that the stagnation point inside the
tube and far away from the hot end.
This graph shows a comparison of the cold exit temperature drop values obtained from CFD analysis
and experimentally. The CFD values are higher as it accounts ideal conditions, while the experimental values
differ on account of immeasurable uncertainties inherent in the setup and due to limitations of the measuring
instruments. Both the results obtained are within satisfactory limits. Thus CFD analysis is a better way of
analyzing the Vortex tube.
REFERENCES:
[1] Establishing Empirical Relation To Predict Temperature Difference Of Vortex Tube Using Response Surface Methodology,
PRABAKARAN J, VAIDYANATHAN S, KANAGARAJAN D, Journal of Engineering Science and Technology, Vol. 7, No. 6
(2012) 722 - 731 © School of Engineering, Taylor’s University
[2] G.W.Scheper, “The vortex tube; internal flow data and a heat transfer theory,” J ASRE Refrig. Eng., vol. 59, pp. 985–989, 1951.
[3] Ahlborn and S. Groves, “Secondary flow in a vortex tube,” Fluid Dyn. Res., vol. 21(2), pp.73– 86, 1997.
[4] A Textbook of Refrigeration and Air Conditioning by Arora & Domkundwar, Section No 2.1, 8.2, 10.8
[5] Refrigeration and Air Conditioning by R. S. Khurmi, Section No 1.1, 15.2](https://image.slidesharecdn.com/g031102051055-150127034548-conversion-gate01/85/Study-and-Analysis-of-Vortex-Tube-5-320.jpg)


