Downloaded 15 times


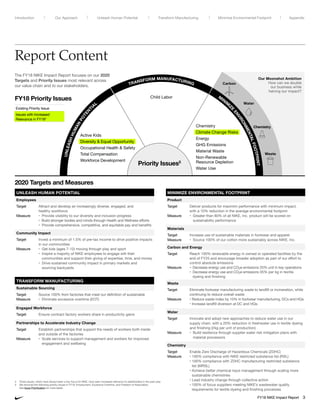


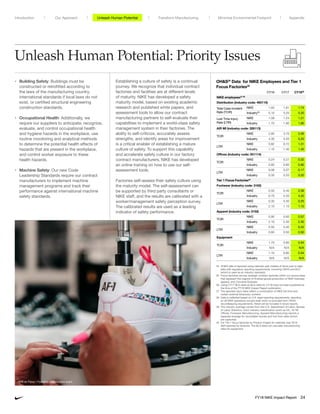

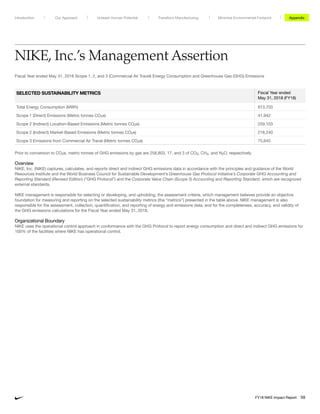
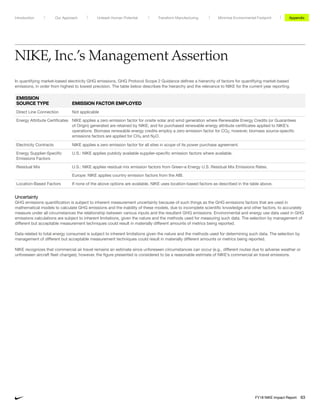
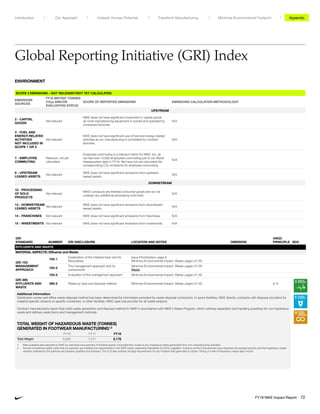
![GENERAL DISCLOSURES
GRI
STANDARD NUMBER GRI DISCLOSURE LOCATION AND NOTES OMISSION
UNGC
PRINCIPLE SDG
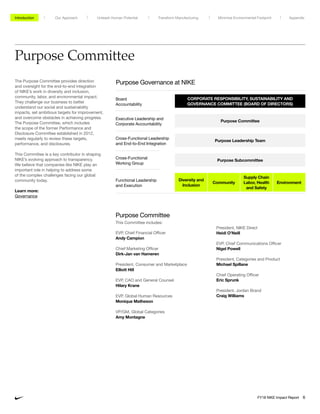
GOVERNANCE 102-18 Governance structure
FY18 Proxy Statement: Corporate Governance: pages 14–23
Purpose Committee: page 6
Sustainability Governance
Additional Information
Corporate Responsibility, Sustainability and Governance Committee
The purpose of the Corporate Responsibility and Sustainability Committee of the Board of Directors of NIKE, Inc. is to review NIKE’s significant strategies, activities, and policies regarding sustainability (including labor
practices), and community impact and charitable activities, and make recommendations to the Board. Learn more.
Responsibilities include:
• Review and provide guidance to management on sustainability issues and impacts, and the integration of sustainability into NIKE’s business, including innovation, product design, manufacturing and sourcing, and
operations.
• Review, provide guidance to management, and report to the Board on sustainability (including labor practices) within NIKE’s supply chain, and review reports of NIKE’s sustainability audits.
• Review and provide guidance to management regarding NIKE’s work with industry organizations and non-governmental organizations concerning corporate responsibility.
• Annually review the activities of the NIKE Foundation and NIKE community impact initiatives.
• Review and make recommendations to management on reporting to shareholders and other communities regarding corporate responsibility activities.
• Review, provide guidance to management, and report to the Board regarding the involvement of significant corporate responsibility issues in major business decisions, to protect NIKE’s valuable goodwill, and
human and intellectual capital.
• Review and make recommendations to the Board with respect to any shareholder proposal that relates to the matters overseen by the Committee.
• Annually evaluate the performance of the Committee and report the results of the evaluation to the Board.
• Review and assess annually the adequacy of the Committee’s charter.
• Perform such other duties and functions as may, from time to time, be assigned to the Committee by the Board.
102-29
Identifying and managing economic,
environmental, and social impacts
FY18 10-K: Item 1A. Risk Factors: pages 60–67 (Annual Report)
FY18 10-K: Risk Management and Derivatives: pages 113–116 (Annual Report)
Minimize Environmental Impact: Energy and Carbon: pages 41–46
102-30 Effectiveness of risk management processes Minimize Environmental Impact: Energy and Carbon: pages 41–46
STAKEHOLDER
ENGAGEMENT
102-40 List of stakeholder groups
Issue Prioritization: page 8
Partnerships Collaborations
102-41 Collective bargaining agreements FY18 10-K: Item 1. Business: page 59
102-42 Identifying and selecting stakeholders Partnerships Collaborations
102-43 Approach to stakeholder engagement
See below
Partnerships Collaborations
Sustainability Governance
102-44 Key topics and concerns raised Issue Prioritization: page 8
REPORTING
PRACTICE
102-45
Entities included in the consolidated financial
statements
About This Report: page 2
FY18 10-K: Item 1. Business: page 55 (Annual Report)
102-46 Defining report content and topic Boundaries Issue Prioritization: page 8
102-47 List of material topics Issue Prioritization: page 8
Global Reporting Initiative (GRI) Index
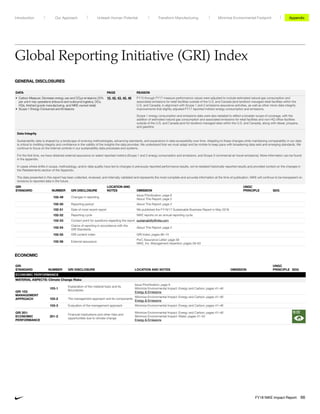
102-48 Restatements of information
In cases where shifts in scope, methodology, and/or data quality have led
to changes in previously reported performance results, we’ve restated
historically reported results. Details are provided below.
DATA PAGE REASON
Employee Data 14–15 All previously reported data was restated to show calendar year figures instead of fiscal year figures.
Occupational Health Safety Industry Rates Codes 24 CY17 Industry Rates were adjusted to align with CY17 BLS rates, as at the time of NIKE’s FY16/17 Sustainable Business
Report publication, CY17 BLS rates hadn’t yet been published and CY16 BLS rates were used instead.
The Air MI Industry Code changed from 326100 (Plastics product manufacturing) to 326113 (Unlaminated plastics film and
sheet [except packaging] manufacturing) to reflect a more accurate classification of the current manufacturing practices at
NIKE, Inc. facilities.
The Offices Industry Code changed from 561400 (Business Support Services) to 551114 (Corporate, subsidiary, and
regional managing offices), which reflects a more accurate classification of the current NIKE, Inc. office activities.
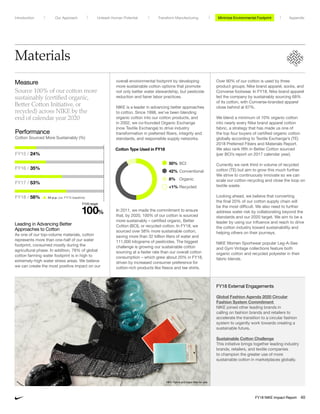
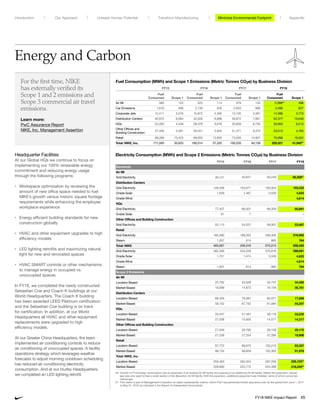
• Materials Target: Increase use of more sustainable materials
• Materials Measure: Source 100% of our cotton more sustainably
(certified organic, better cotton initiative or recycled) across NIKE
by the end of calendar year 2020
10, 38, 39, 40 FY16 and 17 target and measure performance values were adjusted, along with underlying reported cotton and polyester
volumes. Due to data availability limitations in the past, we reported Fall through Summer product in each fiscal year’s
performance value (e.g. FY17 was reported as FA16–SU17). To align with the 2020 target year Spring through Holiday 20
(SP–HO20), we’re now able to report SP–HO product for each fiscal year. Additionally, an error discovered in underlying
data was corrected and the source for some material volume data was shifted.
• Waste Target: Eliminate footwear manufacturing waste to landfill
or incineration, while continuing to reduce overall waste.
• Waste Measure: Reduce waste index by 10%, covering footwear
manufacturing, distribution centers, and headquarter locations
10, 47, 48, 50 FY17 target and measure performance values were adjusted, along with underlying reported manufacturing waste volumes.
The changes are due to improved data integrity and alignment with NIKE guidelines/definitions.
Unleash Human Potential Transform ManufacturingIntroduction Our Approach Appendix
FY18 NIKE Impact Report 65
Minimize Environmental Footprint](https://image.slidesharecdn.com/fy18nikeimpact-reportfinal-190801065637/85/FY18-NIKE-Inc-Impact-Report-66-320.jpg)
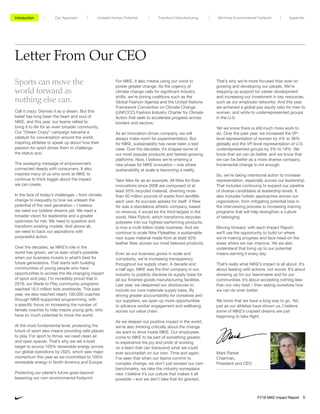
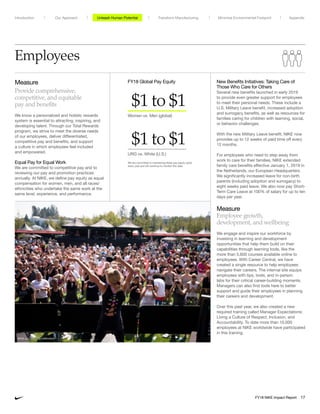
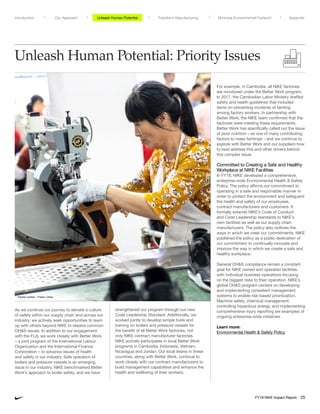
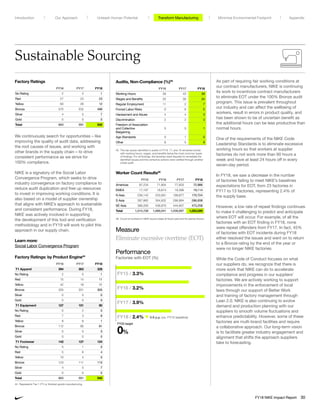
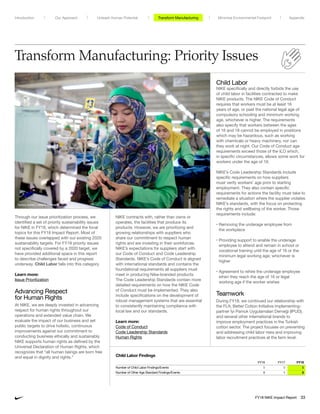
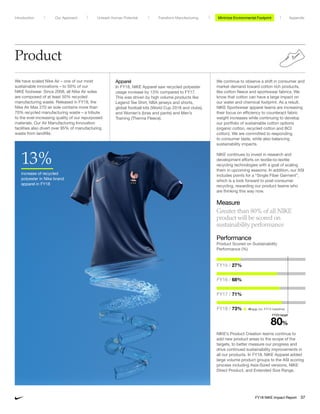
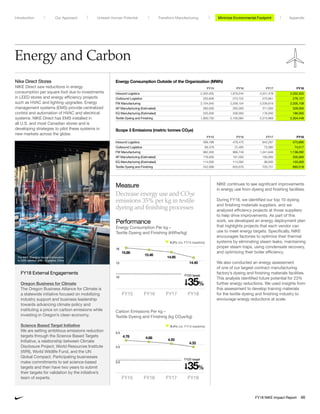
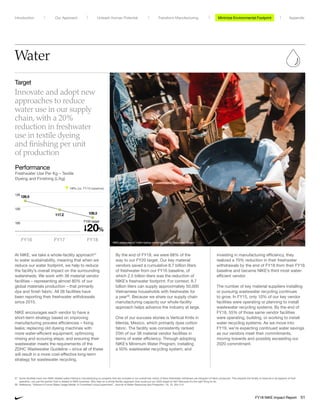
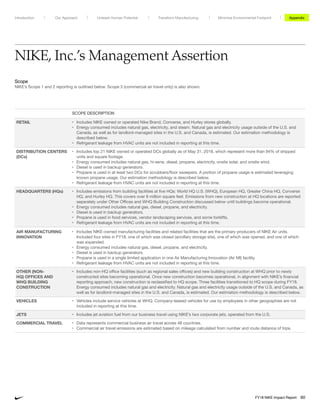
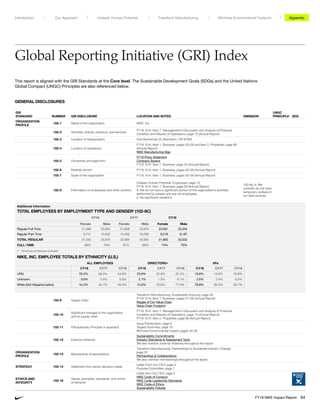
![ENVIRONMENT
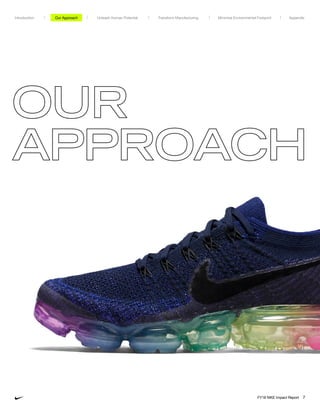
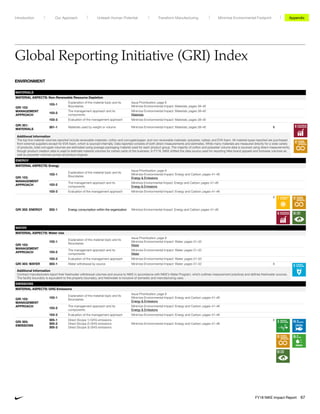
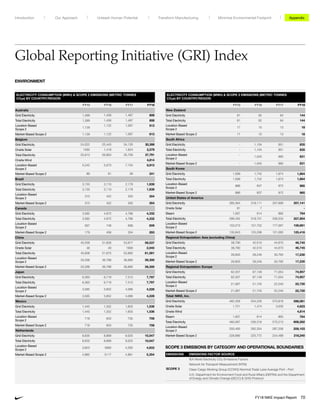
SCOPE 3 EMISSIONS IN SCOPE OF MOONSHOT AMBITION
EMISSIONS
SOURCES
FY18 METRIC TONNES
CO2e AND/OR
EVALUATION STATUS
SCOPE OF REPORTED EMISSIONS EMISSIONS CALCULATION METHODOLOGY
UPSTREAM
1 - PURCHASED
GOODS AND
SERVICES
10,497,428
Includes emissions across Nike brands and product
engines, including from raw materials production, materials
manufacturing, materials finishing, and finished goods
manufacturing.
Emissions data is calculated using primary activity data and extrapolations. CO2e emissions
include CO2, CH4, and N2O. Nike Brand and Converse footwear finished goods manufacturing
emissions data is derived from 100% primary data and represents nearly 90% of the emissions in
finished goods manufacturing. For this subset, vendors provide monthly energy consumption: from
the local utility grid, onsite generators, other fuels, and purchased steam. For electricity: kWh values
are multiplied by CO2e emissions factors for electricity purchased from the local utility grid by the
country/region the factory resides in. For onsite generation and other fuels: CO2e emissions are
calculated using the IPCC bottoms up calculation methodology. CO2e methodologies are used for
emissions estimates outside of footwear finished goods manufacturing based on lifecycle analysis
data and employ conservative assumptions to avoid understating NIKE’s footprint.
4 -
TRANSPORTATION
AND DISTRIBUTION
(UPSTREAM)
647,907
Includes ~95% of global inbound transportation and ~90%
of global outbound transportation via the following modes of
transportation: air, ocean, truck, and rail. Excludes non-NIKE
paid freight.
Transactional data is applied to a third-party transportation carbon calculator against industry
standard emissions factors. For Air: Distance traveled (km) x cargo weight (kg) x Emission factor [g
of CO2/ (TEU x km)]. For all other modes: Distance traveled (km) x cargo volume (TEU) x Emission
factor [g of CO2/ (TEU x km)].
6 - BUSINESS
TRAVEL
75,6451
Includes emissions from commercial air travel.
Air CO2 emissions are estimated based on number and distance of trips. Short haul trips are less
fuel efficient per mile flown. Longer-haul flights become less efficient due to the need to carry
more fuel.
DOWNSTREAM
12 - END-OF-LIFE
TREATMENT OF
SOLD PRODUCTS
448,759
These emissions are associated with the disposal of products
including landfill, recycling, and incineration.
There is no primary emissions data available for end of life treatment of NIKE’s products. To evaluate
NIKE’s value chain footprint, we identified and quantified CO2e emissions created at each stage
of the value chain. The impact of each individual product differs considerably, based on its profile,
materials used, size and weight, method of manufacture, and location of production, use and
disposal. Several internal and external tools were used to develop this estimation including NIKE’s
Business and Environmental Scenario Tool (BEST), Enablon database, NIKE’s Apparel Sustainability
Index, NIKE’s Footwear Sustainability Index, and NIKE’s Materials Sustainability Index. End of Life
Stage: at the disposal stage we assumed the finished good is disposed of at the end of one year.
5 - WASTE
GENERATED
IN OPERATIONS
2,245
Emissions relative to the fate of the waste generated in our own
operations including HQs and DCs.
Total HQs and DC waste not diverted from landfill multiplied by a lifecycle assessment-based
emission factor for municipal waste sent to landfill.
9 -
TRANSPORTATION
AND DISTRIBUTION
(DOWNSTREAM)
113,173
Includes emissions from non-NIKE paid freight. Excludes
emissions from consumers traveling to stores.
Transactional data is applied to a third-party transportation carbon calculator against industry
standard emissions factors. For Air: Distance traveled (km) x cargo weight (kg) x Emission factor [g of
CO2/ (TEU x km)]. For all other modes: Distance traveled (km) x cargo volume (TEU) x Emission factor
[g of CO2/ (TEU x km)]. Non-NIKE paid freight is determined by subtracting NIKE-paid inbound and
outbound freight from total units, separately.
11 - USE OF
SOLD PRODUCTS
8,090,266
These emissions are associated with washing and drying
NIKE’s sold apparel and socks. We assumed for the value
chain footprint exercise that footwear and equipment were
not washed. Based on our footprinting work, we estimate
that about 36% of the emissions throughout our value chain
are emitted during the use phase of NIKE products. These
emissions are out of scope of NIKE’s moonshot ambition.
There is no primary emissions data available from use of NIKE’s products. To evaluate NIKE’s value
chain footprint, we identified and quantified CO2e emissions created at each stage of the value
chain. The impact of each individual product differs considerably, based on its profile, materials
used, size and weight, method of manufacture, and location of production, use, and disposal.
Several internal and external tools were used to develop this estimation including NIKE’s Business
and Environmental Scenario Tool (BEST), Enablon database, NIKE’s Apparel Sustainability Index,
NIKE’s Footwear Sustainability Index, and NIKE’s Materials Sustainability Index. Consumer Usage:
Water and Energy Usage was estimated based on the following assumptions – only apparel units
and socks were considered. Each item was assumed washed 52 times in one year. The washing
assumptions were based on regional consumer washing practices and estimates of washing
machine types by region. CO2e was based on regional conversion factors applied to the estimated
energy usage.
1 This metric is part of Management’s Assertion on select sustainability metrics, which PwC has performed limited assurance over for the period from June 1, 2017 to May 31, 2018, as indicated in the Report of Independent Accountants.
Global Reporting Initiative (GRI) Index
SCOPE 3 EMISSIONS BY CATEGORY AND OPERATIONAL BOUNDARIES
Unleash Human Potential Transform ManufacturingIntroduction Our Approach Appendix
FY18 NIKE Impact Report 71
Minimize Environmental Footprint](https://image.slidesharecdn.com/fy18nikeimpact-reportfinal-190801065637/85/FY18-NIKE-Inc-Impact-Report-72-320.jpg)

The FY18 Nike, Inc. Impact Report outlines the company's commitment to transparency and sustainability, focusing on its corporate responsibility initiatives and progress towards its 2020 targets. Key areas of emphasis include reducing environmental impact, enhancing workforce diversity, and investing in community programs, with specific goals for sustainable sourcing and renewable energy adoption. Nike aims to address pressing global challenges, such as climate change, while engaging stakeholders through a clear framework for accountability and continual improvement.


