Download as PDF, PPTX


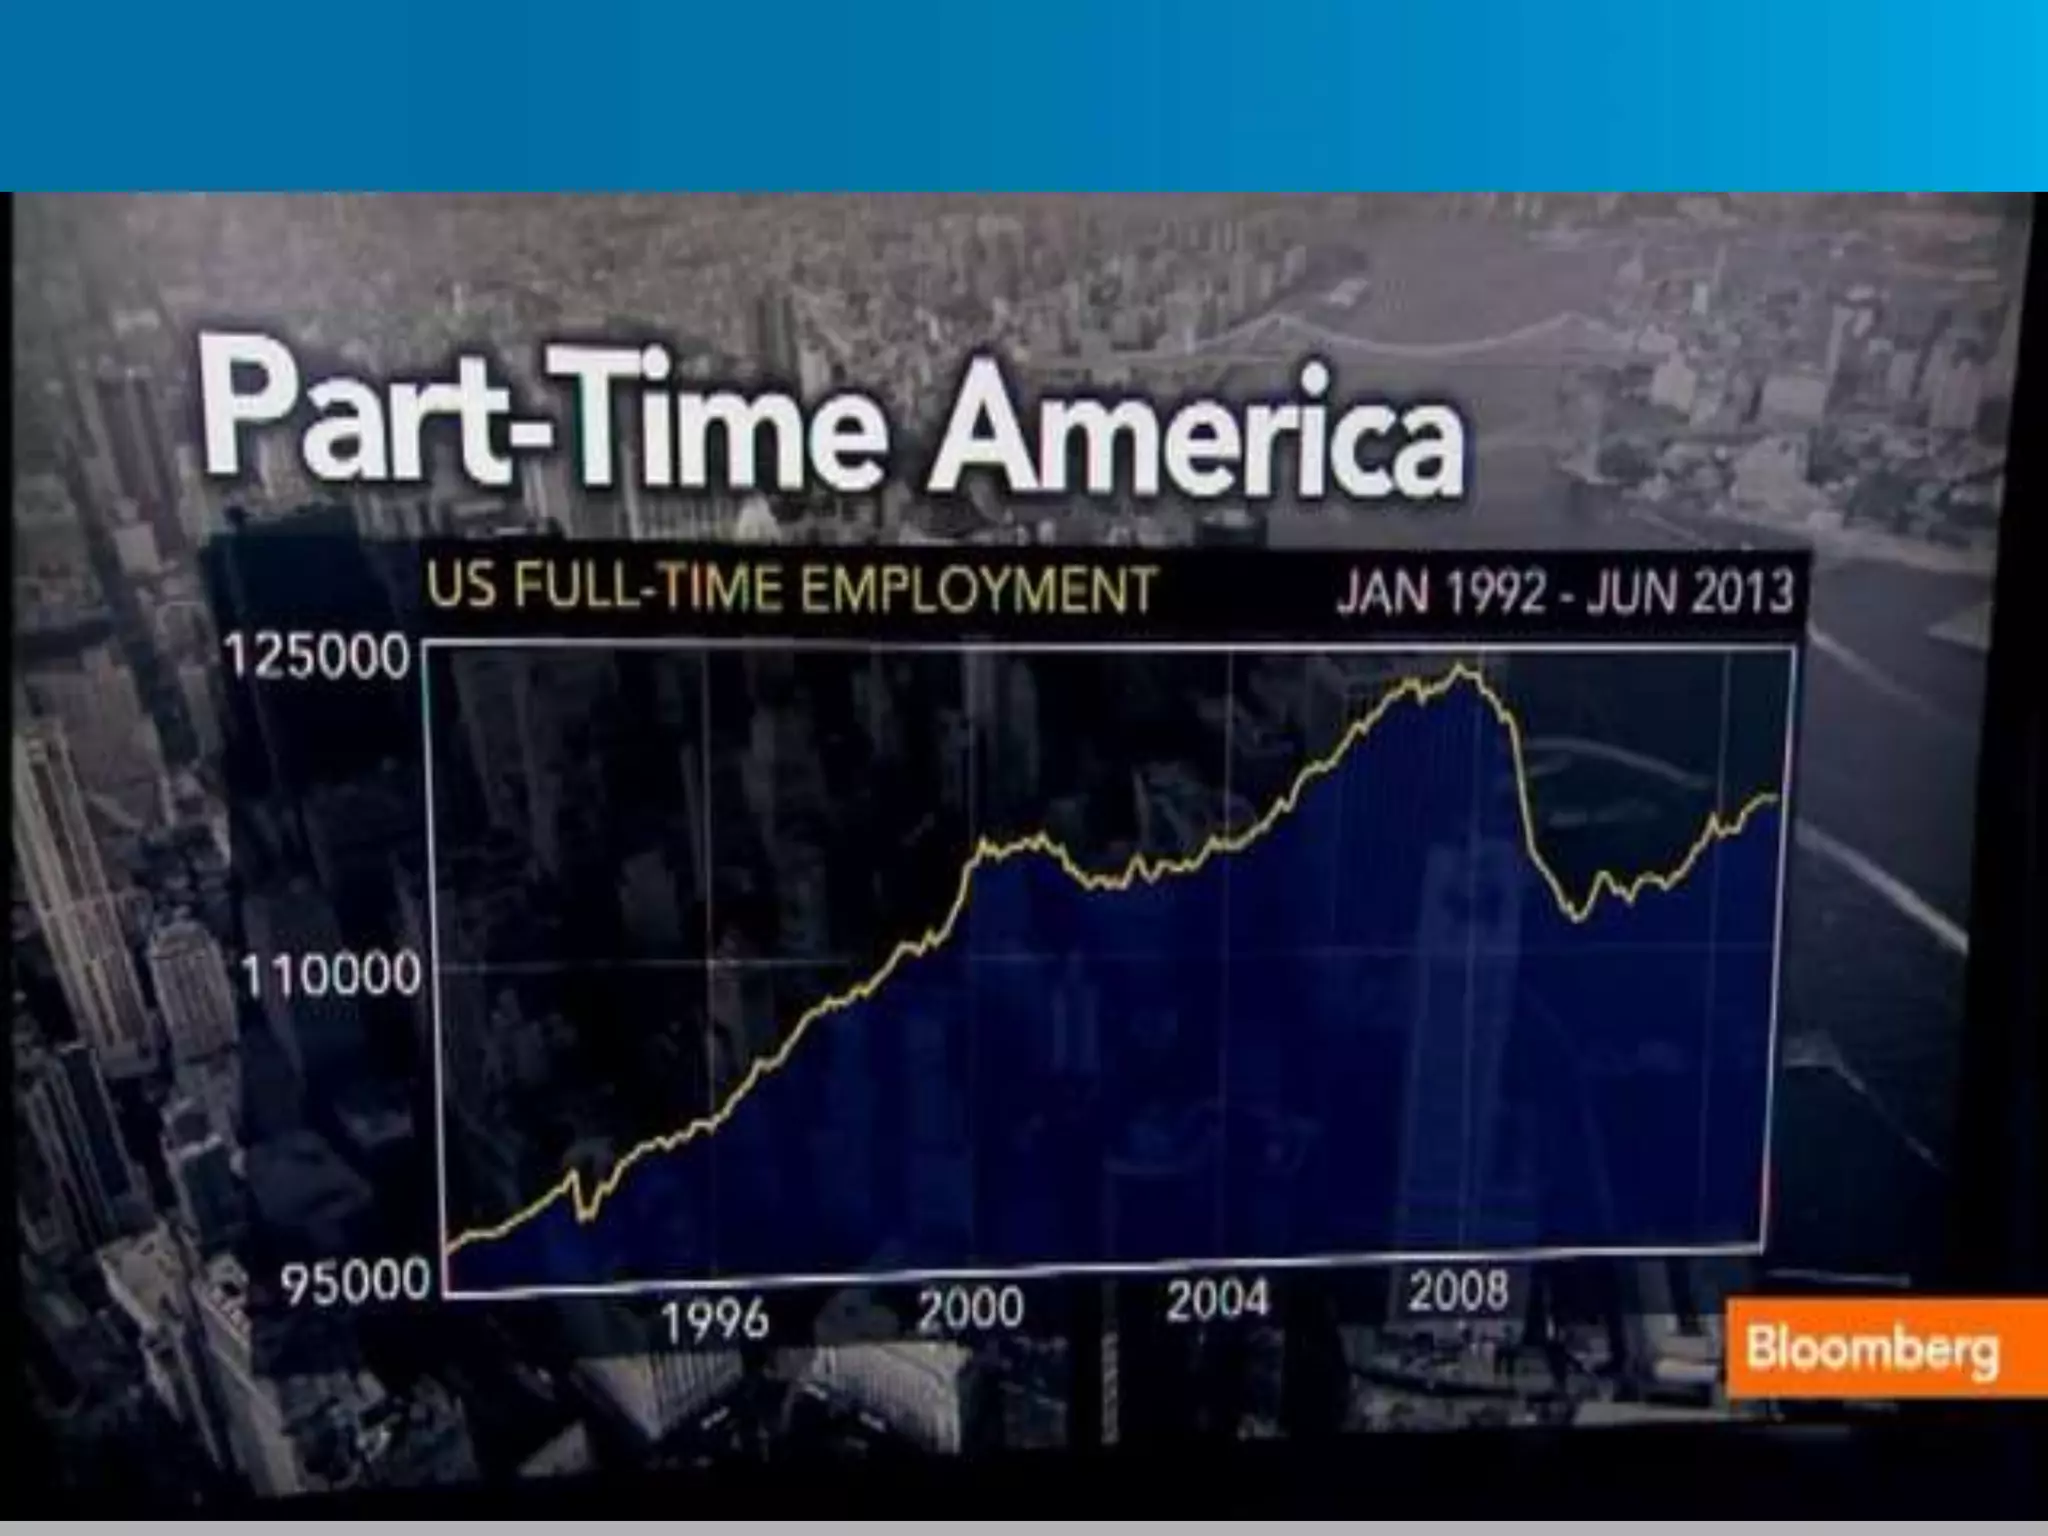
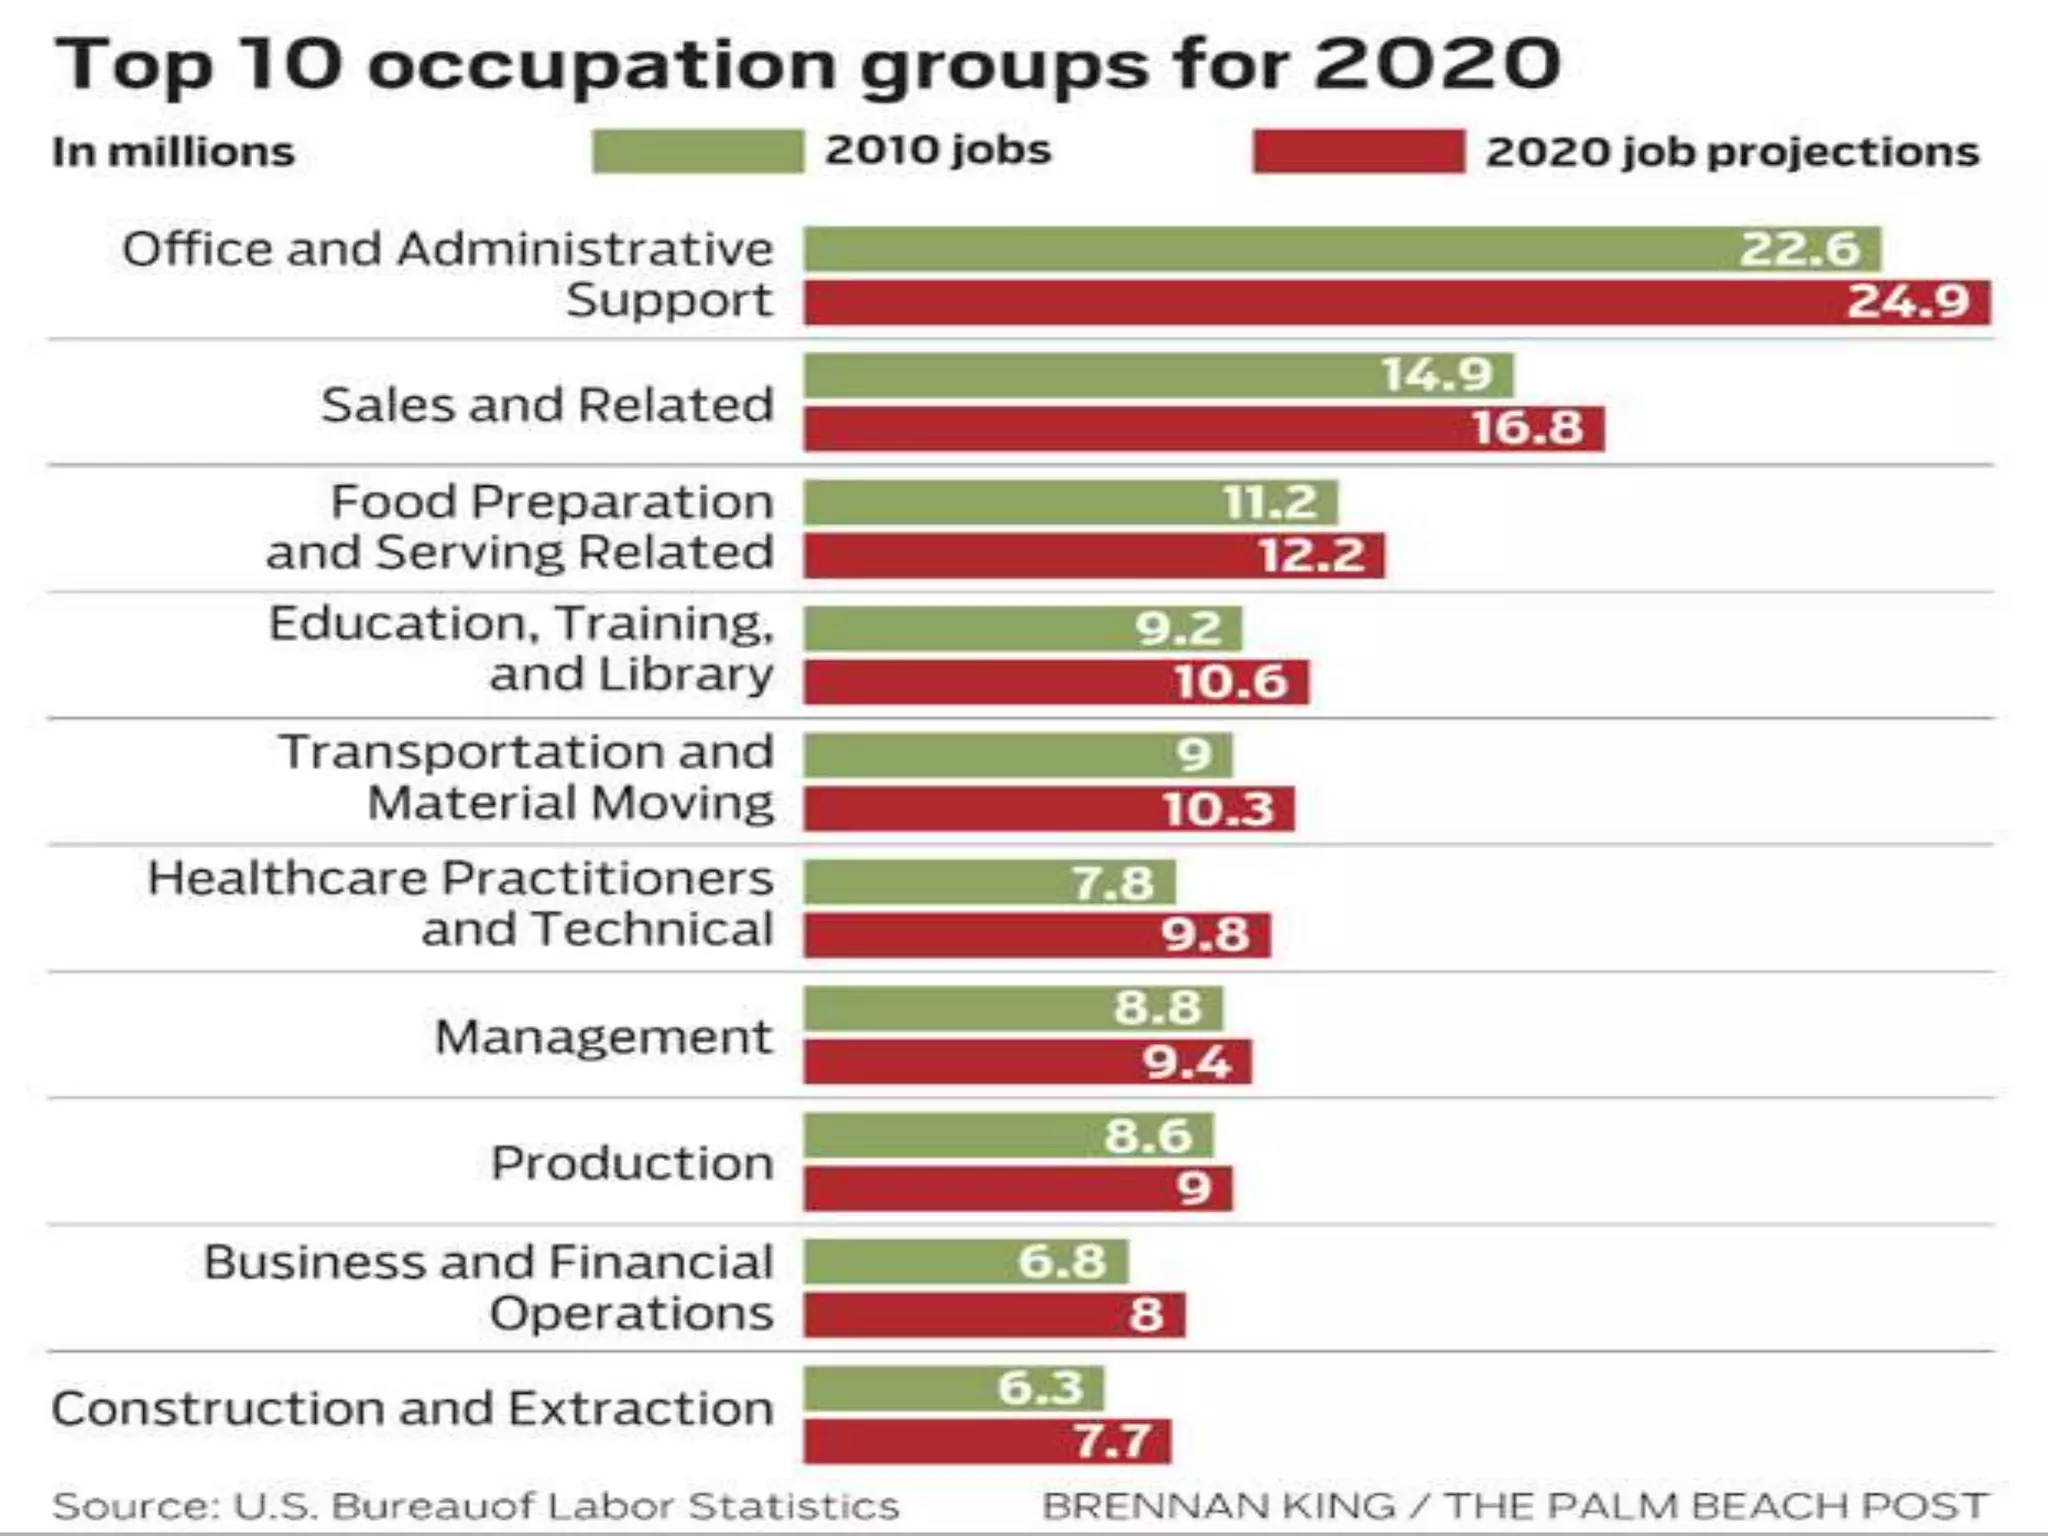
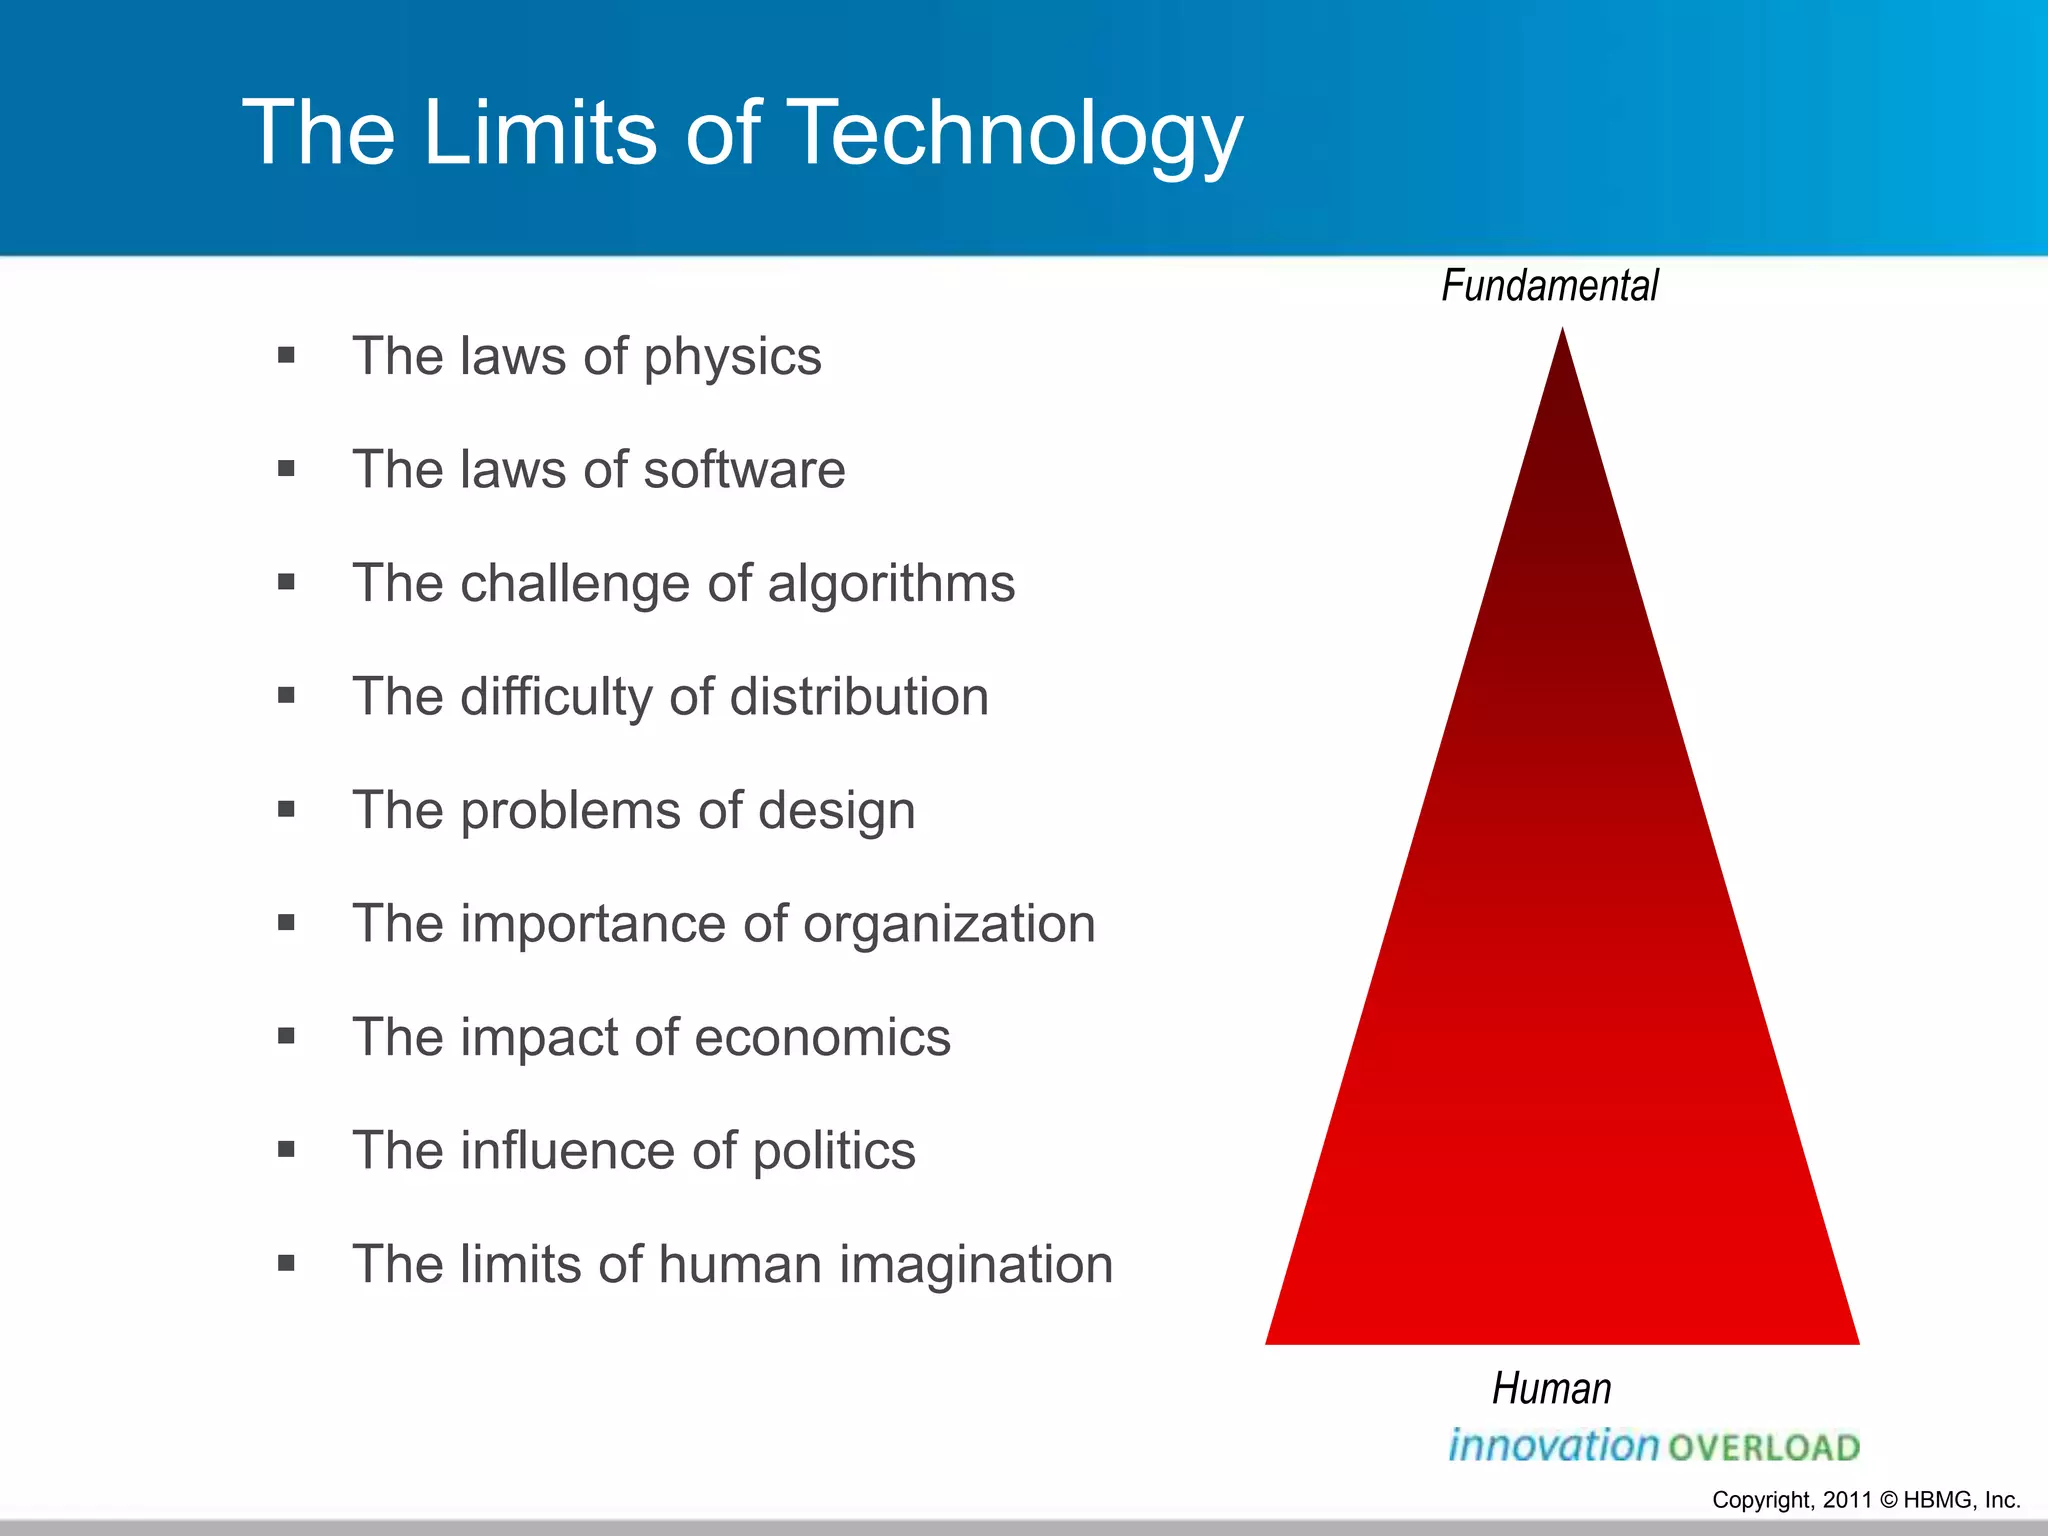
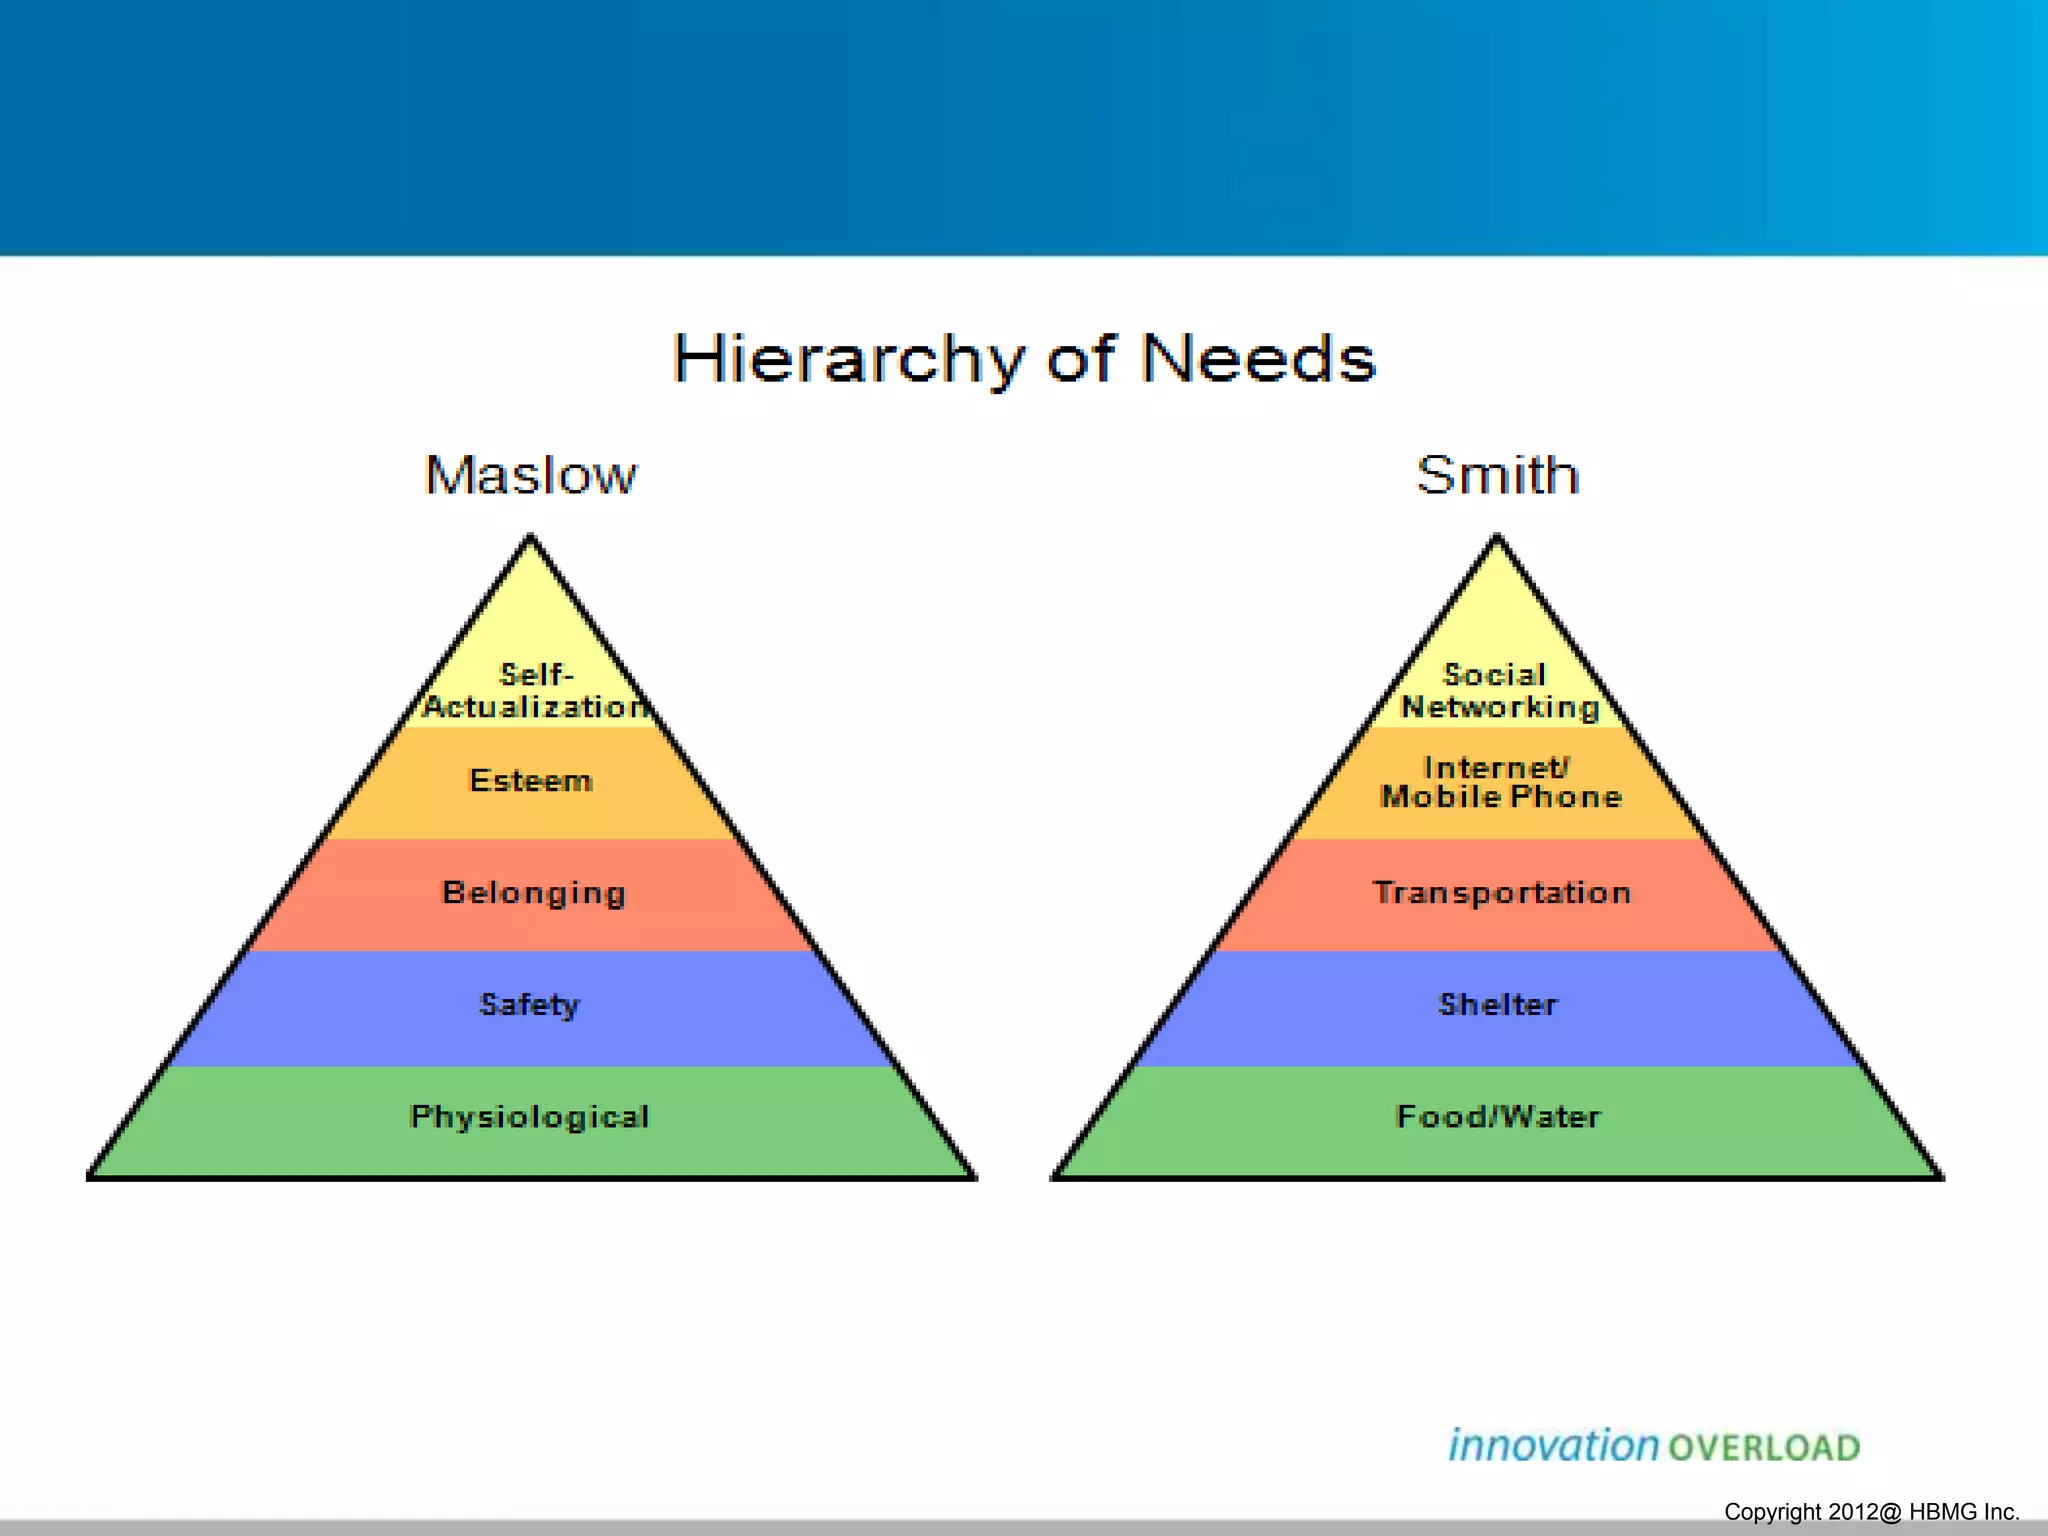
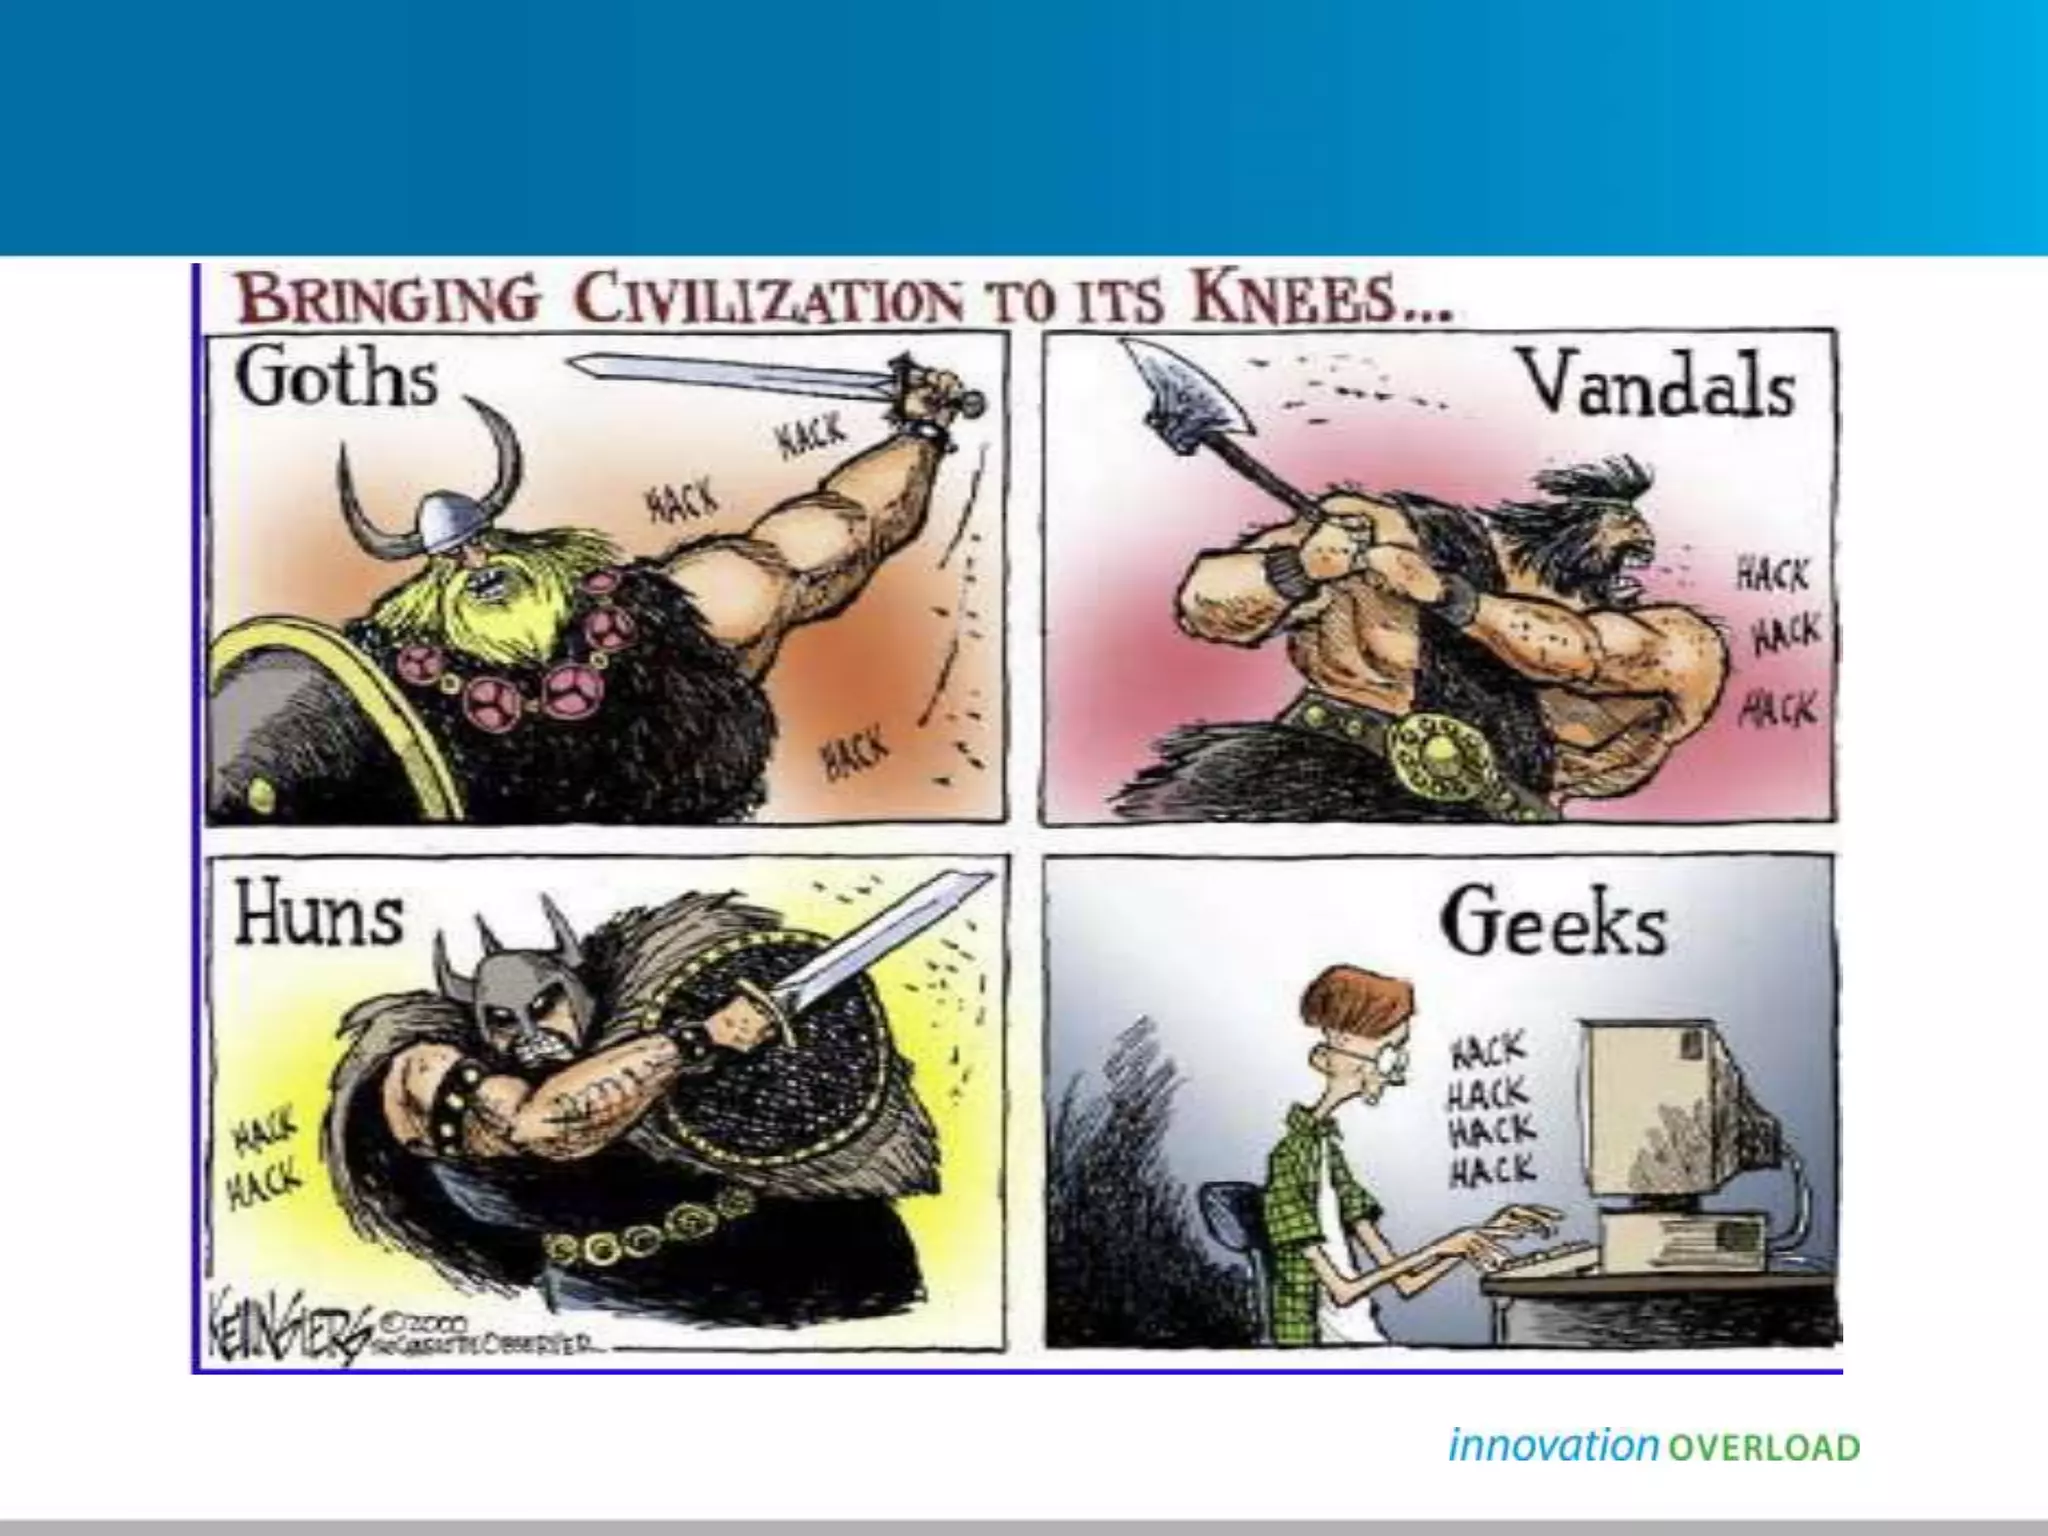
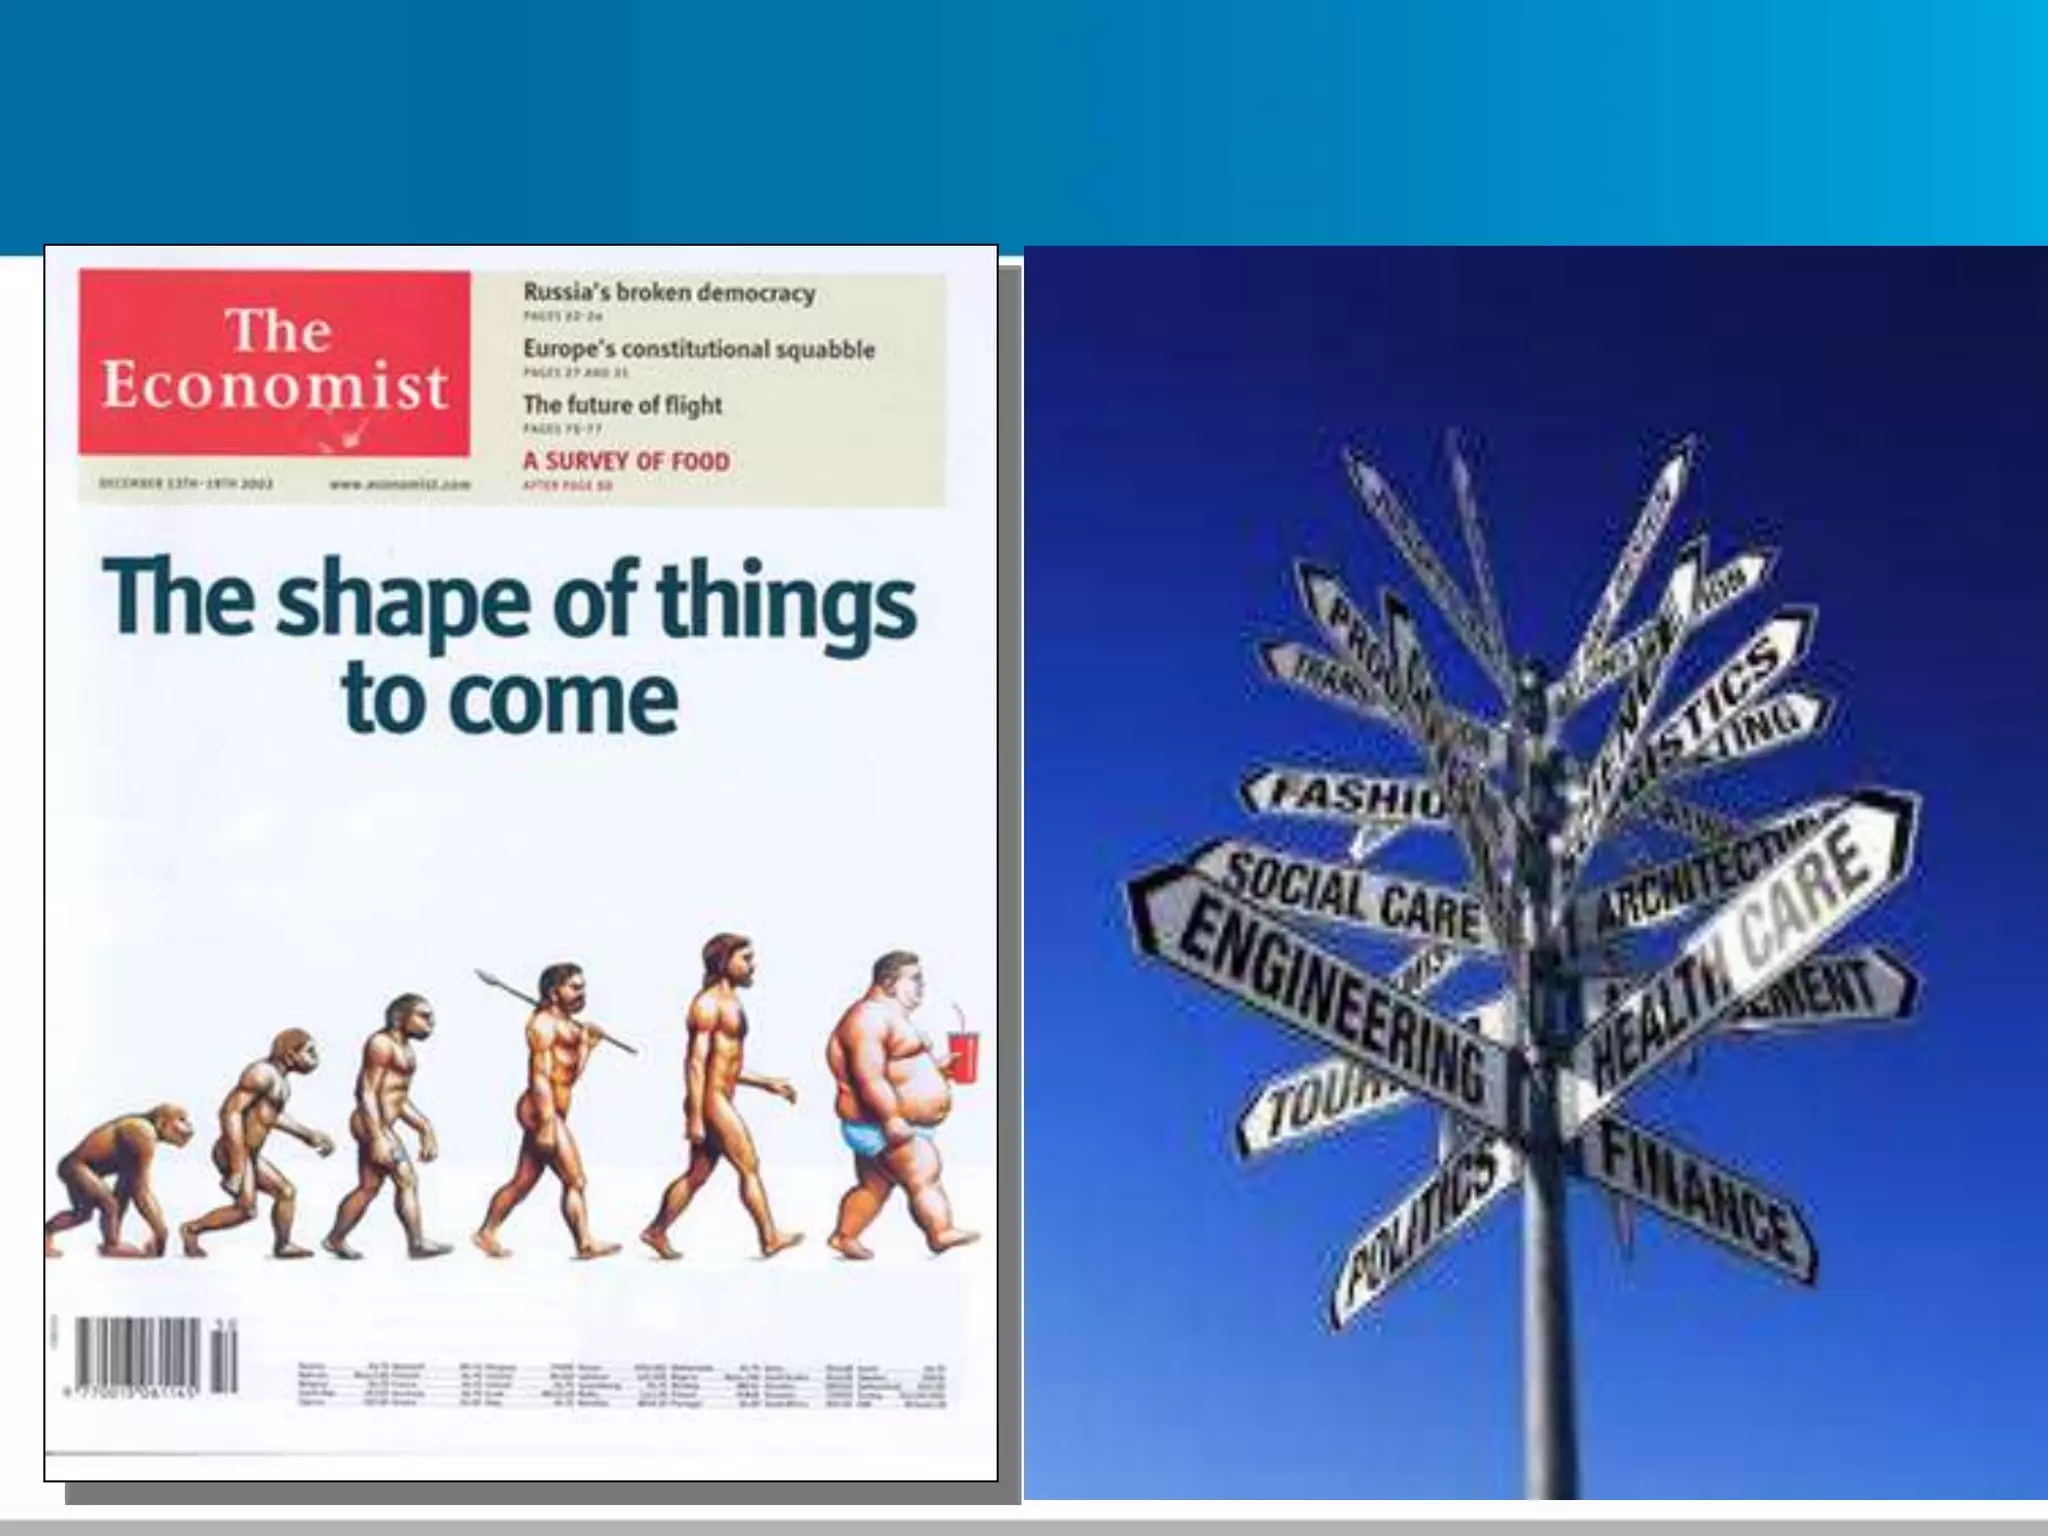
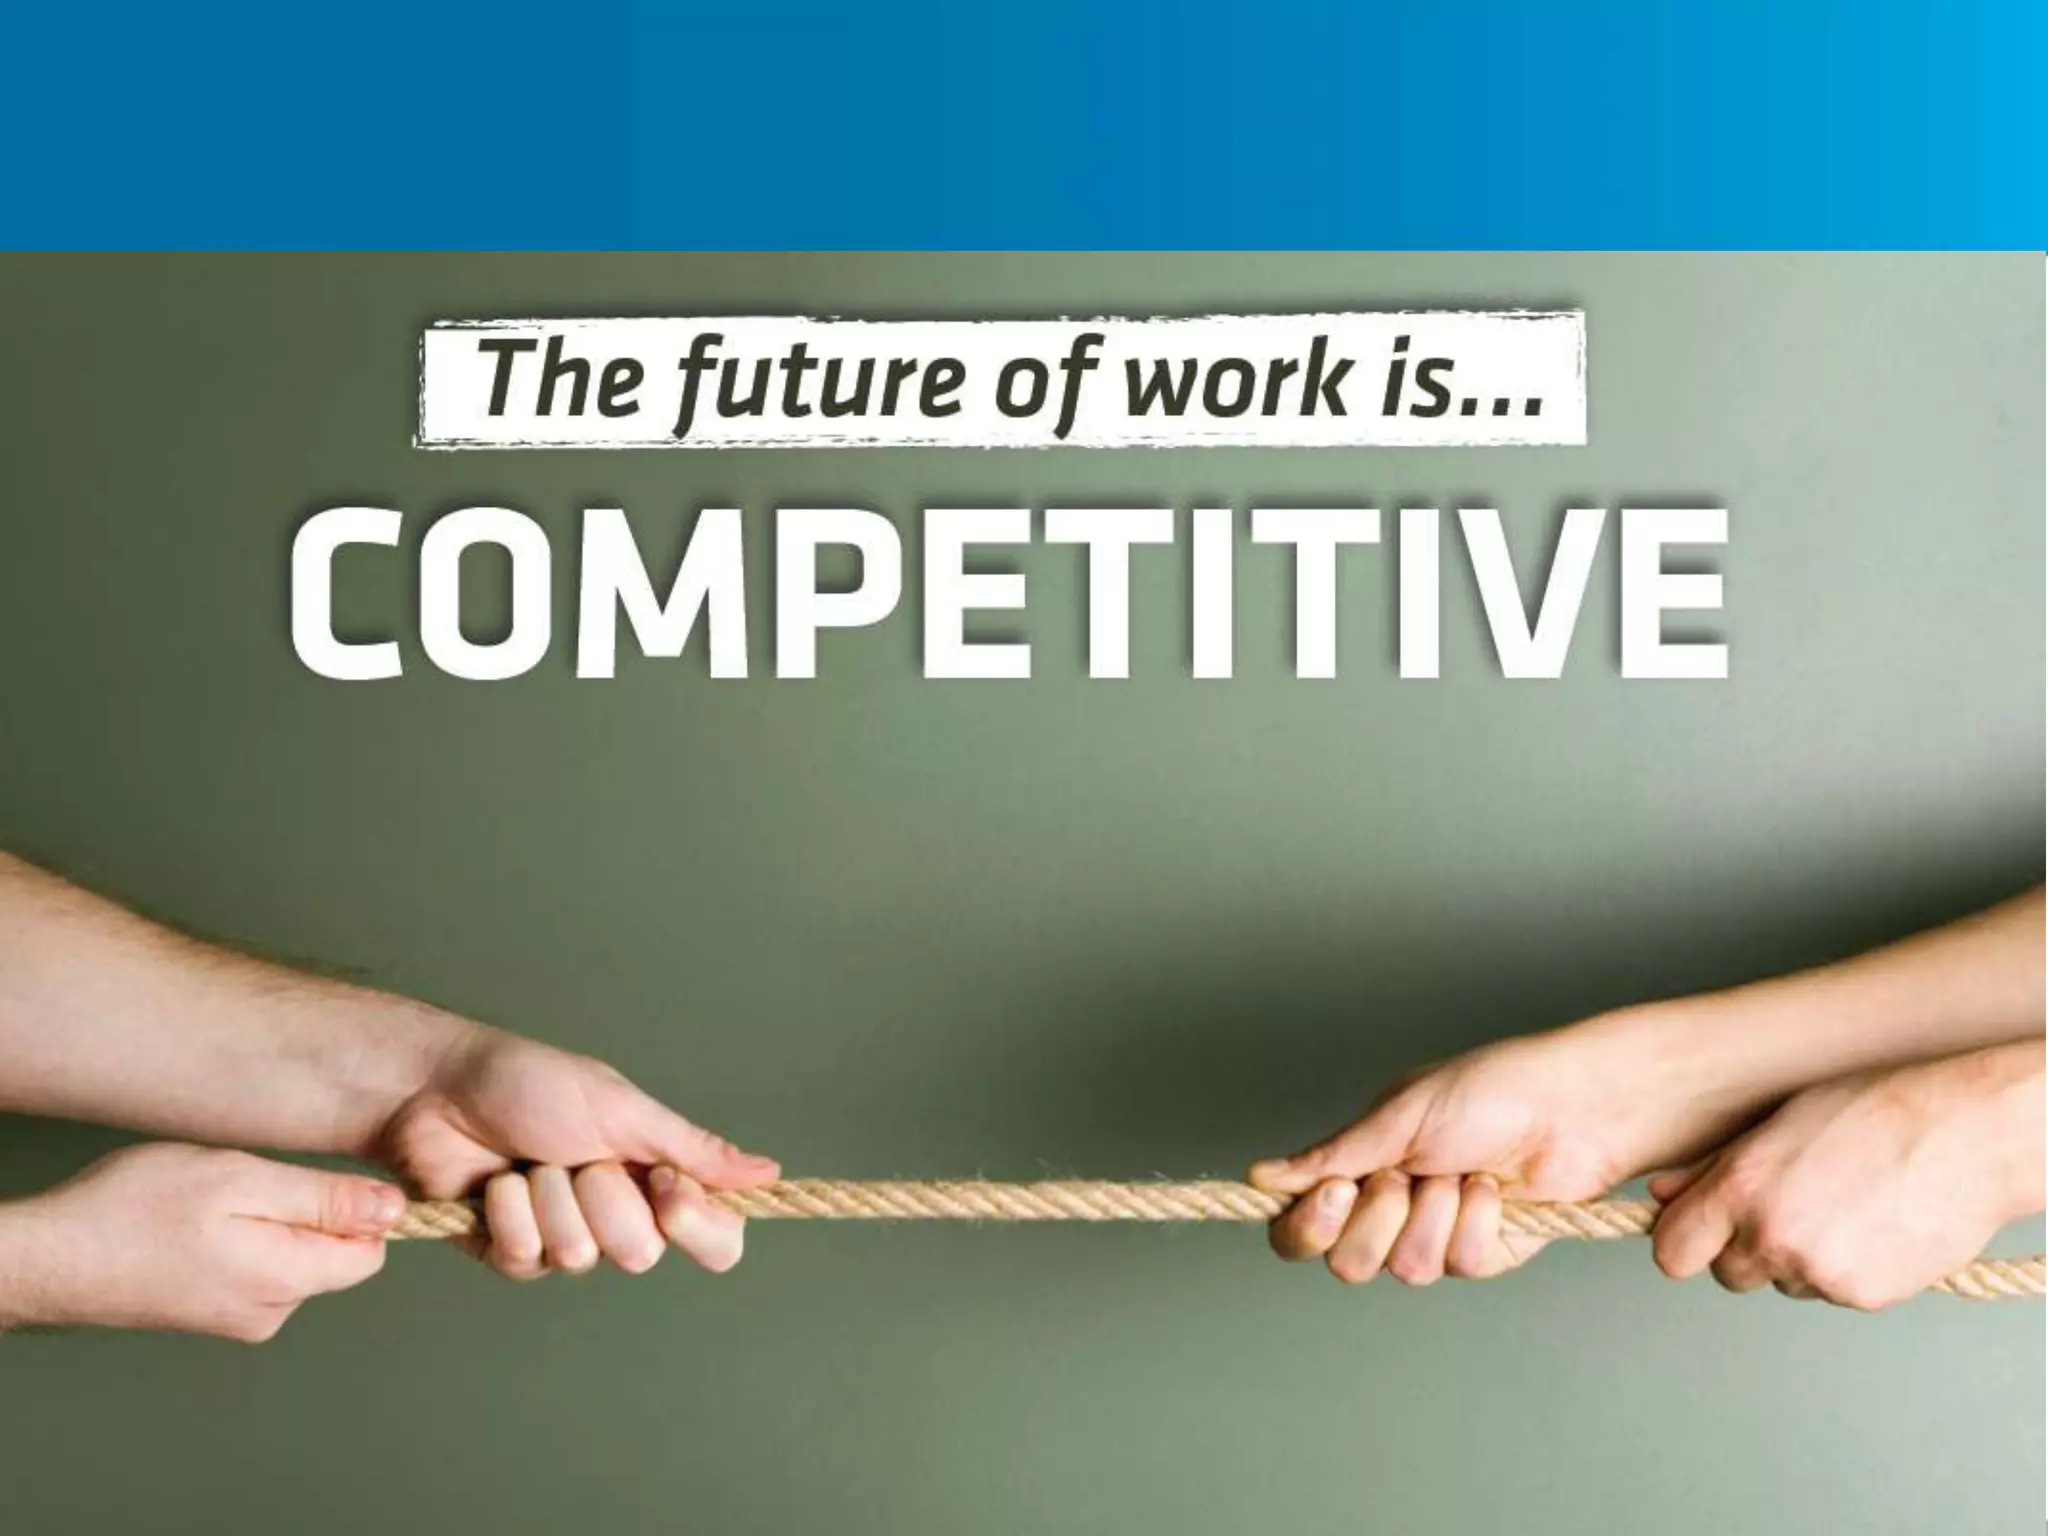


David Smith will give a talk on the future of work and how technological changes are impacting jobs and companies. The pace of technological innovation is increasing rapidly and forcing companies to constantly change their strategies, products/services, and workforces. This has contributed to trends like downsizing, outsourcing, and automation. The ability to adapt to continuous learning will help professionals in the future. The talk will explore implications for both companies and individuals.


![[Challenge:Future] Fighting Youth Unemployment Through Empowerment](https://cdn.slidesharecdn.com/ss_thumbnails/challengefuture-fighting-youth-unemployment-through-empowerment4102-130301051604-phpapp02-thumbnail.jpg?width=640&height=640&fit=bounds)


