- The study investigates whether fund characteristics can help predict mutual fund performance beyond just using past performance.
- By analyzing one group of funds from 1962-2006, the study finds that past performance, ability (a fund's risk-adjusted performance over its lifetime), and turnover ratio significantly predict future fund performance.
- When the researchers implement an investment strategy selecting funds based on predicted performance from these three factors, it generates higher risk-adjusted returns than a strategy just using past performance.
Performance of trades and stocks of fund managers pinnuckbfmresearch
This document summarizes a study that examines the performance of stock holdings and trades of Australian fund managers. The study finds:
1) The stocks held by fund managers realize abnormal returns on average, consistent with some stock selection ability.
2) Stocks purchased by fund managers realize abnormal returns on average, while stocks they sell do not, supporting the idea that fund managers have superior information.
3) Large stocks are more likely to benefit from fund managers' superior information than small stocks.
However, the superior returns from stock holdings are not delivered to unit holders, possibly due to fees and poor market timing. The results provide out-of-sample support for recent U.S. studies finding fund managers
This study explores performance persistence in mutual funds. The authors find:
1) Funds that perform relatively poorly compared to peers and benchmarks are more likely to disappear, indicating survivorship bias can be relevant in mutual fund studies.
2) Mutual fund performance persists from year to year on a risk-adjusted basis, though much of the persistence is due to repeated underperformance relative to benchmarks.
3) Persistence patterns vary dramatically between time periods, suggesting performance is correlated across managers due to common strategies not captured by risk adjustments. Poorly performing funds also persist instead of being fully eliminated by the market.
Fund returnsandperformanceevaluationtechniques grinblattbfmresearch
This paper empirically compares three techniques for evaluating mutual fund performance: the Jensen Measure, the Positive Period Weighting Measure, and the Treynor-Mazuy Measure of Total Performance. It does so using a sample of 279 mutual funds and 109 passive portfolios constructed from firm characteristics and industries. The study finds that 1) the performance measures can yield different inferences depending on the benchmark used, 2) measures may detect timing ability differently, and 3) cross-sectional regressions of performance on fund characteristics may provide insights even when individual performance measures lack statistical power.
Performance Of Fo F Do Experience And Size Matterchardingsmith
This summary provides the key information from the document in 3 sentences:
The document discusses the performance of funds of hedge funds (FHFs), analyzing whether experience and size impact performance. It uses quantile regression to study the effect of these factors on various return levels rather than just average return. The empirical results suggest that experience and size have a negative effect on performance at higher quantiles, but size has a positive effect at lower quantiles, with both factors showing no significant effect at the median.
1) The study uses a new database to analyze mutual fund performance by decomposing returns into stock-picking ability, style, transactions costs, and expenses.
2) It finds that funds hold stocks that outperform the market by 1.3% annually but their net returns underperform by 1% due to the costs of active management.
3) High expenses and transactions costs account for most of the 2.3% difference between stock picking returns and net returns, while style differences account for some of the rest.
This document summarizes research on the relationship between portfolio turnover and investment performance. Recent studies have found no evidence that higher portfolio turnover leads to lower returns, as was previously thought. Trading costs have declined over time, and portfolio turnover is not a good proxy for actual trading costs due to variations based on security type and trade size. A 2007 study directly estimated trading costs and found no statistical relationship between costs and returns. The author's own analysis of mutual funds from 2007-2008 also found little correlation between turnover and performance. Therefore, advisors should not assume higher turnover indicates lower potential returns.
Performance emergingfixedincomemanagers joi_is age just a numberbfmresearch
1) Younger fixed-income managers tend to outperform older, more established managers in terms of gross returns. Returns are significantly higher for emerging managers in their first year and first five years compared to later years.
2) The study examines 54 fixed-income managers formed since 1985 that had majority employee ownership. Most were formed before 2000, when barriers to entry increased.
3) Business risk is low for emerging managers, as only 6.8% of the 88 examined managers are no longer in business. Higher first-year and early-period returns for emerging managers indicate they provide alpha during their hungry startup phase.
This document analyzes different categories of active mutual fund management based on measures of Active Share and tracking error. It finds that the most active stock pickers have outperformed their benchmarks after fees, while closet indexers and funds focusing on factor bets have underperformed after fees. Performance patterns were similar during the 2008-2009 financial crisis. Closet indexing has become more popular recently. Fund performance can be predicted by cross-sectional stock return dispersion, favoring active stock pickers when dispersion is higher.
The document summarizes the mid-year 2011 Standard & Poor's Indices Versus Active Funds (SPIVA) Scorecard, which compares the performance of actively managed mutual funds to relevant benchmarks. Some key findings over the past 3 and 5 years include:
- Over 63% of large-cap, 75% of mid-cap, and 63% of small-cap US stock funds underperformed their benchmarks.
- Over 57% of global stock funds, 65% of international stock funds, and 81% of emerging markets stock funds underperformed.
- Over 50% of active bond funds failed to outperform benchmarks, except for emerging market debt funds.
- Asset-weighted returns also showed
Individuals asset class choice behavior in their pension fund individual account appear consistent with the use of naive learning rules. Preliminary results from joint work with Felix Villatoro, Olga Fuentes and Pamela Searle.
This document provides a 3-sentence summary of a research paper that develops a multifactor model to forecast the 1-year returns of actively managed equity mutual funds. The model uses forecasts of a fund's manager skill, style (based on factors like market, size, value, and momentum), and expected factor returns. When tested on German equity funds, the multifactor model substantially improved forecasts compared to a naive model, reducing the mean squared error by up to 30% and yielding returns over 200 basis points higher for top-decile funds.
Mutual fund performance and manager style by james l. davis(11)bfmresearch
This document provides a 3-sentence summary of the given document:
The document analyzes whether certain investment styles reliably produce abnormal returns for mutual funds and whether fund performance is persistent based on style. It finds that none of the styles studied generated positive abnormal returns compared to benchmarks, with value funds showing negative abnormal returns. There is some evidence that top performing growth managers and worst performing small-cap managers show persistence for a year, but abnormal performance tends to disappear quickly. The results cast doubt on the economic value of active fund management.
This document examines investment behavior when firms face costs in accessing external funds. It finds that standard investment regressions predict cash flow is important for investment only without considering q. Conversely, it also obtains significant cash flow effects even without financial frictions. These findings support the argument that cash flow effects in regressions are due to measurement error in q and identification problems. The document then provides context on empirical investment patterns and the relationship between investment and financing. It describes a model of heterogeneous firms facing costly external finance to understand these stylized facts. Using this model, it finds cash flow effects in regressions are not solely due to financial constraints and are sensitive to measurement error.
The document analyzes three portfolio strategies - an equally weighted portfolio, a minimum variance portfolio, and a maximum Sharpe ratio portfolio - using returns data from six stocks over a six-year period. The minimum variance portfolio assigns weights to minimize risk and achieves an annual return of 11.4% and annual risk of 12.5%. The maximum Sharpe ratio portfolio assigns weights to maximize risk-adjusted return and achieves an annual return of 19.4% and annual risk of 15.2%. Overall, diversifying into one of the optimized portfolios reduces risk compared to the equally weighted portfolio.
- The document reviews several studies from the 1960s and 1970s that analyzed the performance of mutual funds relative to benchmarks like the Dow Jones Industrial Average.
- The earliest studies by Friend, Sharpe, and Jensen found that on average mutual funds did not outperform the market and in some cases had lower risk-adjusted returns.
- Later studies critiqued the risk measures used and developed new measures, finding more mixed results and that some funds did outperform depending on factors like objectives, risks taken, and time periods analyzed.
- Overall the literature showed an ongoing effort to develop better ways to measure and compare mutual fund performance over time while accounting for risks.
Impact of capital asset pricing model (capm) on pakistanAlexander Decker
This document summarizes a research study that applied the Capital Asset Pricing Model (CAPM) to stocks traded on the Karachi Stock Exchange in Pakistan from 2003 to 2007. The study found that CAPM was able to estimate stock returns in the Pakistani market and showed the existence of a risk premium as the only factor affecting stock returns. The study used monthly return data from 5 portfolios sorted by size and book-to-market ratios. Regression analysis found the intercept was insignificant while the risk premium was significant, showing CAPM estimates stock returns accurately in this market. However, the study notes CAPM has limitations and future research could test different models or variations to further analyze factors affecting stock returns.
Information ratio mgrevaluation_bossertbfmresearch
This document discusses using the Information Ratio (IR) to evaluate mutual fund managers. The IR measures excess return over a benchmark relative to excess return volatility. While commonly used, the IR has limitations that depend on benchmark choice, data frequency, and fund return distributions. The document aims to empirically analyze IR characteristics across different asset classes and countries to determine if it is a reliable performance measure or if guidelines are needed for its use.
Standard & poor's 16768282 fund-factors-2009 jan1bfmresearch
This document summarizes a study by Standard & Poor's on factors that predict investment fund performance. The study analyzed both qualitative factors like fund size, expenses, and age as well as quantitative metrics like Jensen's alpha and information ratio. The key findings were:
- For developed markets, larger funds with lower expenses tended to outperform. But for emerging markets, smaller funds did better due to differences in liquidity.
- Jensen's alpha and information ratio best predicted future performance of developed market equity funds over shorter time periods.
- Past performance was informative over 2 years but less so over 1 year due to noise. Fund selection should focus on factors predicting shorter term outperformance.
This document summarizes a study examining the performance persistence of growth-oriented mutual funds in India from 2008 to 2011. The study uses a winner-loser contingency table methodology to analyze the weekly and annual returns of 5 mutual funds over this period. The results show little evidence of short-term persistence in weekly returns but more significant evidence of persistence in annual returns. Specifically, two funds were consistent winners annually while no funds were consistent losers. Overall, an annual evaluation period best identifies persistence in the Indian mutual fund market.
This document summarizes a journal article that examines how stale prices impact the performance evaluation of mutual funds. The article introduces a model to estimate "true alpha" based on the true returns of underlying fund assets, independent of biases from stale pricing. Empirical tests show true alpha is about 40 basis points higher than observed alpha and remains positive on average. The difference between the two alphas consists of three components - a small statistical bias, dilution from long-term fund flows, and a large and significant dilution effect primarily from short-term arbitrage flows exploiting stale prices.
This document provides an acknowledgement and summary of a graduate thesis on portfolio selection and arbitrage strategies using stochastic dominance approaches. It thanks the supervisor, Dr. Kassimatis Konstantinos, and the Bodossaki Foundation for funding the master's degree. The summary reviews contemporary issues in financial markets that motivate effective portfolio selection methods. It then explains common portfolio selection models like mean-variance analysis and expected utility maximization and their limitations. Finally, it introduces stochastic dominance as a framework that makes fewer assumptions and considers the whole return distribution.
Dividend portfolio – multi-period performance of portfolio selection based so...Bogusz Jelinski
What will happen to your investment if you ignore change of share prices while calculating both returns and risk during stocks portfolio selection? Is it profitable in long term to
sell a share when its price has started to skyrocket?
This paper examines the relationship between mutual fund manager ownership stakes in the funds they manage and the performance of those funds. The author hypothesizes that greater manager ownership will be positively associated with fund returns and negatively associated with fund turnover, as higher ownership would better align manager and shareholder interests by reducing agency costs. Using a dataset of manager ownership disclosures from 2004-2005, the author finds that funds with higher manager ownership had higher returns and lower turnover, supporting the hypotheses. However, manager ownership was not related to a fund's tax burden.
Dividend policy and share price volatility in kenyaAlexander Decker
This document summarizes a research study that examined the relationship between dividend policy and share price volatility on the Nairobi Stock Exchange from 1999-2008. The study used regression analysis to test the relationship between share price volatility (dependent variable) and two measures of dividend policy: dividend payout ratio and dividend yield (independent variables). The results showed that dividend payout ratio was negatively correlated with share price volatility, meaning higher payout ratios were associated with lower volatility. Dividend yield was positively correlated with volatility, suggesting higher yielding stocks experienced greater price fluctuations. Both relationships were statistically significant. Therefore, the study found that dividend policy influences share price volatility on the Nairobi Stock Exchange.
This document summarizes a study examining 125 equity mutual funds that closed to new investment between 1993 and 2004. The study tests three hypotheses about why funds close: 1) The "good steward" hypothesis argues funds close to restrict inflows and maintain performance, and will perform well after reopening. 2) The "cheap talk" hypothesis posits closing has no real cost if fees increase and existing investors contribute, compensating managers. 3) The "family spillover" hypothesis claims closing diverts attention to other funds in the same family. The study finds little support for good steward performance, but evidence managers raise fees consistent with cheap talk, and little family benefit except briefly around closure.
The document describes two dynamic portfolio strategies - the Dynamic Asset Strategy (DAS) and Dynamic Income Strategy (DIS) offered by Parker/Hunter Asset Management. The strategies use exchange-traded products to dynamically allocate across global asset classes based on macroeconomic conditions, seeking competitive returns with lower volatility than the overall markets. Both strategies typically hold 10-20 positions across stocks, bonds, commodities and alternatives, with no single position over 25% of the portfolio. The DAS focuses on capital growth while the DIS emphasizes current income.
Examination of hedged mutual funds agarwalbfmresearch
Hedge funds have traditionally only been available to accredited investors while providing lighter regulation and stronger performance incentives compared to mutual funds. Recently, some mutual funds have adopted hedge fund-like strategies but remain subject to tighter regulation. This study examines the performance of these "hedged mutual funds" relative to both hedge funds and traditional mutual funds. It finds that despite using similar strategies as hedge funds, hedged mutual funds underperform due to their tighter regulation and weaker incentives. However, hedged mutual funds outperform traditional mutual funds, with the superior performance driven by those with managers having hedge fund experience.
1) The document discusses emerging fixed-income managers and whether their age or assets under management is a better indicator of performance.
2) It analyzes monthly return data for 317 fixed-income firms from 1985-present to determine if younger or smaller firms outperform their larger counterparts.
3) The research aims to address gaps in prior studies that focused only on equities and hedge funds, and used assets under management rather than age to define emerging managers.
Should investors avoid active managed funds baksbfmresearch
This document summarizes a study that analyzes mutual fund performance from an investor's perspective. The study develops a Bayesian method to evaluate mutual fund manager performance using flexible prior beliefs about managerial skill. The method is applied to a sample of over 1,400 equity mutual funds. The study finds that even with extremely skeptical prior beliefs about manager skill, some allocation to actively managed funds is justified. The economic importance is quantified by estimating the portfolio share and certainty equivalent loss from excluding all active managers.
This document is a guide to the markets published by JPMorgan that provides data and analysis across various asset classes including equities, fixed income, international markets, and the economy. It includes sections on returns by investment style and sector for equities, economic indicators and drivers, interest rates and yields for fixed income, growth and valuation metrics for international markets, and historical returns for various asset classes. The guide contains over 60 charts and analyses to inform readers about the current state of the financial markets.
Morningstar fund investor_fees_predictorbfmresearch
The document summarizes research on how expense ratios and Morningstar star ratings can predict the future success of mutual funds. Some key findings:
- Funds in the lowest expense ratio quintile significantly outperformed those in the highest quintile in terms of total returns and survival rates across all asset classes except international stocks.
- Funds with the highest Morningstar ratings (5 stars) generally had higher total returns and survival rates than 1-star funds, though expense ratios were a slightly better predictor of success.
- The star rating beat expense ratios as a predictor in less than half of asset class comparisons between 2005-2010, taking into account funds that failed or were liquidated.
The document discusses a new approach to asset allocation that focuses on diversifying risk factors rather than asset classes. It argues that traditional approaches underestimate market dynamics and fail to hedge "fat tail" risks. The new approach takes a forward-looking, macroeconomic view and aims to diversify risks across equity, bond, currency and commodity risk factors. It also notes that one extremely bad year can erase gains from multiple good years, emphasizing the importance of hedging rare but severe loss events.
Fund performance, mgmt behavior, and investor costs dowenbfmresearch
This document summarizes a study that examined mutual fund performance, management behavior, and costs for investors over a 5-year period. The study looked at both equity and fixed income funds. For equity funds, the study found that increased trading activity by managers was negatively related to fund returns, while expense ratios were not significantly related to returns. Potential capital gains exposure and tax costs were positively related to returns. For fixed income funds, increased trading activity was positively related to returns, while higher expense ratios and tax costs were negatively related to returns. The study also found evidence that mutual funds experience economies of scale, with lower costs for larger funds that are part of larger fund families.
Plan sponsors hire and fire investment management firms to manage retirement plan assets totaling $6.3 trillion. The study examines the hiring and firing decisions of 3,400 plan sponsors between 1994-2003. It finds that plan sponsors hire managers after periods of strong excess returns, but these returns do not continue afterward. Managers are terminated for various reasons, including but not limited to underperformance, and excess returns after firings are indistinguishable from zero. When comparing returns from fired vs. newly hired managers, staying with fired managers would have yielded similar returns. Hiring and firing patterns vary based on plan sponsor characteristics.
Transaction cost expenditures and the relative performance of mutual funds(13)bfmresearch
This document analyzes trading costs for a sample of 132 equity mutual funds between 1984 and 1991. It finds that trading costs, including spread costs and brokerage commissions, average 0.78% of fund assets per year and vary substantially across funds. Higher trading costs are negatively associated with fund returns, even after controlling for expense ratios. Turnover explains some but not all of the variation in trading costs. Fund investment objectives are related to average trading costs but variation within objectives is greater than across objectives.
1) The study investigates how fund size affects performance in the active money management industry. Specifically, it analyzes whether fund returns decline as fund size increases.
2) The results show that both gross and net fund returns decline as lagged fund size increases, even after accounting for various performance benchmarks and fund characteristics. This suggests that larger fund size erodes performance.
3) However, controlling for its own size, a fund's performance does not deteriorate as the size of the family it belongs to increases. This indicates that scale itself does not necessarily harm performance, depending on how the fund is organized.
This document summarizes recent academic research on active equity managers who deliver persistent outperformance. It discusses studies finding that:
1) While the average equity manager underperforms after fees, a minority of managers have demonstrated persistent outperformance that cannot be attributed to chance alone.
2) Managers with higher "active share" (the degree to which their portfolio composition differs from the benchmark) tend to generate greater risk-adjusted returns.
3) Managers with lower portfolio turnover and a focus on strong stock selection, rather than market timing, are more likely to outperform over time.
The document evaluates how Brown Advisory's investment approach aligns with the characteristics identified in these studies as being associated with persistent
The S&P Persistence Scorecard seeks to analyze whether past mutual fund performance is indicative of future performance. It tracks the consistency of top performers over consecutive periods and measures performance persistence through transition matrices. The key findings are that very few funds consistently repeat top-half or top-quartile performance over consecutive periods. Additionally, screening for only top-quartile funds may be inappropriate as a healthy number of future top performers come from the second and third quartiles in prior periods. The bottom quartile funds have a high probability of being merged or liquidated and screening these out may be reasonable.
The document discusses whether the concept of "Alpha" is a useful performance metric for investors. It makes two main arguments:
1) Alpha alone does not determine if a portfolio has superior risk-adjusted returns, as portfolio volatility and correlation to benchmarks also influence risk-adjusted returns.
2) Alpha is dependent on leverage - a higher reported Alpha could simply be due to using leverage rather than superior investment skill.
The document concludes that Alpha is a misleading performance measure and is not suitable as the sole metric, especially for investors concerned with total risk and returns rather than just a single return component.
This document summarizes research on the relationship between portfolio turnover and investment performance. Recent studies have found no evidence that higher portfolio turnover leads to lower returns, as was previously thought. Trading costs have declined over time, and portfolio turnover is not a good proxy for actual trading costs, which depend more on trade size and type of security traded. A 2007 study directly estimated trading costs and found no clear correlation between costs and returns. The author's own analysis of mutual funds from 2007-2008 also found little relationship between turnover and performance. Therefore, advisors should not assume higher turnover means lower returns.
The document summarizes findings from the Standard & Poor's Indices Versus Active Funds (SPIVA) Scorecard, which compares the performance of actively managed mutual funds to relevant benchmarks. Some key points:
- Over the past 3 years, the majority (over 50%) of actively managed large-cap, mid-cap, small-cap, global, international, and emerging market funds underperformed their benchmarks.
- Over the past 5 years, indices outperformed a majority of active managers in nearly all major domestic and international equity categories based on equal-weighted returns. Asset-weighted averages also showed underperformance in 11 out of 18 domestic categories.
- For fixed income funds, over 50% under
This document analyzes different categories of active mutual fund management based on measures of Active Share and tracking error. It finds that the most active stock pickers have outperformed their benchmarks after fees, while closet indexers and funds focusing on factor bets have underperformed after fees. Performance patterns were similar during the 2008-2009 financial crisis. Closet indexing has become more popular recently. Fund performance can be predicted by cross-sectional stock return dispersion, favoring active stock pickers when dispersion is higher.
This document discusses the importance of distinguishing between skill and luck when evaluating outcomes. It provides the following key points:
1. Most activities involve both skill and luck, but people often fail to properly separate the two influences.
2. Understanding the relative contributions of skill versus luck allows for better analysis of outcomes, more accurate predictions, and improved decision making.
3. The document proposes a framework using two "urns", one representing skill and one representing luck, to conceptualize how outcomes are determined by a combination of the two factors.
This report provides an analysis of defined contribution retirement plans based on 2010 Vanguard recordkeeping data. Some key findings include:
- Median and average account balances reached their highest levels since tracking began in 1999, recovering from market declines.
- Use of target-date funds as investment options and default investments continues to grow significantly, with 42% of participants using them and 20% wholly invested in a single target-date fund.
- Professionally managed investment options like target-date funds are being used by an increasing number of participants, with 29% solely invested in an automatic investment program in 2010 compared to just 9% in 2005.
- While participation rates and contribution levels declined slightly in 2010 from 2009
This document discusses using active share and tracking error as measures of portfolio manager skill. It defines active share as the percentage of a fund's portfolio that differs from its benchmark index. Tracking error measures systematic factor risk by capturing how much a fund's returns vary from its benchmark. Research shows funds with high active share and moderate tracking error tend to outperform on average. The document examines how active share and tracking error can help identify skillful managers by focusing on their portfolio construction process rather than just past returns.
Morningstar ratings and fund performance blake moreybfmresearch
This study examines the ability of Morningstar ratings to predict the future performance of mutual funds compared to alternative predictors. The authors analyze two samples of US equity funds: seasoned funds from 1992-1997 and complete funds from 1993. They assess predictive ability using out-of-sample performance over 1, 3, and 5 year horizons, adjusting for loads and styles. The results indicate that low Morningstar ratings generally predict relatively poor future performance, but there is little evidence that top-rated funds outperform similar funds. Morningstar ratings do only slightly better than alternative predictors in forecasting future fund performance.
Superior performance by combining Rsik Parity with Momentum?Wilhelm Fritsche
This document examines different strategies for global asset allocation between equities, bonds, commodities and real estate. It finds that applying trend following rules substantially improves risk-adjusted performance compared to traditional buy-and-hold portfolios. It also finds trend following to be superior to risk parity approaches. Combining momentum strategies with trend following further improves returns while reducing volatility and drawdowns. A flexible approach that allocates capital based on volatility-weighted momentum rankings of 95 markets produces attractive, consistent risk-adjusted returns.
This document provides an extensive literature review of studies examining performance persistence in mutual funds. The review summarizes findings from early studies in the 1960s-1980s that used long time periods of 10-15 years and generally found some evidence of performance persistence, especially for inferior performers. However, later studies using shorter time periods found more inconsistent results and that persistence was strongly dependent on the sample and methodology used. The review concludes that while short-term persistence is sometimes found, past performance is not a reliable predictor of future returns due to biases in conventional testing procedures. Results are often sensitive to the specific measures and time periods examined, especially for equity funds.
Short term persistence in mutual fund performance(12)bfmresearch
This study examines the short-term persistence of mutual fund performance using daily returns data over quarterly periods. The researchers estimate stock selection and market timing models for mutual funds and rank funds into deciles based on their estimated abnormal returns each quarter. They then measure the average abnormal return of each decile in the following quarter. They find that the top-performing decile in a given quarter generates a statistically significant average abnormal return of 25-39 basis points in the subsequent quarter, providing evidence of short-term persistence in performance. However, this persistence disappears when funds are evaluated over longer periods using a concatenated time series approach.
This study examines persistence in mutual fund performance over 1962-1993 using a survivorship-bias-free database. The author finds:
1) Common factors in stock returns and differences in mutual fund expenses explain almost all persistence in mutual fund returns, with the exception of strong underperformance by the worst-performing funds.
2) The "hot hands effect" documented in prior literature is driven by the one-year momentum effect in stock returns, but individual funds do not earn higher returns from actively following momentum strategies after accounting for costs.
3) Expenses have a negative impact on performance of at least one-for-one, and higher turnover also negatively impacts performance, reducing returns by around 0.95
How poor stock mkt perf affects fund f lows shriderbfmresearch
1) The document examines how the determinants of mutual fund flows change depending on market conditions, specifically comparing periods of strong market performance to periods of weak performance.
2) Prior research has found that fund flows depend on both absolute and relative performance measures, but different studies have found different performance measures to be most important.
3) The study analyzes mutual fund data from 2001-2002, a period including record inflows and increasing outflows, to test if the determinants of fund flows differ between periods of good versus poor market performance and fund flow changes.
Data returnsselectionoffunds elton_gruberbfmresearch
1) Using holdings data and security betas to estimate mutual fund alphas and betas leads to better selection of funds than estimating from fund returns alone. The funds selected using the holdings data approach have significantly higher future alphas.
2) Estimating alphas and betas more frequently, such as with monthly holdings data rather than quarterly, further improves selection. However, quarterly data captures most of the benefits and allows analysis of a much larger sample.
3) Neither conditional betas nor an alternative approach using holdings proposed by Grinblatt and Titman provided better rankings than the primary approach using holdings to estimate alphas and betas.
The document summarizes a study on constructing an optimal portfolio for Vishal Investment in Bangalore. The objectives are to construct portfolios in different market scenarios, increase performance through optimal construction, analyze risk and return to meet future capital needs, and guide investors to maximize return with minimum risk. Literature on portfolio selection models and past performance of socially responsible vs conventional funds is reviewed. Secondary data on share prices, returns, standard deviation and betas over three years will be collected and analyzed using descriptive methodology. The study aims to test if portfolio returns can be increased through optimal construction versus returns cannot be increased.
This document summarizes a study on constructing an optimal portfolio for Vishal Investment in Bangalore. The objectives are to construct portfolios in different market scenarios, increase performance through optimization, analyze risk and return to meet future capital needs, and guide investors to maximize returns with minimum risk. Literature on portfolio selection models and past performance of socially responsible vs conventional funds is reviewed. Secondary data on share prices, returns, standard deviation and betas from the past 3 years will be collected and analyzed using descriptive methodology. The study will use Sharpe's optimal portfolio, beta coefficients, and return calculations to construct optimal portfolios under various conditions.
This document summarizes a study that examines whether mutual fund managers can pick stocks by analyzing the performance of stocks that funds buy and sell around subsequent quarterly earnings announcements. The study finds:
1) On average, stocks that mutual funds buy outperform stocks they sell by about 10 basis points in the 3 days around the next earnings announcement.
2) This performance persists after benchmarking against stocks with similar characteristics, and funds that perform best tend to have a growth style.
3) Mutual fund trades forecast future earnings surprises, indicating managers can predict fundamentals.
4) Abnormal returns around earnings announcements account for 18-51% of total abnormal returns to stocks funds trade.
Performance persistence of fixed income funds dromsbfmresearch
This study examines the performance persistence of fixed income mutual funds between 1990 and 1999. It uses a methodology that ranks funds based on their annual returns, with the top 50% labeled as "winners" and bottom 50% labeled as "losers". It then analyzes whether winners and losers in one period remain winners or losers in the next period. The study finds some evidence of short-term persistence in fund performance driven by changes in interest rates, with statistical significance and consistency between the direction of persistence and bond returns. However, the nature of persistence is shown to be dependent on shifts in interest rates over time.
This document summarizes critiques of the Capital Asset Pricing Model (CAPM) and presents alternative models. It discusses empirical studies from the 1980s and 1990s that found variables other than beta help explain stock returns, contradicting CAPM. Fama and French's 1992 study found firm size and book-to-market ratio better predict returns than beta. Their three-factor model and the Arbitrage Pricing Theory were proposed as alternatives to CAPM. Overall, the document outlines major empirical challenges to CAPM and influential models that improved on its ability to explain stock returns.
This study examines the explanatory power of various financial variables for the cross-section of realized stock returns between 1940-1963. The study finds that book-to-market equity, earnings yield, and cash flow yield have significant explanatory power for returns, and there is a strong seasonal effect in January for these variables. Regression analysis shows that book-to-market equity, earnings yield, and cash flow yield are statistically significant predictors of subsequent returns. In contrast, variables like historical beta, firm size, and sales growth have weaker or insignificant relationships with returns. The results provide evidence that certain fundamental variables can capture risk differences across stocks and help identify mispriced stocks.
This study examines the stock picking and market timing abilities of 10 UK investment trusts between 1995 and 2016. Results show little evidence of outperformance against the FTSE All Share index. Only 1 fund showed evidence of superior stock picking, while no funds showed evidence of superior market timing. Consistent with other studies, funds with more concentrated portfolios tended to perform better. The study aims to evaluate the investment skills of UK fund managers and determine if fund concentration impacts performance.
The document discusses several studies on mutual fund performance from 1965 to 2002. Some key findings include:
- Early studies from 1965-1972 found mutual funds generally did not outperform markets and there was little evidence managers could predict price movements.
- Later studies from the 1970s-1980s found mixed results, with some funds showing above average performance but no consistency over time. Expense ratios were negatively correlated with performance.
- Studies in the 1990s provided evidence mutual fund performance was not related to expenses and turnover as predicted by market efficiency arguments. Larger funds had lower expenses due to economies of scale.
- International studies found mutual fund managers generally unable to offer higher risk-adjusted returns through stock selection or market timing
Managers does longevityimplyexpertise-costabfmresearch
This study analyzes the performance of 1,042 mutual funds from 1986 to 1995 to determine if fund managers with longer tenure (at least 10 years) generate higher risk-adjusted returns than less experienced managers. The results show:
1) Funds overall had positive risk-adjusted returns of 0.16% per month on average, but funds with long-tenured managers did not outperform those with less experienced managers.
2) Positive returns were largely due to a few crucial years common to all funds, not manager tenure.
3) A manager's ability to generate positive returns over 3 years did not indicate the ability to do so consistently in subsequent periods, regardless of tenure.
This document summarizes a research paper that analyzes the mutual fund industry worldwide. It finds:
1) Explicit index funds are less prevalent outside the US, comprising 7% of assets globally compared to 20% in the US. Many actively managed funds closely track their benchmarks, amounting to "closet indexing".
2) Countries with more explicit indexing have lower fees for active funds and a weaker link between fees and active management. Active funds have higher "active share" under more indexing pressure.
3) Countries with more closet indexing have higher fees for active funds, indicating less competitive pressure.
4) Globally, actively managed funds with higher active share charge higher fees but outperform after fees
Capital structure and eps a study on selected financial institutions listed o...Alexander Decker
This study examined the relationship between capital structure and earnings per share (EPS) for 10 financial institutions listed on the Colombo Stock Exchange in Sri Lanka from 2006 to 2010. The capital structure ratios studied were equity ratio, debt ratio, and leverage ratio. Correlation analysis found equity ratio and debt ratio were negatively associated with EPS, while leverage ratio was positively associated. However, the relationships were not statistically significant. Multiple regression analysis also found capital structure ratios explained 22.6% of the variation in EPS, but the individual ratios' impacts were not statistically significant. Therefore, the hypotheses proposing relationships between the ratios and EPS could not be confirmed.
JUMPING RISK IN TAIWAN AND TAIEX OPTION RETURN IN TAIWAN ijcsit
With low-interest environment in recent years, investment of financial commodity was unable to meet the requirements of necessary paid by society. Therefore, the traditional financial tool were replacing with derivative financial commodity which were high risk, high lever, and high complex; including option, forward contract, futures, credit default swap, and collateralized debt obligations. Global Board Options Exchanges were founded in 1983 that S&PS00 (SPX) index option which launched by the Chicago Board Options Exchange (CBOE). Moreover CBOE was the option which target on trade index at the earliest, and CBOE was the most popular exchange with option trade. Taiwan Futures Exchange (TFE) launched Taiwan weighted index options (TXO) in December 2001 and, and launched stock options in 2003. Currently TXO was the most actively traded options market in Taiwan, but almost had no stock options trading volume due to the release of warrants market. However warrants market and individual stock options had higher homogeneous and better mobility to influence the stock options market. Although Taiwan options market started lately, develops quite fast, the option of Taiwan index was the sixth volume in the global select token name in 2013, that showed that Taiwan index options was a good target on the options-related research. Due to the globalization of financial markets, the single original market waved turn into the global storm which that affected financial asset prices were no longer continuous fluctuations, and it showed a leaps of change by the Butterfly Effect. Because the price process included continuity and discontinuity, the spread and jump process was more accurate than Brownian motion (BM). Currently the derivatives study biased on interest rate futures, foreign futures or foreign exchange futures options and Taiwan index futures options. By the way, the study about the jumping risks related to Taiwan index options effects is rare.
Liquidity, investment style, and the relation between fund size and fund perf...bfmresearch
This document summarizes a study that examines the effect of liquidity and investment style on the relationship between fund size and fund performance. The study finds:
1) Fund performance declines as fund size increases, consistent with prior research.
2) This inverse relationship is stronger for funds holding less liquid portfolios, providing evidence that liquidity issues contribute to performance declining with size.
3) The negative effect of size on performance is also more pronounced for growth funds and high-turnover funds, which tend to have higher trading costs.
4) Controlling for other fund characteristics, performance is still negatively related to size, and this effect is stronger for less liquid funds.
Similar to Fund selection based on fund characteristics budiono (20)
This document is a guide to the markets published by JPMorgan that provides data and analysis across various asset classes including equities, fixed income, international markets, and the economy. It includes sections on returns by investment style and sector for equities, economic indicators and drivers, interest rates and other data for fixed income, international market returns and valuations, and asset class performance and correlations. The guide contains over 60 charts and analyses global and domestic financial trends and investment opportunities.
The document discusses whether the concept of "Alpha" is a useful performance metric for investors. It makes two main arguments:
1) Alpha alone does not determine if a portfolio has superior risk-adjusted returns, as portfolio volatility and correlation to benchmarks also influence risk-adjusted returns.
2) Alpha is dependent on leverage - a higher reported Alpha could simply be due to using leverage rather than superior investment skill.
The document concludes that Alpha is a misleading performance measure and not suitable as the sole metric, especially for investors concerned with total risk and returns rather than just a single return component.
Fis group study on emerging managers performance drivers 2007bfmresearch
This study examined the performance of emerging investment managers over three years ending in 2006. It found that:
1) For large cap managers, increased firm assets were negatively correlated with risk-adjusted returns for core and growth strategies, but not for value. This may be because increased assets led to less concentrated core portfolios, lowering returns.
2) For small cap managers, risk-adjusted returns were highest for firms with less than $500 million in assets, possibly due to added resources like analysts. Returns leveled off between $500 million and $1 billion, and declined above $1 billion.
3) Having more research analysts was consistently positively correlated with higher risk-adjusted returns across strategies, while the impact
The document discusses Barclays' process for evaluating and selecting investment managers. It states that identifying the right asset allocation and implementing it properly are both important for achieving investment goals. The process involves both science, through a formal and structured methodology, and art, by applying judgment and philosophy. Barclays aims to identify managers most likely to perform well through rigorous due diligence and ongoing monitoring. The paper will explain Barclays' comprehensive approach to manager analysis, selection, and review.
Active managementmostlyefficientmarkets fajbfmresearch
This survey of literature on active vs passive management shows:
1) On average, actively managed funds do not outperform the market after accounting for fees and expenses, though a minority do add value.
2) Studies suggest some investors may be able to identify superior active managers in advance using public information.
3) Investors who identify superior active managers could improve their risk-adjusted returns by including some exposure to active strategies.
The document discusses China's transition to a consumer-driven economy. It provides analysis from CLSA China Macro Strategist Andy Rothman on trends in China's economy including the declining importance of exports, strong growth in domestic consumption, increasing incomes driving spending, and continued growth in infrastructure investment. The analysis suggests China's economy remains healthy and growing despite slowing external demand.
This report provides an analysis of defined contribution retirement plans based on 2010 Vanguard recordkeeping data. Some key findings include:
- Median and average account balances reached their highest levels since tracking began in 1999, recovering from market declines.
- Use of target-date funds as investment options and default investments continues to grow significantly, with 42% of participants using them and 20% wholly invested in a single target-date fund.
- Professionally managed investment options like target-date funds are being used by an increasing number of participants, with 29% solely invested in an automatic investment program in 2010 compared to just 9% in 2005.
The document discusses the benefits of exercise for mental health. Regular physical activity can help reduce anxiety and depression and improve mood and cognitive function. Exercise causes chemical changes in the brain that may help protect against mental illness and improve symptoms.
This document summarizes a study comparing the performance of mutual funds managed by individual managers versus teams of managers. The study finds that funds managed by teams have similar risk-adjusted performance to individually-managed funds, despite team-managed funds growing at a faster rate. Additionally, team-managed funds have significantly lower risk, lower cross-sectional performance differences, lower expenses, and lower portfolio factor loadings than individually-managed funds. The study uses a large sample of domestic and international mutual funds to test these findings.
This document discusses returns-based style analysis (RBSA), a technique developed by William Sharpe to determine the style of a portfolio or mutual fund using only returns data. The document provides an overview of RBSA and compares it to holdings-based style analysis. It then describes how to implement RBSA using Excel by constructing a portfolio of indices to minimize the tracking error between the returns of the portfolio being analyzed and the index portfolio returns. The document concludes by providing an example RBSA using the Dodge & Cox Balanced Fund to illustrate the technique.
Prior performance and risk chen and pennacchibfmresearch
This document summarizes a research paper that models how a mutual fund manager's choice of portfolio risk is affected by the fund's prior performance and the manager's compensation structure. The model shows that when compensation cannot fall to zero, managers take on more tracking error risk (deviation from the benchmark portfolio) as performance declines. However, increased total return volatility is not necessarily predicted. Empirical tests on over 6,000 funds from 1962-2006 find evidence managers increase tracking error, but not return, volatility during poor performance, especially longer-tenured managers. This adds new insights to research on risk-shifting incentives in mutual fund tournaments.
- Investors spend an estimated 0.67% of the total value of the US stock market each year on active investing strategies seeking returns above the market.
- This amounts to at least a 10% capitalized cost of the current market value to facilitate price discovery through active investing.
- Under reasonable assumptions, a typical investor could increase average annual returns by 67 basis points over 1980-2006 by switching to a passive market portfolio instead of active strategies.
This study analyzes the trading behaviors of 155 mutual funds between 1975 and 1984 to determine if they exhibited momentum investing and herding behaviors. The researchers find that 77% of funds were "momentum investors," buying stocks that had outperformed in the past, though most did not systematically sell past underperformers. Funds exhibiting momentum behaviors on average realized significantly better risk-adjusted returns than other funds. The study also finds weak evidence that funds tended to buy and sell the same stocks at the same time, known as herding behavior.
Heather Elizabeth HamoodHeather Elizabeth Hamoodheatherhamood
Heather Hamood is a Licensed Physician who enjoys playing the Violin in her spare time. In addition to helping people as a Doctor, she loves to share her passion for the violin.
“Amidst Tempered Optimism” Main economic trends in May 2024 based on the results of the New Monthly Enterprises Survey, #NRES
On 12 June 2024 the Institute for Economic Research and Policy Consulting (IER) held an online event “Economic Trends from a Business Perspective (May 2024)”.
During the event, the results of the 25-th monthly survey of business executives “Ukrainian Business during the war”, which was conducted in May 2024, were presented.
The field stage of the 25-th wave lasted from May 20 to May 31, 2024. In May, 532 companies were surveyed.
The enterprise managers compared the work results in May 2024 with April, assessed the indicators at the time of the survey (May 2024), and gave forecasts for the next two, three, or six months, depending on the question. In certain issues (where indicated), the work results were compared with the pre-war period (before February 24, 2022).
✅ More survey results in the presentation.
✅ Video presentation: https://youtu.be/4ZvsSKd1MzE
Vadhavan Port Development _ What to Expect In and Beyond (1).pdfjohnson100mee
The Vadhavan Port Development is poised to be one of the most significant infrastructure projects in India's maritime history. This deep-sea port, located in Maharashtra, promises to transform the region's economic landscape, bolster India's trade capabilities, and generate a plethora of employment opportunities. In this blog, we will delve into the various facets of the Vadhavan Port Development: what to expect in and beyond its completion, and how it stands to influence the future of India's maritime and economic sectors.
How to Invest in Cryptocurrency for Beginners: A Complete GuideDaniel
Cryptocurrency is digital money that operates independently of a central authority, utilizing cryptography for security. Unlike traditional currencies issued by governments (fiat currencies), cryptocurrencies are decentralized and typically operate on a technology called blockchain. Each cryptocurrency transaction is recorded on a public ledger, ensuring transparency and security.
Cryptocurrencies can be used for various purposes, including online purchases, investment opportunities, and as a means of transferring value globally without the need for intermediaries like banks.
Introduction to Metro in India by cosmo soil.pptxcosmo-soil
The metro system in India is a vital part of urban mobility, providing eco-friendly, efficient, and affordable transportation. This article explores its history, benefits, and future developments, highlighting how metros enhance quality of life and drive urban development.
Navigating Your Financial Future: Comprehensive Planning with Mike Baumannmikebaumannfinancial
Learn how financial planner Mike Baumann helps individuals and families articulate their financial aspirations and develop tailored plans. This presentation delves into budgeting, investment strategies, retirement planning, tax optimization, and the importance of ongoing plan adjustments.
CRYPTOCURRENCY REVOLUTIONIZING THE FINANCIAL LANDSCAPE AND SHAPING THE FUTURE...itsfaizankhan091
Cryptocurrency, a digital or virtual form of currency that uses cryptography for security, has revolutionized the financial landscape. Originating with Bitcoin's inception in 2009 by the pseudonymous Satoshi Nakamoto, cryptocurrencies have grown from niche curiosities to mainstream financial instruments, reshaping how we think about money, transactions, and the global economy.
The birth of Bitcoin marked the beginning of the cryptocurrency era. Unlike traditional currencies issued by governments and controlled by central banks, Bitcoin operates on a decentralized network using blockchain technology. This technology ensures transparency, security, and immutability of transactions, fundamentally challenging the centralized financial systems that have dominated for centuries.
Bitcoin was conceived as a peer-to-peer electronic cash system, aimed at providing an alternative to the traditional banking system plagued by inefficiencies, high fees, and lack of transparency. The underlying blockchain technology, a distributed ledger maintained by a network of nodes, ensures that every transaction is recorded and cannot be altered, thus providing a secure and transparent financial system.
June 20, 2024
CRYPTOCURRENCY: REVOLUTIONIZING THE FINANCIAL LANDSCAPE AND SHAPING THE FUTURE
Cryptocurrency: Revolutionizing the Financial Landscape and Shaping the Future
Cryptocurrency, a digital or virtual form of currency that uses cryptography for security, has revolutionized the financial landscape. Originating with Bitcoin's inception in 2009 by the pseudonymous Satoshi Nakamoto, cryptocurrencies have grown from niche curiosities to mainstream financial instruments, reshaping how we think about money, transactions, and the global economy.
#### The Genesis of Cryptocurrency
The birth of Bitcoin marked the beginning of the cryptocurrency era. Unlike traditional currencies issued by governments and controlled by central banks, Bitcoin operates on a decentralized network using blockchain technology. This technology ensures transparency, security, and immutability of transactions, fundamentally challenging the centralized financial systems that have dominated for centuries.
Bitcoin was conceived as a peer-to-peer electronic cash system, aimed at providing an alternative to the traditional banking system plagued by inefficiencies, high fees, and lack of transparency. The underlying blockchain technology, a distributed ledger maintained by a network of nodes, ensures that every transaction is recorded and cannot be altered, thus providing a secure and transparent financial system.
#### The Proliferation of Altcoins
Following Bitcoin's success, thousands of alternative cryptocurrencies, or altcoins, have emerged. Each of these altcoins aims to improve upon Bitcoin or serve specific purposes within the digital economy. Notable examples include Ethereum, which introduced smart contracts – self-executing contracts with the terms of the agreement
5 Compelling Reasons to Invest in Cryptocurrency NowDaniel
In recent years, cryptocurrencies have emerged as more than just a niche fascination; they have become a transformative force in global finance and technology. Initially propelled by the enigmatic Bitcoin, cryptocurrencies have evolved into a diverse ecosystem of digital assets with the potential to reshape how we perceive and interact with money.
5 Compelling Reasons to Invest in Cryptocurrency Now
Fund selection based on fund characteristics budiono
1. The Journal of Financial Research • Vol. XXXIII, No. 3 • Pages 249–265 • Fall 2010
MUTUAL FUNDS SELECTION BASED ON FUNDS
CHARACTERISTICS
Diana P Budiono
.
Erasmus University Rotterdam
Martin Martens
Erasmus University Rotterdam and Robeco Asset Management
Abstract
The popular investment strategy in the literature is to use only past performance to
select mutual funds. We investigate whether an investor can select superior funds
by additionally using fund characteristics. After considering the fund fees, we
find that combining information on past performance, turnover ratio, and ability
produces a yearly excess net return of 8.0%, whereas an investment strategy that
uses only past performance generates 7.1%. Adjusting for systematic risks, and
then using fund characteristics, increases yearly alpha significantly from 0.8% to
1.7%. The strategy that also uses fund characteristics requires less turnover.
JEL Classification: G11, G14, G19
I. Introduction
Existing studies document that past performance of mutual funds can be used to
predict future performance. For example, Elton, Gruber, and Blake (1996) rank
mutual funds on their risk-adjusted performance and subsequently find that the
top-decile funds outperform the bottom-decile funds. Similarly, Elton, Gruber, and
Busse (2004) rank mutual funds on their risk-adjusted performance and observe
that the rank correlation between the deciles that are based on past and realized risk-
adjusted performance is high. Moreover, Hendricks, Patel, and Zeckhauser (1993)
base their ranking on returns, and performance persists for a one-year evaluation
horizon. Accordingly, investors can implement the momentum strategy, that is,
buying the past winner funds. As documented by many studies (e.g., Hendricks,
Patel, and Zeckhauser 1993; Carhart 1997), this strategy produces positive risk-
adjusted returns but is not statistically significant. We examine whether investors
can improve selecting mutual funds by also using fund characteristics. In short, we
find that some fund characteristics significantly predict future performance and that
We are grateful to an anonymous referee for many useful comments.
249
c 2010 The Southern Finance Association and the Southwestern Finance Association
2. 250 The Journal of Financial Research
TABLE 1. Existing Findings.
t-statistic of
Study Alpha Expense Size Age Turnover 3-Year Alpha
Bollen, Busse (2005) V∗∗
Carhart (1997) V∗∗ V V∗∗
Carhart (1997) V∗∗
Chen et al. (2004) V V∗∗ V V
Elton, Gruber, and Blake (1996) V∗∗ V∗∗
Elton, Gruber, and Busse (2004) V∗∗ V∗∗
Grinblatt, and Titman (1994) V V∗∗
Kacperczyk, Sialm, and Zheng (2005) V V∗∗ V V∗∗
Kosowski, Naik, and Teo (2007) V V
Wermers (2000) V∗∗
Note: This table presents a summary of what other influential studies find about the relation between
mutual fund performance and fund characteristics (alpha, expense, size, age, turnover, t-statistic of three-
year alpha). The v marks which fund characteristic is studied by the corresponding study in each row. The ∗∗
denotes that the variable significantly explains fund performance at the 5% significance level. If the author
uses a single variable to rank mutual funds, ∗∗ denotes that the difference of the performance between the
top and bottom portfolios is significant at the 5% significance level.
investors can improve the performance of their portfolios by using those variables
in their investment strategy.
Table 1 summarizes the findings of influential studies that discuss the rela-
tion between fund characteristics and fund performance. Besides explaining mutual
fund performance by regression, several of these studies use one characteristic to
rank funds. Bollen and Busse (2005) investigate whether mutual fund performance
persists by ranking funds on their risk-adjusted returns and find that short persis-
tence exists. Carhart (1997) discovers that investment expenses and turnover explain
persistence in mutual fund risk-adjusted returns. Furthermore, Chen et al. (2004)
document that the size of mutual fund erodes its performance, and Elton, Gruber, and
Blake (1996) conclude that mutual fund past performance (e.g., three-year alpha,
t-statistic of three-year alpha) can predict its future risk-adjusted return. Moreover,
Elton, Gruber, and Busse (2004) report that the performance of low-expense funds
or high-past-returns funds is higher than that of the portfolio of index funds that
are selected by investors. Grinblatt and Titman (1994) show that fund turnover ex-
plains the risk-adjusted returns of mutual funds, and Kacperczyk, Sialm, and Zheng
(2005) demonstrate that fund size and turnover determine fund performance. More-
over, Kosowski, Naik, and Teo (2007) report that ranking funds on their t-statistics
of alphas demonstrates more persistent performance than ranking funds on their
alphas. And Wermers (2000) finds that funds that trade more frequently produce
better performance than funds that trade less. In summary, past performance al-
ways appears to play a significant role in predicting future performance, and in
most cases turnover ratio also explains fund performance significantly. However,
3. Mutual Funds Selection 251
conclusions about expense ratio, size, and the t-statistic of the three-year Fama
and French (1993) alpha are mixed as some authors agree that they can explain or
predict performance whereas others conclude the opposite. Finally, fund age never
appeares to significantly explain performance.
In this study, we test a new predictive variable ability that measures risk-
adjusted fund performance from the time the fund exists until the moment we
want to predict future performance. In short, it is the t-statistic of the Fama and
French (1993) alpha that is measured over the life of a fund. The intuition is the
following. Given two funds that have the same age, we prefer to choose the fund
that has the highest performance during its whole life. Additionally, given two
funds that have a similar risk-adjusted performance, we prefer the fund that has
already made this performance over a longer period. In a way, it combines age
and risk-adjusted performance. Previous studies use the t-statistic of alpha over
a particular window, usually three years, but not over the full life of a fund. As
far as we know, only Barras, Scaillet, and Wermers (2010) use the t-statistic for
ability to identify the number of (un)skilled funds in the universe but not to predict
alphas.
Having investigated all aforementioned fund characteristics, we find that
past performance, turnover ratio, and ability of mutual funds can significantly pre-
dict future performance. Past performance predicts future performance because
enough of those winners are skilled managers. Additionally, skilled managers that
trade more often (high-turnover funds) use their skills and information more of-
ten, resulting in better performance than low-turnover funds. The significance of
the turnover ratio corresponds to the findings of Grinblatt and Titman (1994),
Kacperczyk, Sialm, and Zheng (2005), and Wermers (2000). Because the turnover
ratio in subsequent years is highly correlated, we find it not only explains but also
predicts mutual fund performance.
Next, we use all three variables to select funds. Hence, instead of ranking
funds on past performance, we rank them on their predicted performance based on
three variables. Thus, we use several fund characteristics to select funds whereas
other studies use only one characteristic. By selecting funds that have the highest
10% predicted performance (the predicted alpha strategy) and then forming and
rebalancing the portfolios yearly, our investment strategy delivers a risk-adjusted
return that is significantly higher than selecting funds that have the highest 10% past
performance (the momentum strategy). The difference between the risk-adjusted
returns of both strategies is 0.86% per year, with a t-statistic of 2.98. The risk-
adjusted returns of the predicted alpha strategy and the momentum strategy are
1.70% and 0.84% per year, respectively. These risk-adjusted returns are already
estimated from net returns and in excess of the one-month Treasury bill rate. The
results remain robust if we select the top 5%, the top 20%, or the top 20 funds.
Moreover, the predicted alpha strategy not only has higher risk-adjusted return but
also higher total net return, Sharpe ratio, and less turnover than the momentum
4. 252 The Journal of Financial Research
strategy. Hence, the implementation of the predicted alpha strategy is cheaper than
that of the momentum strategy.
II. Data and Method
We extract the data from the Center for Research in Security Prices (CRSP)
Survivor-Bias-Free U.S. Mutual Fund database that covers 1962 to 2006. We ex-
clude balanced funds, bond funds, flexible funds, money market funds, mortgage-
backed funds, multimanager funds, and international funds. Each fund included
in the sample is classified as either small company growth, aggressive growth,
growth, income, growth and income, or maximum capital gains, according to the
classification provided by Wiesenberger, Micropal/Investment Company Data Inc.
(ICDI), and Standard & Poor’s. This funds selection is similar to that of Pastor and
Stambaugh (2002). We only include funds that do not charge front and rear load
fees because the net return data from the CRSP database is net of expenses and fees,
except load fees. At the same time, the magnitude of load fees can be significant.
For example, Livingston and O’Neal (1998) show that the annual front load fees
can vary from 1% to 8.5%. Because in this article we aim to fund strategies that
have better net performance, we want the return data of individual mutual fund to
be net of load fees as well.
Fund returns are available monthly, whereas fund characteristics are re-
ported annually. Returns are calculated in excess of the one-month Treasury bill
rate. The fund characteristics that are included in our analysis are (1) alpha, which
is estimated in equation (1) below from monthly returns during a three-year win-
dow; (2) ability, which is calculated from the t-statistic of alpha in equation (1) and
is estimated from the time when the fund exists until the time of observation; (3)
expense ratio, which is the ratio between all expenses (e.g., 12b-1 fee, management
fee, administrative fee) and total net assets; (4) size, which is proxied by the fund’s
total net assets that is reported in millions of U.S. dollars; (5) age, which is the
duration between the time the fund exists and the time of observation, and it is
reported in the number of months; (6) turnover ratio, which is the minimum of
aggregated sales or aggregated purchases of securities, divided by total net assets;
and (7) volatility, which is standard deviation of returns over a 12-month window.
ri ,t = αi + β1,i RMRF t + β2,i SMBt + β3,i HMLt + εi ,t , (1)
where ri ,t is the excess return of fund i in month t, RMRF t is the excess return on the
market portfolio, SMBt is the excess return on the factor-mimicking portfolio for
size (small minus big), HMLt is the excess return on the factor-mimicking portfolio
5. Mutual Funds Selection 253
for the book-to-market ratio (high minus low),1 and εi ,t is the residual return of
fund i in month t.
We divide the sample into two groups, each of which has about 4,000 funds.
The first group is used to analyze which fund characteristics predict performance,
and the second group is used to validate the selected fund characteristics from
the previous analysis. Subsequently, we use all funds to implement the momentum
strategy and the strategy that uses fund characteristics besides past performance. To
measure risk-adjusted performance for the strategies we use three-year alphas from
equation (1). We divide the funds according to several criteria in sequence. These
criteria are return, alpha, size, expense ratio, turnover ratio, age, and volatility of
fund returns. For example, the entire sample is first split between high- and low-
return funds. Then each of these is divided into high- and low-alpha funds. Hence, in
total there are four groups of funds (high-return/high-alpha funds, high-return/low-
alpha funds, low-return/high-alpha funds, and low-return/low-alpha funds). We
proceed with other characteristics in the same manner. At the end, there are 128
subsets of funds. Next, we put half of each subset in the first group, and the other
half in the second group.
III. Predictability of Mutual Fund Performance
To analyze the predictability of mutual fund performance, we regress the alphas of
individual funds on their characteristics in the previous period,
αt+1 to t +3,i = z 0 + z 1 αt−2 to t ,i + z 2 abilityt ,i + z 3 expenset ,i
ˆ ˆ ˆ ˆ
+ z 4 sizet ,i + z 5 aget ,i + z 6 turnovert ,i + z 7 volatilityt ,i + εt ,i , (2)
ˆ ˆ ˆ ˆ ˆ
where α t+1 to t+3,i is estimated from fund i’s monthly returns during year t + 1 until
year t + 3 using equation (1). The fund characteristics in each year are standard-
ized by deducting the cross-sectional mean and dividing by the cross-sectional
standard deviation. This avoids numerical problems and makes the loadings of
the different characteristics comparable. Following Fama and MacBeth (1973), the
cross-sectional regression is implemented every year, and we compute the mean
and t-statistic from the yearly loadings.
As we mention in Section II, we create two groups of funds based on
several criteria. The first group is used to analyze which fund characteristics pre-
dict performance whereas the second group is used to validate the selected fund
characteristics. By using the first group of funds from 1962 to 2006, Panel A of
Table 2 shows whether a fund characteristic predicts fund performance. We find
1
We thank Kenneth French for providing the RMRF, SMB, and HML factor data.
6. 254 The Journal of Financial Research
TABLE 2. Predictability Power of Fund Characteristics.
Panel A. Full Period
Load t
Adj R2 0.119
Intercept 0.036 1.722
Alpha 0.160 3.793
Ability 0.059 1.765
Expense −0.062 −1.439
Log size −0.050 −1.506
Log age −0.028 −1.986
Turnover 0.076 2.477
Volatility 0.039 1.002
Panel B. Subperiods
First Sample Second Sample
Load t Load t
Adj R2 0.160 0.080
Intercept 0.054 1.296 0.019 2.252
Alpha 0.256 3.628 0.064 1.736
Ability 0.028 0436 0.089 5.954
Expense −0.100 −1.190 −0.023 −1.448
Log size −0.070 −1.084 −0.029 −1.867
Log age −0.025 −1.042 −0.031 −2.012
Turnover 0.130 2.345 0.021 1.010
Volatility 0.019 0.307 0.058 1.271
Note: The sample is divided into two groups of funds according to seven criteria in sequence; each time
funds are split into two based on a criterion. Hence, after using all criteria to split funds, there are 128
subsets of funds that have different characteristics. Next, for each subset half are put in the first group and
the other half are put in the second group. The first group is used to analyze which fund characteristics
predict performance and the second group is used to validate the findings from the first group. This table
shows the results of the first group of funds. Three-year alphas of individual funds are regressed on their
characteristics (alpha, ability, expense, log size, log age, turnover, and volatility) in the previous period by
using equation (2). The results of the full period use data from 1962 to 2006, whereas those of the first and
second subperiods use data from 1962 to 1984 and 1985 to 2006, respectively.
that the past alpha and turnover ratio most significantly predict the future alpha,
which confirms results in the existing literature summarized in Table 1. However,
if we divide the sample into two subperiods, we observe that past alpha becomes
insignificant in the second subperiod and ability becomes highly significant (see
Panel B of Table 2). In unreported results, we also conduct the regression with-
out alpha and find that ability is significant in both subperiods. Similarly, when
leaving out ability, the past alpha is significant in both subperiods. Moreover, by
using the F-test, we reject the null hypothesis that the omitted variable has a zero
coefficient. Hence, it is important to include both alpha and ability in the analy-
sis despite their correlation being 0.68. From these results, the selected variables
7. Mutual Funds Selection 255
for the implementation of an investment strategy are, therefore, alpha, ability, and
turnover.2
The significance of past alpha and ability shows that funds that had good
(bad) performance will continue to do well (poorly). Using both alpha and ability is
more accurate than just using alpha, because ability takes into account how long the
fund has been performing well. Additionally, the fund turnover ratio has a positive
relation with future alpha. According to Grinblatt and Titman (1994), turnover
ratio explains performance because a skilled manager who uses his or her superior
information to trade more often will improve performance. Additionally, Korkie
and Turtle (2002) document that a manager creates value for his or her portfolio
from both the frequency and the timing of trading assets. Furthermore, we observe
that turnover ratio is highly autocorrelated, which indicates that a fund that trades
actively will continue to do so. These findings show that a skilled fund manager
who trades actively will deliver a good-future alpha.
Next, alpha, ability, and turnover ratio are validated on the other half of the
fund universe. The predicted alpha of each fund is estimated from the three variables
and then funds are ranked on their predicted alphas. We find that the difference of
alphas between the top and bottom deciles of predicted alpha portfolios is equal to
2.52% per year and significant (t-statistic = 2.44). Moreover, the alpha differences
are still significant in both subperiods (1978 to 1992 and 1993 to 2006) with a
significance level of 5%. From 1978 to 1992, the alpha difference is equal to
3.31% per year with a t-statistic of 1.85, and from 1993 to 2006 it is equal to 1.60%
per year with a t-statistic of 1.80. These results are presented in Table 3. Hence, the
part of the universe that is kept for out-of-sample testing confirms that the three
variables (alpha, ability, and turnover ratio) predict future alpha. For comparison,
we also show the results for the first half of the fund universe that is used to analyze
which fund characteristics predict alpha in Table 3. We observe that the t-statistics
of the alphas from the first half and second half of the fund universe are similar
during the full sample (1978 to 2006). The t-statistics are 2.81 and 2.44, respectively.
Additionally, we also test and find that the alphas between both groups of funds
are not significantly different (t-statistic of 1.1). Furthermore, when we test the
difference of the returns between both groups of funds, we again find that their
returns are not significantly different (t-statistic of 0.8). The conclusion stays the
same when we analyze the difference in alphas and returns between both groups in
subperiods from 1978 to 1992 and from 1993 to 2006.
2
We also tested the inclusion of the selected variables in a nonlinear way. First, we looked at using
products of variables, such as alpha times fund characteristics. Second, we used quintile dummies as an
alternative; that is, instead of alpha we included five dummies that are 1 if the observed alpha belongs to
the corresponding quintile and 0 otherwise. In both cases we did not find a significant improvement over
the linear specification in equation (2).
8. 256 The Journal of Financial Research
TABLE 3. The Predictability of Alpha from Fund Characteristics.
Full Sample 1978–92 1993–2006
First Group Second Group First Group Second Group First Group Second Group
Alpha 4.140 2.519 5.452 3.311 2.042 1.597
Alpha-t 2.806 2.440 2.349 1.848 1.286 1.796
Return 2.615 1.426 4.649 2.200 0.436 0.596
Sharpe 0.254 0.214 0.484 0.291 0.039 0.107
Difference 1.621 2.141 0.445
Difference-t 1.119 0.881 0.381
Note: The sample is divided into two groups of funds according to seven criteria in sequence; each time
funds are split into two based on a criterion. Hence, after using all criteria to split funds, there are 128
subsets of funds that have different characteristics. Next, for each subset half are put in the first group
and the other half are put in the second group. The first group of funds is used to analyze which fund
characteristics predict the future alpha, whereas the second group is used to validate the selected fund
characteristics that significantly predict the future alpha. Next, mutual funds are ranked on their predicted
alphas that are estimated from previous alpha, ability, and turnover ratio. This table shows the results of
the differential returns between the top and bottom deciles of predicted alpha portfolios. The full sample
reports the results from 1978 to 2006. The annual Fama and French alpha, the t-statistics of the Fama and
French alpha, the annual return, and the annual Sharpe ratio of the differential returns between the top and
bottom deciles are shown. Difference is the Fama and French alpha of the return differential between the top
portfolio returns of the momentum and the predicted alpha strategies, and Difference-t is the t-statistics of
Difference.
IV. Investment Strategies
In this section, we implement both the predicted alpha and the momentum strate-
gies by using the entire mutual fund universe. To implement the predicted alpha
strategy, we first estimate the loadings on the fund characteristics for the in-sample
period using equation (2) with past alpha, ability, and turnover as the three regres-
sors. The in-sample period expands over the years. To have enough data to estimate
the loadings, the first in-sample period from 1962 to 1977 is used to predict the
mutual fund alphas of 1978 to 1980. Based on these predicted alphas, we form
10 decile portfolios and rebalance these portfolios yearly. For comparison, we also
implement the momentum strategy that ranks funds only on their past alphas. Ta-
ble 4 shows the results of both strategies for the top 10%, bottom 10%, and the
differential returns between the top and bottom 10% portfolios. We focus on the
results of the top portfolio because regulation does not allow the short selling of
mutual funds. The results in Table 4 show that the top portfolio of the predicted
alpha strategy has higher alpha than that of the momentum strategy. The difference
between both alphas is 0.86% per year, and this difference is significant at the 1%
level. To calculate the significance of the difference between the alphas of both
strategies, we first compute the yearly differences between the top-decile returns of
9. Mutual Funds Selection 257
TABLE 4. The Momentum and Predicted Alpha Strategies.
Momentum Strategy Predicted Alpha Strategy
T B T-B T B T-B
Alpha 0.839 −1.536 2.376 1.699 −1.561 3.260
Alpha-t 0.881 −1.994 1.910 1.837 −2.311 2.817
Return 7.094 6.223 0.871 7.946 5.986 1.961
Sharpe 0.433 0.469 0.109 0.482 0.489 0.230
Turnover 1.037 1.109 1.074 0.891 0.977 0.935
T
Difference −0.860
Difference-t −2.983
Note: T, B, and T-B denote the top-decile portfolio, the bottom-decile portfolio, and the difference between
the top- and bottom-decile portfolios. This table reports the annual Fama and French alpha, the t-statistics of
the Fama and French alpha, the annual return, the annual Sharpe ratio, and the annual turnover ratio of T, B,
and T-B. Difference is the Fama and French alpha of the return differential between the top portfolio returns
of the momentum and the predicted alpha strategies, and Difference-t is the t-statistics of Difference. All
values are ex post performance of the strategies from 1978 to 2006.
the momentum and the predicted alpha strategies, and subsequently use equation
(1) to calculate the alpha and its t-statistic. The t-statistic is 2.98. This method is
used by Wermers (2000), among others. Alternatively, following Bollen and Busse
(2005), we first estimate nonoverlapping three-year alphas from 1978 to 2006, so
that we have 10 alphas for each strategy. Then we compute the mean difference and
do a mean test. In this case the t-statistic is 2.67. These results demonstrate that a
fund of funds manager can select funds better by using ability and turnover ratio,
in addition to past alpha.3 Given that the average alpha of mutual funds is equal to
−0.17% per year, these findings clearly show that both strategies can select funds
well.
The total return and Sharpe ratio of the top decile from the predicted alpha
strategy are also higher than those of the top decile from the momentum strategy.
The average annual return is 7.95% with a Sharpe ratio of 0.482 for the predicted
alpha strategy, compared to 7.09% and 0.433 for the momentum strategy. For com-
parison, the average mutual fund return is 4.27% with a Sharpe ratio of 0.319.
Furthermore, the implementation of the predicted alpha strategy is cheaper than
3
In unreported results, we also use the parameter estimates based on the first group of funds and then
use the estimated coefficients to predict alphas for the second group of funds. We again find that the alpha
of the predicted alpha strategy significantly outperforms that of the momentum strategy, by 0.62% per year
(the t-statistic is 2.74). Similarly, when we repeat the procedure with the roles of the two groups reversed,
we find a significant alpha difference of 0.83% per year with a t-statistic of 2.65. This underscores the
robustness of the results.
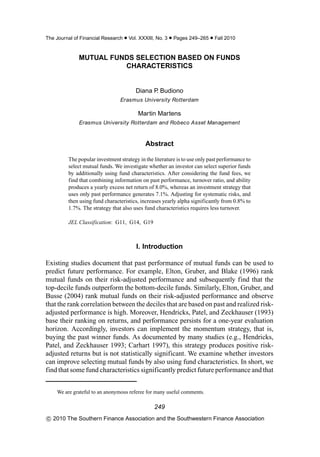
10. 258 The Journal of Financial Research
Loadings
alpha
ability
0.25 turnover
0.2
0.15
0.1
0.05
0
78 79 80 81 82 83 84 85 86 87 88 89 90 91 92 93 94 95 96 97 98 99 0 1 2 3 4 5 6
year
Figure I. Fund Characteristics Loadings. Fund alphas are regressed on previous alphas, abilities, and
turnover ratios by using equation (2), except that we drop the four other variables. This figure
shows the loadings of the three predictors when we implement the predicted alpha strategy in
Table 4.
that of the momentum strategy because fewer trades are required to hold the top
10% every year. Investing in the top decile of the momentum strategy requires, on
average, replacing almost 52% of the top-decile names of the previous year whereas
for the predicted alpha strategy almost 45% of the names need to be changed.4
Figure I demonstrates the loadings of the three variables over time, and Figure II
shows the cumulative returns of the momentum strategy and the predicted alpha
strategy. These are total returns that have not been adjusted for systematic risks or
transaction costs.
Next, we investigate what kinds of funds both strategies select in the top
portfolio. Table 5 shows that compared to the average of all funds shown in the final
column, both strategies select funds that have higher return, higher alpha, higher
ability, lower expense, bigger size, higher volatility, higher age, and a larger exposure
4
It is impossible to draw a conclusion about the net (risk-adjusted) returns of the strategies. We exclude
load funds, but this leaves possible purchase fees, redemption fees, exchange fees, and account fees. Such
fund data are not available although such costs are probably minimal for most funds. Boudoukh et al. (2002)
say on trading no-load funds that there are “limited transaction costs in many cases.”
11. Mutual Funds Selection 259
Cumulative total returns
Before adjusting for risk(alpha) and turnover momentum
predicted alpha
25
20
15
10
5
0
78 79 80 81 82 83 84 85 86 87 88 89 90 91 92 93 94 95 96 97 98 99 0 1 2 3 4 5 6
year
Figure II. Cumulative Returns. This figure shows the cumulative returns of the momentum strategy and
the predicted alpha strategy from 1978 to 2006.
to small-cap stocks and growth stocks. The main difference is that the predicted
alpha strategy selects higher turnover funds in the top whereas the momentum
strategy selects funds in the top and bottom 10% with a similar average turnover
ratio. In addition, the predicted alpha strategy emphasizes less strongly three-year
alpha and has a larger difference in ability between top and bottom. We also note
that both strategies choose lower expense funds in the top portfolio compared to
those in the bottom portfolio. This is not surprising as it is already documented
in the literature that expense ratio has a negative correlation (either significant or
not) with performance. Additionally, the top portfolio from both strategies contains
funds that have higher volatility than those in the bottom portfolio. Moreover, high-
ability funds are bigger. If all funds are ranked only on their ability, the average
size of a fund in the top and bottom portfolio is US$147.78 million and US$18.79
million, respectively. Moreover, because both the momentum and the predicted
alpha strategies have high-ability funds in the top portfolios, these portfolios also
contain funds with more assets under management than the average. Finally, similar
to what the existing literature has documented (see Kosowski et al. 2006; Huij and
Verbeek 2007), the top performance funds have higher exposure to SMB but lower
exposure to HML.
12. 260 The Journal of Financial Research
TABLE 5. Fund Characteristics in the Top- and Bottom-Decile Portfolios.
Momentum Strategy Predicted Alpha Strategy
All
T B Diff Diff-t T B Diff Diff-t Funds
Return 12.42 −1.31 13.73 8.83 11.50 −0.95 12.45 7.53 4.15
3-year alpha 8.60 −8.23 16.84 24.56 7.42 −7.19 14.59 20.17 −0.04
Ability 1.33 −0.88 2.22 25.14 1.54 −1.38 2.92 28.42 0.08
Expense 1.22 1.53 −0.31 −5.22 1.26 1.48 −0.23 −3.63 1.28
Size 75.72 26.56 49.17 3.83 99.51 18.18 81.33 3.96 42.26
Age 120.54 130.88 −10.34 −3.88 116.56 123.83 −7.27 −2.14 87.35
Turnover 0.78 0.86 −0.07 −1.12 1.78 0.52 1.26 5.64 0.87
Volatility 5.63 4.98 0.65 2.85 5.65 4.61 1.04 4.44 4.72
Exposure 0.90 0.91 −0.003 −0.12 0.86 0.86 0.002 0.05 0.89
to RMRF
Exposure 0.34 0.32 0.03 0.74 0.33 0.25 0.08 2.84 0.20
to SMB
Exposure −0.19 0.02 −0.21 −4.94 −0.20 0.06 −0.26 −6.67 −0.05
to HML
Note: This table demonstrates the ex ante characteristics of funds that are selected in the top and bottom
portfolios when we implement the momentum and the predicted alpha strategies from 1978 to 2006. T and
B denote the top- and bottom-decile portfolios. Diff shows the average difference between the characteristic
values of the top- and bottom-decile portfolios, and Diff-t reports the t-statistics of the difference. RMRF
is excess return on the market portfolio, SMB is excess return on the factor-mimicking portfolio for size
(small minus big), and HML is excess return on the factor-mimicking portfolio for the book-to-market ratio
(high minus low). Additionally, we show the average characteristics of all funds.
TABLE 6. N-Year Moving Window.
1 Year 2 Year 3 Year 4 Year 5 Year 6 Year 7 Year 8 Year 9 Year 10 Year
Alpha 1.508 1.830 1.390 1.426 1.487 1.620 1.691 1.744 1.810 1.735
Alpha-t 2.111 2.264 1.947 2.064 1.919 1.932 2.038 2.127 2.165 2.042
Return 8.016 8.141 7.859 7.975 7.854 8.009 8.191 8.404 8.264 8.144
Sharpe 0.497 0.511 0.487 0.492 0.486 0.492 0.500 0.509 0.501 0.492
Turnover 0.966 0.863 0.852 0.826 0.782 0.764 0.759 0.776 0.767 0.772
(N-Expanding) −0.192 0.130 −0.310 −0.274 −0.212 −0.079 −0.010 0.044 0.110 0.036
(N-Expanding)-t −0.476 0.324 −0.732 −0.612 −0.540 −0.220 −0.027 0.123 0.331 0.127
Note: The table shows the results (the annual Fama and French alpha, the t-statistics of the Fama and French
alpha, the annual return, the annual Sharpe ratio, and the annual turnover ratio) of the predicted alpha
strategy when it uses 1-year, 2-year, . . . , 10-year moving windows to estimate the loadings of the fund
characteristics. (N-Expanding) denotes the difference of the alphas that use N-year moving window and
expanding window while (N-Expanding)-t reports the t-statistics of the difference.
V. Robustness Checks
In this section, we do robustness checks on the predicted alpha strategy results.
First, the predicted alpha strategy is implemented based on an expanding window
to estimate the in-sample parameters. Here we observe whether the performance of
the strategy changes significantly if rolling windows are used. Table 6 demonstrates
13. Mutual Funds Selection 261
TABLE 7. The Carhart Alpha.
Momentum Strategy Predicted Alpha Strategy
T B T-B T B T-B
Alpha 0.338 −1.561 1.900 1.006 −1.980 2.986
Alpha-t 0.391 −2.163 1.645 1.219 −2.844 2.836
Return 6.960 6.720 0.240 7.644 6.002 1.642
Sharpe 0.448 0.482 0.022 0.502 0.453 0.270
Turnover 1.109 1.115 1.112 0.899 0.987 0.944
T
Difference −0.667
Difference-t −2.466
Note: Mutual funds are ranked and analyzed by the Carhart alpha. This table reports the Carhart alpha, the
t-statistics of the Carhart alpha, the annual return, the annual Sharpe ratio, and the annual turnover ratio of
the momentum and the predicted alpha strategy. T, B, and T-B denote the top-decile portfolio, the bottom-
decile portfolio, and the difference between the top- and bottom-decile portfolios, respectively. Difference
is the Fama and French alpha of the return differential between the top portfolio returns of the momentum
and the predicted alpha strategies, and Difference-t shows the t-statistics of Difference.
the performance of the top 10% portfolio when the parameters are estimated with 1-
year to 10-year rolling windows. We also show the difference with the alphas based
on the expanding window and the t-statistic of this difference. The performance
of the predicted alpha strategy turns out to be similar regardless of a rolling or an
expanding window.
Second, several studies use the four-factor alphas (including momentum
as a fourth factor in equation (1)) to rank mutual funds (see, e.g., Carhart 1997;
Bollen and Busse 2005). Here we investigate whether the predicted alpha strategy
still outperforms the momentum strategy if four-factor alphas, instead of three-
factor alphas, are used to rank mutual funds and to determine the risk-adjusted
performance of the strategies. Table 7 shows that the predicted alpha strategy still
outperforms the momentum strategy at the 5% significance level. The difference
of the out-of-sample alphas between both strategies is 0.67% per year (t-statistic
of 2.47). We do note that the ex post four-factor alphas are lower than the ex post
three-factor alphas in Table 4. Also, for Carhart alphas, the predicted alpha strategy
has a higher return, higher Sharpe ratio, and a lower turnover than the momentum
strategy.
Third, so far we only show the results of the top and bottom 10% portfolios.
The number of funds in each decile varies from 15 to 300. In Table 8 we show the
top and bottom 20% and 5% of both strategies. In addition, we show the results
when selecting 20 funds that have the highest and the lowest past alphas. We find
that the top portfolio of the predicted alpha strategy always has higher alpha than
that of the momentum strategy, and the bottom portfolio of the predicted alpha
strategy always has lower alpha than that of the momentum strategy. Additionally,
14. 262 The Journal of Financial Research
TABLE 8. The Portfolios of the Top and Bottom 20%, 5%, and 20 Funds.
20% 5% 20 Funds
T B T-B T B T-B T B T-B
Momentum strategy
Alpha 0.511 −1.202 1.714 1.480 −2.102 3.582 2.032 −0.949 2.982
Alpha-t 0.737 −2.113 1.902 1.085 −1.988 2.023 1.200 −1.390 1.584
Return 6.922 6.264 0.658 7.102 5.851 1.252 6.754 6.667 0.088
Sharpe 0.458 0.487 0.112 0.405 0.421 0.116 0.341 0.501 0.007
Turnover 0.907 0.914 0.911 1.187 1.209 1.199 1.221 1.623 1.423
Predicted alpha strategy
Alpha 1.109 −1.256 2.365 2.408 −2.362 4.770 3.034 −1.124 4.157
Alpha-t 1.633 −2.434 3.103 1.844 −2.437 2.812 1.964 −1.598 2.302
Return 7.568 5.874 1.694 8.158 5.384 2.773 7.925 6.455 1.470
Sharpe 0.495 0.489 0.280 0.460 0.428 0.244 0.394 0.529 0.106
Turnover 0.741 0.791 0.766 1.053 1.159 1.109 1.127 1.591 1.359
Note: The table demonstrates the results (the annual Fama and French alpha, the t-statistics of the Fama
and French alpha, the annual return, the annual Sharpe ratio, and the annual turnover ratio) of the top and
bottom 20% and 5% funds as well as the top and bottom 20 funds.
the turnover needed for the predicted alpha strategy is always lower than that of the
momentum strategy. It is remarkable that selecting the top 20 funds using predicted
alpha gives a risk-adjusted performance of 3.03% per annum at the 5% significance
level, a total return of 7.93% per annum and a Sharpe ratio of 0.394. Hence, it is
feasible to have a fully quantitative fund of fund manager.
Fourth, Table 9 demonstrates how each strategy performs in the two subpe-
riods from 1978 to 1992 and 1993 to 2006. In both subperiods the predicted alpha
strategy significantly outperforms the momentum strategy. The difference between
the alphas of both strategies is equal to 0.86% and 0.90% per year with t-statistics
of 1.93 and 2.79 for the two subperiods, respectively. We do note that the alphas
of both strategies are negative from 1993 to 2006. Barras, Scaillet, and Wermers
(2010) find that the proportion of skilled funds decreases over time. Replicating
their method, we find that the proportion of skilled funds decreases from 6.8% in
the 1978–1992 period to 3.5% in the 1993–2006 period. Hence, it is not surprising
that the average alpha of the top 10% is negative for both strategies, also given that
the average alpha over all mutual funds is −1.38% from 1993 to 2006. Given the
low number of skilled funds in this period, we looked at the performance of the top
20 funds according to the predicted alpha.5 We find it to be positive at 0.50%. In
comparison, the top 20 funds according to the momentum strategy gives an alpha
of −0.14%.
Finally, we compare the performance of the predicted alpha strategy and
the buy-and-hold benchmark strategy. We choose the S&P 500 index for the
5
The results are not reported in the table but are available upon request.
15. TABLE 9. Subperiod Performance.
1978–92 1993–2006
Momentum Strategy Predicted Alpha Strategy Momentum Strategy Predicted Alpha Strategy
T B T-B T B T-B T B T-B T B T-B
Alpha 2.645 −0.792 3.437 3.505 −0.733 4.240 −1.553 −2.339 0.785 −0.658 −2.426 1.769
Alpha-t 1.774 −0 696 1.805 2.366 −0.716 2.293 −1.506 −2.425 0.513 −0.688 −3.080 1.370
Return 8.364 6.163 2.201 9.322 6.019 3.302 5.735 6.287 −0.552 6.472 5.950 0.522
Sharpe 0.521 0.437 0.287 0.573 0.459 0.415 0.343 0.509 −0.067 0.385 0.528 0.057
Turnover 1.003 1.073 1.040 0.911 0.996 0.955 1.074 1.147 1.111 0.871 0.956 0.914
T
Difference −0.860 −0.896
Difference-t −1.933 −2.785
Mutual Funds Selection
Note: T, B, and T-B denote the top-decile portfolio, the bottom-decile portfolio, and the difference between the top- and bottom-decile portfolios, respectively.
This panel reports the annual Fama and French alpha, the t-statistics of the Fama and French alpha, the annual return, the annual Sharpe ratio, and the annual
turnover ratio of T, B, and T-B from 1978 to 1992 and from 1993 to 2006. Difference is the Fama and French alpha of the return differential between the top
portfolio returns of the momentum and the predicted alpha strategies, and Difference-t shows the t-statistics of Difference.
263
16. 264 The Journal of Financial Research
TABLE 10. The Buy-and-Hold Strategy.
S&P 500
Alpha −2.615
Return 4.549
Sharpe 0.306
Turnover 0.000
Note: This table shows the annual Fama and French alpha, the annual return, and the annual Sharpe ratio
of S&P 500 index from 1978 to 2006.
benchmark. The three-factor alpha of the S&P 500 index is −2.62% per year
for 1978 to 2006 whereas the out-of-sample three-factor alpha of the predicted al-
pha strategy is 1.70% per year. Additionally, the average annual return and Sharpe
ratio of the S&P 500 index are 4.55% and 0.306, respectively, whereas the out-of-
sample annual return and Sharpe ratio of the predicted alpha strategy are 7.95%
and 0.482, respectively. Hence, the predicted alpha strategy is more profitable than
the aforementioned buy-and-hold strategy. Table 10 presents these results.
VI. Conclusion
A common investment strategy in the literature uses only past performance informa-
tion to select mutual funds. We show that a fund of funds manager can select funds
better by using not only past performance but also the turnover ratio and ability.
This improves the out-of-sample alpha, total return, and Sharpe ratio. These find-
ings demonstrate that some fund characteristics significantly predict performance.
Moreover, the newly proposed strategy also requires less turnover, and hence it is
economically more interesting than the strategy that uses only past performance.
Furthermore, selecting the top 20 funds based on alpha, ability, and the turnover
ratio results in a significant risk-adjusted performance of 3.03% per annum, an
excess return of 7.93% per annum, and a Sharpe ratio of 0.394 from 1978 to 2006.
This compares favorably to the average mutual fund, which has a risk-adjusted
performance of −0.17% per annum, an excess return of 4.27% per annum, and
a Sharpe ratio of 0.319. It also exceeds the S&P 500 index, which over the same
period has an alpha of −2.61% per annum, an excess return of 4.55% per annum,
and a Sharpe ratio of 0.306.
References
Barras, L., O. Scaillet, and R. Wermers, 2010, False discoveries in mutual fund performance: Measuring
luck in estimated alphas, Journal of Finance 65, 179–216.
17. Mutual Funds Selection 265
Bollen, N. P. B., and J. A. Busse, 2005, Short-term persistence in mutual fund performance, Review of
Financial Studies 18, 569–97.
Boudoukh, J., M. Richardson, M. Subrahmanyam, and R. F. Whitelaw, 2002, Stale prices and strategies for
trading mutual funds, Financial Analyst Journal 58, 53–71.
Carhart, M. M., 1997, On persistence in mutual fund performance, Journal of Finance 52, 57–82.
Chen, J., H. Hong, M. Huang, and J. D. Kubik, 2004, Does fund size erode mutual fund performance? The
role of liquidity and organization, American Economic Review 94, 1276–1302.
Elton, E. J., M. J. Gruber, and C. R. Blake, 1996, The persistence of risk-adjusted mutual fund performance,
Journal of Business 69, 133–57.
Elton, E. J., M. J. Gruber, and J. A. Busse, 2004, Are investors rational? Choices among index funds, Journal
of Finance 59, 261–88.
Fama, E. F., and K. R. French, 1993, Common risk factors in the returns on stocks and bonds, Journal of
Financial Economics 33, 3–56.
Fama, E. F., and J. D. MacBeth, 1973, Risk, returns, and equilibrium: Empirical tests, Journal of Political
Economy 81, 607–36.
Grinblatt, M., and S. Titman, 1994, A study of monthly mutual fund returns and performance evaluation
techniques, Journal of Financial and Quantitative Analysis 29, 419–44.
Hendricks, D., J. Patel, and R. Zeckhauser, 1993, Hot hands in mutual funds: Short-run persistence of
relative performance 1974–1988, Journal of Finance 48, 93–130.
Huij, J., and M. Verbeek, 2007, Cross-sectional learning and short-run persistence in mutual fund perfor-
mance, Journal of Banking and Finance 31, 973–97.
Kacperczyk, M., C. Sialm, and L. Zheng, 2005, On the industry concentration of actively managed equity
mutual funds, Journal of Finance 60, 1983–2011.
Korkie, R. M., and H. J. Turtle, 2002, What’s a portfolio manager worth? Journal of Portfolio Management
28, 65–73.
Kosowski, R., N. Y. Naik, and M. Teo, 2007, Do hedge funds deliver alpha? A Bayesian and bootstrap
analysis, Journal of Financial Economics 84, 229–64.
Kosowski, R., A. Timmermann, R. Wermers, and H. White, 2006, Can mutual fund “stars” really pick
stocks? New evidence from a bootstrap analysis, Journal of Finance 61, 2551–96.
Livingston, M., and E. S. O’Neal, 1998, The cost of mutual fund distribution fees, Journal of Financial
Research 21, 205–18.
Pastor, L., and R. F. Stambaugh, 2002, Mutual fund performance and seemingly unrelated assets, Journal
of Financial Economics 63, 315–49.
Wermers, R., 2000, Mutual fund performance: An empirical decomposition into stock-picking talent, style,
trasactions costs, and expenses, Journal of Finance 55, 1655–95.
18. Copyright of Journal of Financial Research is the property of Wiley-Blackwell and its content may not be
copied or emailed to multiple sites or posted to a listserv without the copyright holder's express written
permission. However, users may print, download, or email articles for individual use.