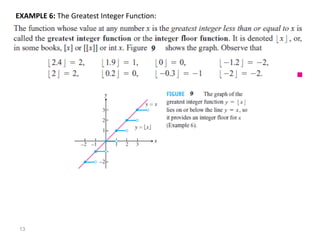
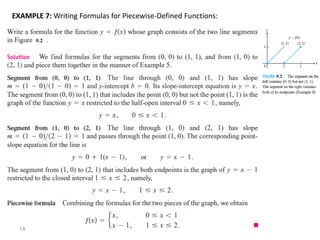
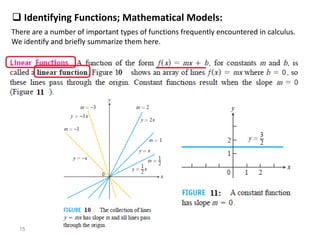
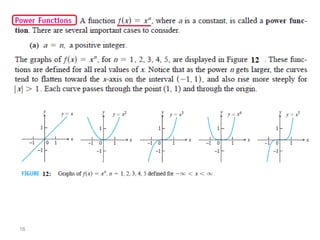
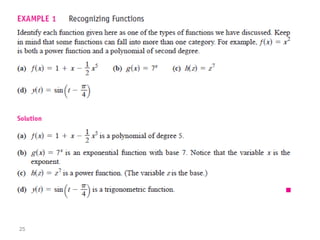
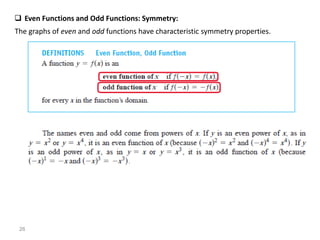
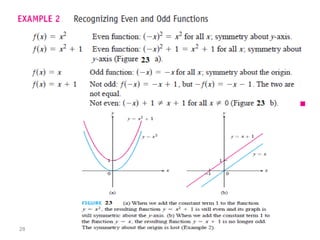
Calculus I
University of Duhok
ECE Department
Prepared by Rafid S. Sarhan
2020-2021
1
1. Functions and Their Graphs:
Functions are the major objects we deal with in calculus because they are key
to describing the real world in mathematical terms. This section reviews the
ideas of functions, their graphs, and ways of representing them.
❑ Functions; Domain and Range
The area of a circle depends on the radius of the circle. The distance an object
travels from an initial location along a straight line path depends on its speed.
In each case, the value of one variable quantity, which we might call y,
depends on the value of another variable quantity, which we might call x.
Since the value of y is completely determined by the value of x, we say that
y is a function of x. Often the value of y is given by a rule or formula that
says how to calculate it from the variable x. For instance, the equation
is a rule that calculates the area A of a circle from its radius r.
In calculus we may want to refer to an unspecified function without having
any particular formula in mind. A symbolic way to say “y is a function of x”
is by writing
2
In this notation, the symbol ƒ represents the function. The letter x, called the
independent variable, represents the input value of ƒ, and y, the
dependent variable, represents the corresponding output value of ƒ at x.
The set D of all possible input values is called the domain of the function.
The set of all values of ƒ(x) as x varies throughout D is called the range of
the function. The range may not include every element in the set Y.
Fig. 1: A diagram showing a function as a kind of machine.
3
EXAMPLE 1: Identifying Domain and Range
Verify the domains and ranges of these functions.
4
❑ Graphs of Functions:
Another way to visualize a function is its graph. If ƒ is a function with
domain D, its graph consists of the points in the Cartesian plane whose
coordinates are the input-output pairs for ƒ. In set notation, the graph is
5
6
EXAMPLE 2 : Sketching a Graph
Solution
7
EXAMPLE 3 Evaluating a Function from Its Graph
8
❑ Representing a Function Numerically
Another way to represent a function is numerically, through a table of values.
Numerical representations are often used by engineers and applied scientists. From
an appropriate table of values, a graph of the function can be obtained
EXAMPLE 4 : A Function Defined by a Table of Values
Musical notes are pressure waves in the air that can be recorded. The data in Table 1
give recorded pressure displacement versus time in seconds of a musical note produced
by a tuning fork. The table provides a representation of the pressure function over time.
9
❑ The Vertical Line Test:
10
❑ Piecewise-Defined Functions:
11
EXAMPLE 5 : Graphing Piecewise-Defined Functions
12
EXAMPLE 6: The Greatest Integer Function:
13
Xr hale bo kchka tr de chit (zhmara point)
EXAMPLE 7: Writing Formulas for Piecewise-Defined Functions:
14
❑ Identifying Functions; Mathematical Models:
There are a number of important types of functions frequently encountered in calculus.
We identify and briefly summarize them here.
15
16
17
18
19
20
21
22
23
24
25
❑ Even Functions and Odd Functions: Symmetry:
The graphs of even and odd functions have characteristic symmetry properties.
26
27
28

Functions and Their Graphs Calculus II..

  • 1.
    Calculus I University ofDuhok ECE Department Prepared by Rafid S. Sarhan 2020-2021 1
  • 2.
    1. Functions andTheir Graphs: Functions are the major objects we deal with in calculus because they are key to describing the real world in mathematical terms. This section reviews the ideas of functions, their graphs, and ways of representing them. ❑ Functions; Domain and Range The area of a circle depends on the radius of the circle. The distance an object travels from an initial location along a straight line path depends on its speed. In each case, the value of one variable quantity, which we might call y, depends on the value of another variable quantity, which we might call x. Since the value of y is completely determined by the value of x, we say that y is a function of x. Often the value of y is given by a rule or formula that says how to calculate it from the variable x. For instance, the equation is a rule that calculates the area A of a circle from its radius r. In calculus we may want to refer to an unspecified function without having any particular formula in mind. A symbolic way to say “y is a function of x” is by writing 2
  • 3.
    In this notation,the symbol ƒ represents the function. The letter x, called the independent variable, represents the input value of ƒ, and y, the dependent variable, represents the corresponding output value of ƒ at x. The set D of all possible input values is called the domain of the function. The set of all values of ƒ(x) as x varies throughout D is called the range of the function. The range may not include every element in the set Y. Fig. 1: A diagram showing a function as a kind of machine. 3
  • 4.
    EXAMPLE 1: IdentifyingDomain and Range Verify the domains and ranges of these functions. 4
  • 5.
    ❑ Graphs ofFunctions: Another way to visualize a function is its graph. If ƒ is a function with domain D, its graph consists of the points in the Cartesian plane whose coordinates are the input-output pairs for ƒ. In set notation, the graph is 5
  • 6.
  • 7.
    EXAMPLE 2 :Sketching a Graph Solution 7
  • 8.
    EXAMPLE 3 Evaluatinga Function from Its Graph 8
  • 9.
    ❑ Representing aFunction Numerically Another way to represent a function is numerically, through a table of values. Numerical representations are often used by engineers and applied scientists. From an appropriate table of values, a graph of the function can be obtained EXAMPLE 4 : A Function Defined by a Table of Values Musical notes are pressure waves in the air that can be recorded. The data in Table 1 give recorded pressure displacement versus time in seconds of a musical note produced by a tuning fork. The table provides a representation of the pressure function over time. 9
  • 10.
    ❑ The VerticalLine Test: 10
  • 11.
  • 12.
    EXAMPLE 5 :Graphing Piecewise-Defined Functions 12
  • 13.
    EXAMPLE 6: TheGreatest Integer Function: 13 Xr hale bo kchka tr de chit (zhmara point)
  • 14.
    EXAMPLE 7: WritingFormulas for Piecewise-Defined Functions: 14
  • 15.
    ❑ Identifying Functions;Mathematical Models: There are a number of important types of functions frequently encountered in calculus. We identify and briefly summarize them here. 15
  • 16.
  • 17.
  • 18.
  • 19.
  • 20.
  • 21.
  • 22.
  • 23.
  • 24.
  • 25.
  • 26.
    ❑ Even Functionsand Odd Functions: Symmetry: The graphs of even and odd functions have characteristic symmetry properties. 26
  • 27.
  • 28.