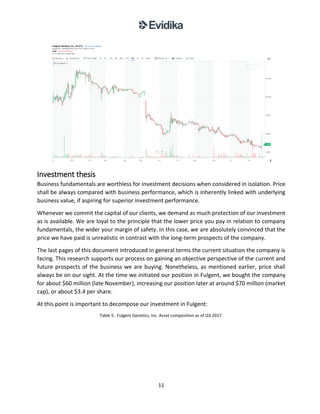
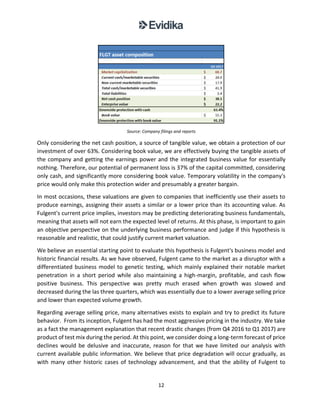
Fulgent Genetics is a genetic testing company with a market capitalization of $60.7 million. It has more than $40 million in cash and insider ownership of approximately 60% by the founder and CEO. The company provides genetic testing and sequencing at low costs using proprietary technology. It focuses on selling to hospitals and medical institutions, with approximately 86% of test billings being paid. The genetic testing market is growing significantly and Fulgent aims to become a leading provider through expanding its test menu, customer base, and global presence while maintaining low costs.
![9
FY 2017
In many instances, unrealistic expectations fail to materialize due to unanticipated events or
biased reasoning for their argumentation. In this case, we believe both occurred.
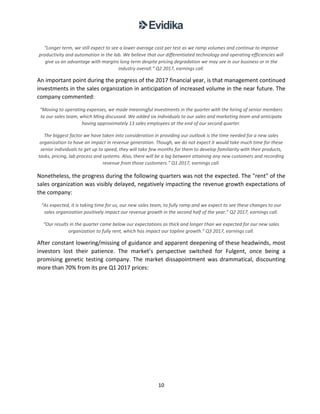
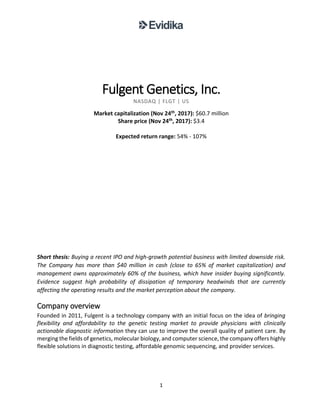
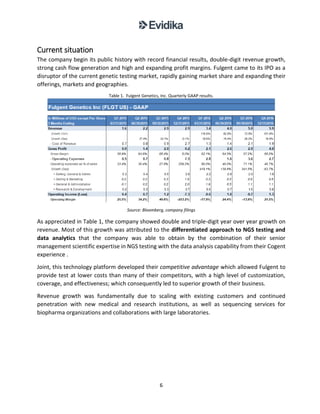
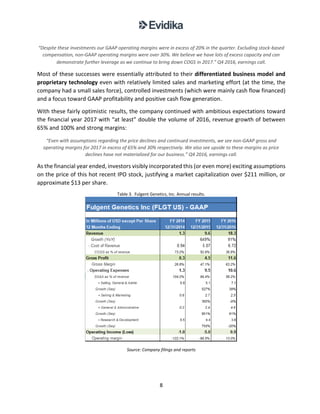
Table 4. Fulgent Genetics, Inc. Analysis of business indicators 2015-Q3 2017
Source: Company filings and reports
Average selling price had a surprising fall from $1,500 to around $1,200 in the first quarter of the
2017 financial year. As stated in the past, revenue mix affects this variable. During the three
quarters of the present financial year, fewer exome-based test (one of the high price and
complex tests) were seen, which decreased the ASP as low as $1,106 during the third quarter.
“Also – although we have been talking about uncertainty regarding product mix and pricing for some time, we did
not anticipate a 20% drop in ASPs in one given quarter. Based on these factors, we anticipate second quarter
revenues will be slightly lower than Q1 revenue. We also anticipate our revenue for the full-year will be lower than
our initial guidance. We now expect our revenue for the full-year 2017 to be in the range of $24 million to $28
million.” Q1 2017, earnings call.
Volume, although increasing, but at a lower than expected pace, combined lower ASP negatively
impacted revenue. Revenue drastically slowed its growth during the first half of the year and
turned negative during the third quarter, fact that visibly dissapointed investors forecasts.
Average cost per test increased, ceasing the record lows achieved before by Fulgent’s
technological advantage. Costs increased primarily due to deleverage of volume and investments
in lab capacity amplification. Margins also gradually decreased to a record low of 53%.
“We expect our gross margin may fluctuate as our test mix varies quarter-to-quarter. However, we expect to focus on
continuing to drive down cost per test via increased volumes and continued automation and productivity in the lab,
which will continue to counter any pricing degradation we may see in our business or in the industry generally.” Q1
2017, earnings call.
“Non-GAAP gross margin in the second quarter was 61%, a modest decline compared to 68% last quarter. […]
However our gross margin remained the highest in the industry as a result of our technology platform and
operational efficiency including lower overall cost to us per test. We expect gross margin will remain strong in the
coming quarters as we increase our volume.” Q2 2017, earnings call.](https://image.slidesharecdn.com/fulgentgenetics-evidika-190916193943/85/Fulgent-Genetics-Biotech-Total-return-200-9-320.jpg)