Download to read offline

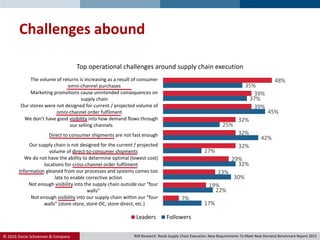
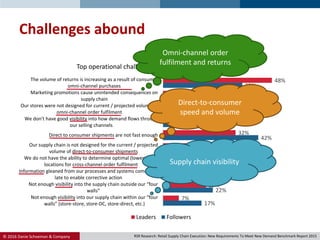
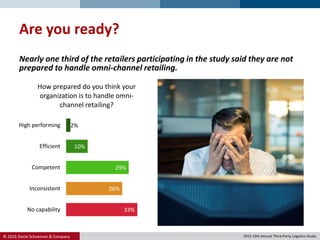
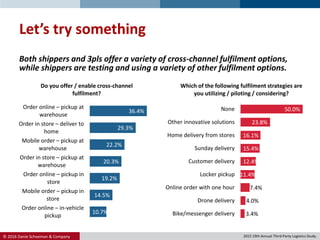
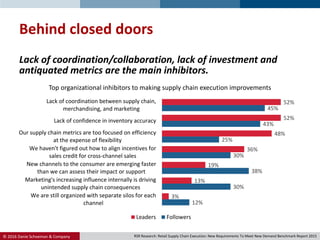
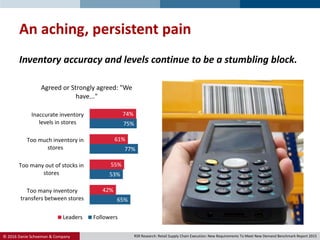
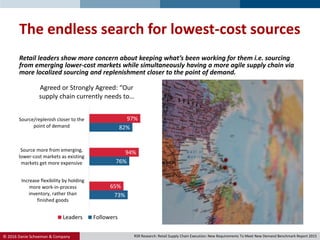


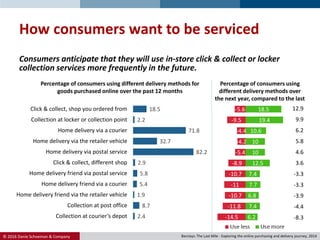
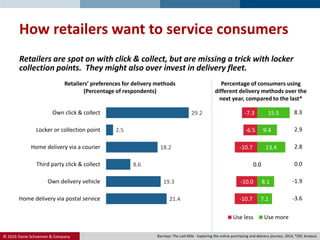


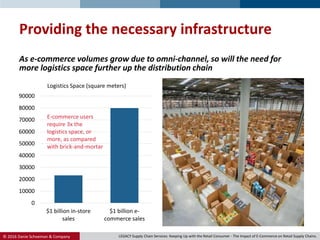
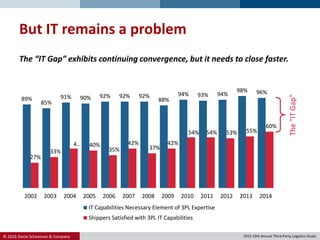


The document discusses the challenges of meeting consumer demands for "anything, anywhere, anytime" in the fresh produce sector. It identifies key issues retailers face like lack of supply chain visibility, inability to optimize order fulfillment locations, and supply chains not being designed for direct-to-consumer shipping volumes. The document also examines consumers' and retailers' preferences around order fulfillment methods and finds that while consumers prefer in-store/locker pick-up, retailers are over-invested in delivery fleets and missing opportunities with locker systems.


