Download as PDF, PPTX
![9
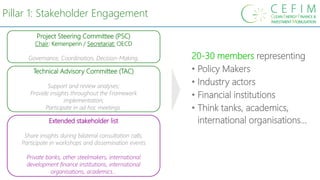
Overview of Pillar 2: Implementation Outcomes
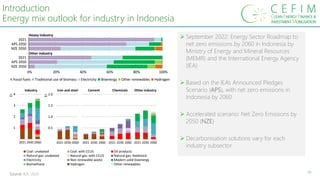
Step 3: Business Cases and Pipeline of Projects
Evaluate business cases and identify
a pipeline of projects and financing needs
Assess investment needs
Choose a net zero pathway for the Focus Area
Choose a Current Policies scenario as a reference
3.1
3.2
3.3 3.4
Technology solutions
to close the transition gap:
• Energy efficiency
• Direct use of renewables
• Switching to low-carbon fuels
and feedstocks
• Circular economy
• CCUS
Investment needs for the technology
solutions
Based on quantification of technology
solutions (how many tons of low-carbon
fuels, % of recycling, ...)
2020 2050
2030 2040
Emissions of
Focus Area
[Mt CO2/yr]
Current policies
scenario
Net-zero
transition pathway
Choice of scenario/pathway
based on existing analyses for the
Focus area
Business Cases and pipeline of
projects
Based on a subset of technology
solutions consistent with the net-
zero transition pathway
Selection of relevant technologies
and projects:
• Technical parameters
• Economic parameters (CAPEX,
market prices, …)
• Selection of indicators and
metrics (Internal Rate of Return,
public money spend…)](https://image.slidesharecdn.com/20231025kick-offmeetingsteelcefimindustryindonesia-231205163559-36fa4fd0/85/Framework-for-Industry-s-net-zero-transition-9-320.jpg)
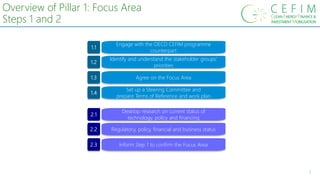
![10
Overview of Pillar 2: Implementation Outcomes
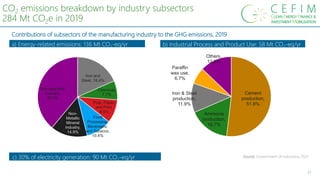
Step 4: Market and financing solutions
4.1
4.3
4.4
4.5
Agree on a monitoring and evaluation
mechanism
Identify financing gaps in the available financing
instruments
Match low-carbon projects and financing
solutions
Establish the financing and market barriers
Develop market enabling solutions
4.2 Develop financing solutions
Analysis of gaps and barriers
Based on extended desktop research and
work with stakeholders, supported by
output of business cases in Step 3
Internal Rate of Return
[ % ]
Low-carbon Conventional
Development of solutions
Based on policy toolboxes and
workshops with stakeholder groups;
covering the capital and the operation
and maintenance costs
Internal Rate of Return
[ % ]
Low-carbon Conventional
Matching of solutions with projects
Based on quantitative KPIs (required
financing, CO2 improvement, ...)
Definition of country-level mechanisms
for monitoring and evaluation
Policy maker Industry
Finance institutions](https://image.slidesharecdn.com/20231025kick-offmeetingsteelcefimindustryindonesia-231205163559-36fa4fd0/85/Framework-for-Industry-s-net-zero-transition-10-320.jpg)
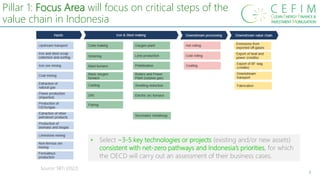
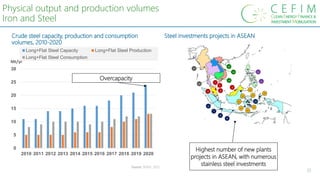
![Breakdown by industry sub-sectors [%] (2016)
20
Contribution to Gross Domestic Product
Manufacturing industry: 20% of Indonesia’s GDP in 2020
Food and beverages,
32.8%
Tobacco products , 5.2%
Textile and apparel,
6.4%
Paper and paper
products, 4.0%
Chemical and pharmacy,
9.9%
Rubber and plastics, 3.5%
Non-metallic
mineral, 3.9%
Basic metal, 4.0%
Fabricated
metal, 10.7%
Transport equipment,
10.5%
Furniture, 1.4%
Wood products, 3.6%
Machinery and
equipment, 1.8%
Source: UNDP, 2018](https://image.slidesharecdn.com/20231025kick-offmeetingsteelcefimindustryindonesia-231205163559-36fa4fd0/85/Framework-for-Industry-s-net-zero-transition-20-320.jpg)

The document outlines the OECD framework for facilitating the net-zero transition of the steel sector in Indonesia, addressing key challenges such as financing, technology transfer, and policymaking. It emphasizes the need for tailored solutions, stakeholder engagement, and the development of bankable projects to support Indonesia's emission reduction targets. The framework aims to align with national development plans and establish market conditions conducive to low-carbon transitions over an implementation period of 12-18 months.


