Download to read offline

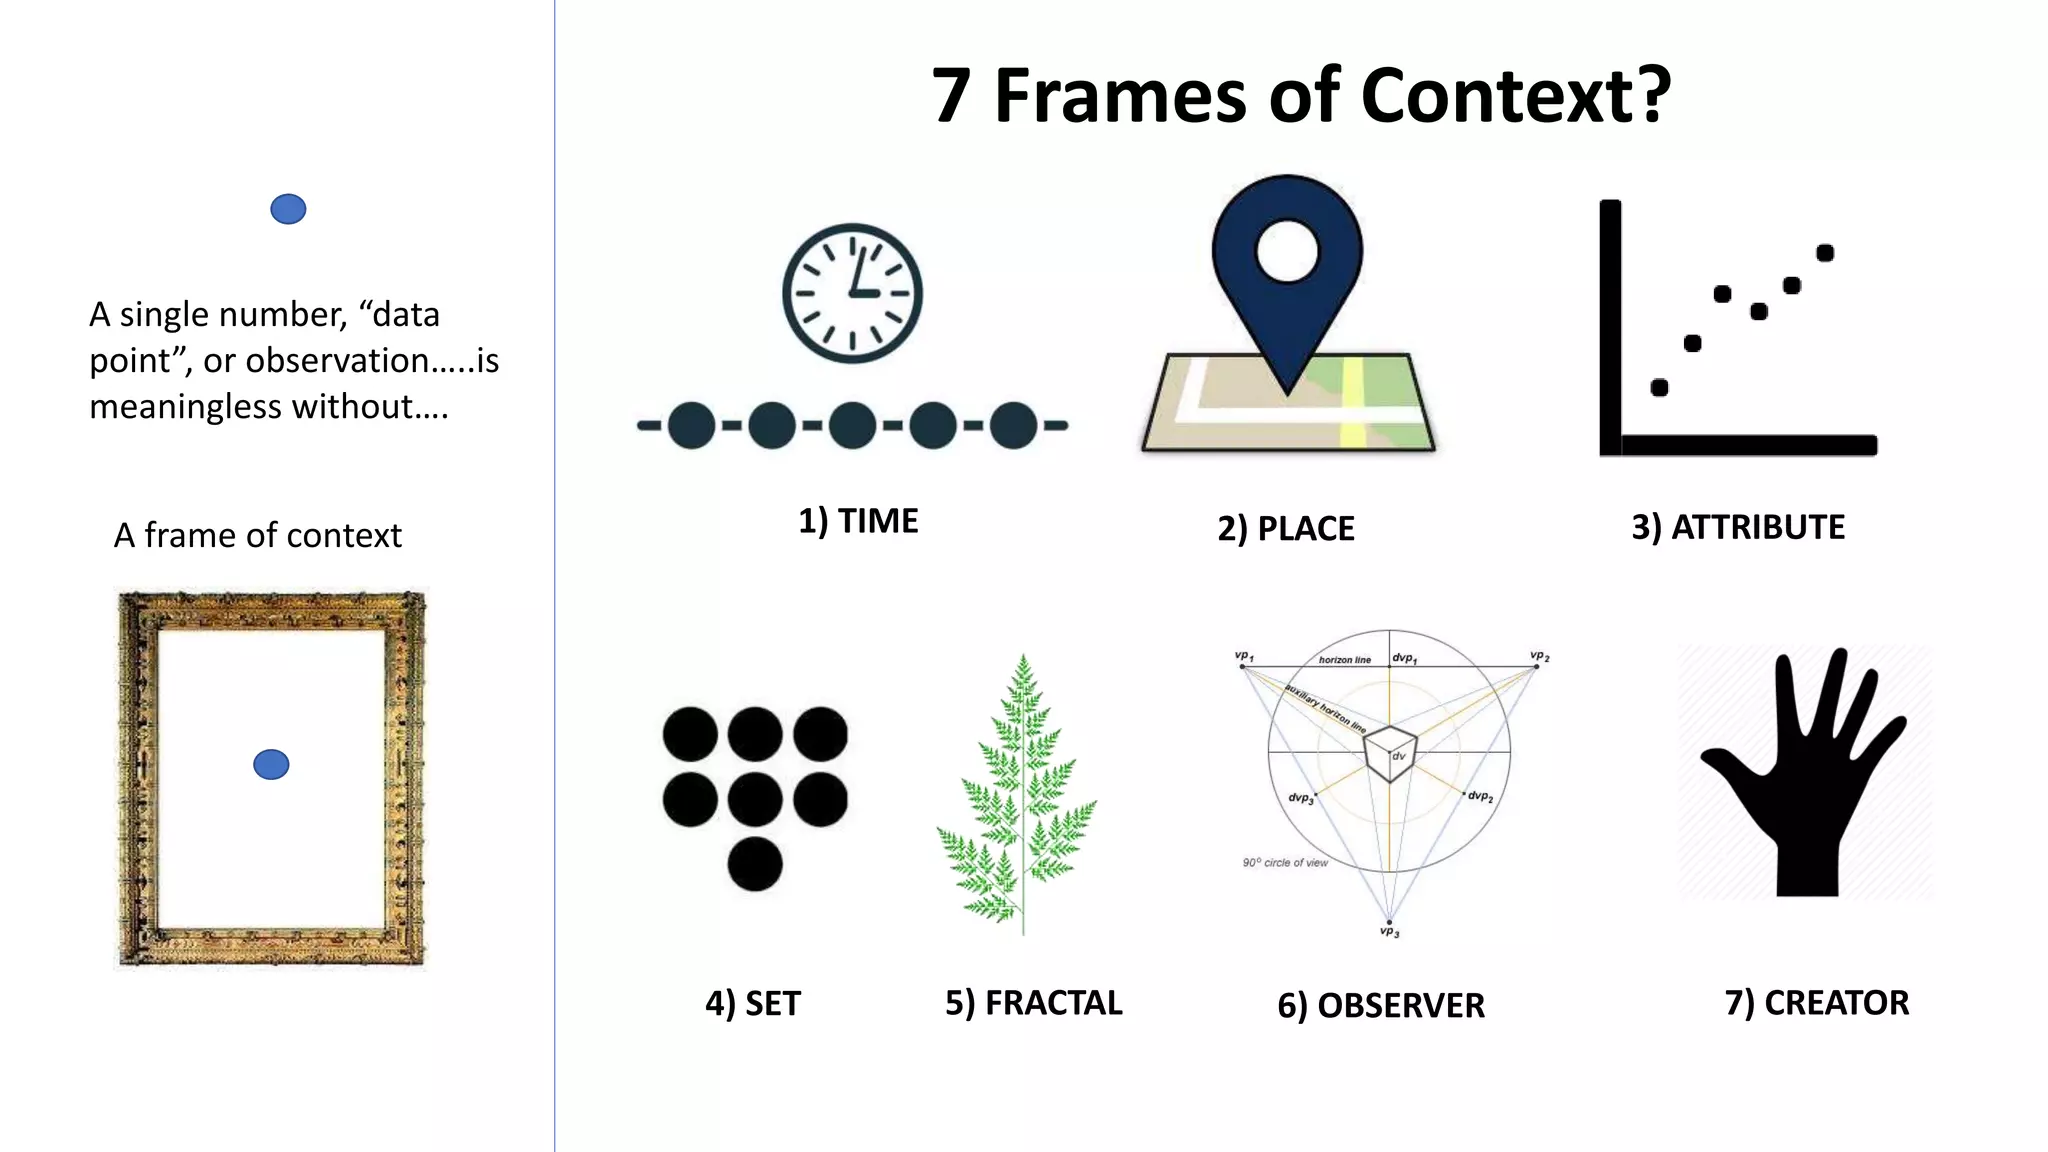
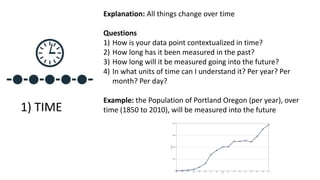
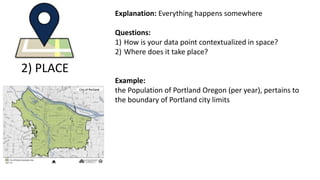

This document discusses 7 frames of context for understanding data points: 1) Time, 2) Place, 3) Attribute, 4) Set, 5) Fractal, 6) Observer, and 7) Creator. It provides examples of how the population of Portland, Oregon can be understood within each frame of context, such as how it has been measured over time, pertains to the city limits, has associated attributes like income levels, is part of a larger set of city populations, and is influenced by factors like the local economy. Understanding these multiple frames of context provides a richer perspective than any single data point alone.


