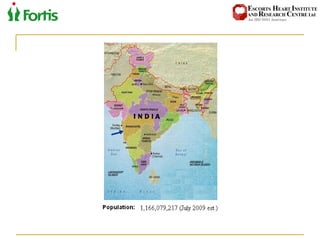
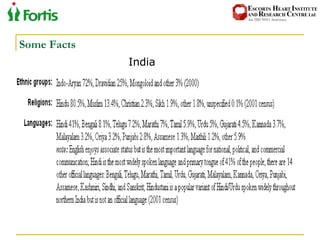
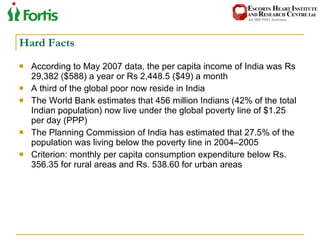
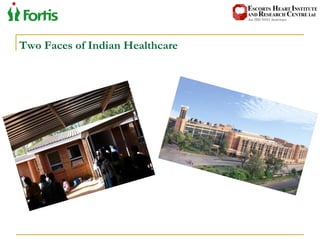
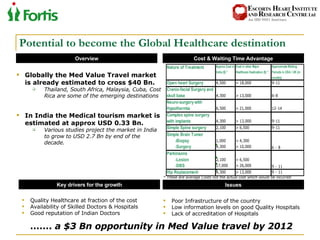
The Indian Healthcare Landscape Jim Dockins, FACHE Regional Director Fortis Healthcare Limited 731-256-0585 (US) [email_address]
 
Some Facts India
Hard Facts According to May 2007 data, the per capita income of India was Rs 29,382 ($588) a year or Rs 2,448.5 ($49) a month A third of the global poor now reside in India The World Bank estimates that 456 million Indians (42% of the total Indian population) now live under the global poverty line of $1.25 per day (PPP) The Planning Commission of India has estimated that 27.5% of the population was living below the poverty line in 2004–2005 Criterion: monthly per capita consumption expenditure below Rs. 356.35 for rural areas and Rs. 538.60 for urban areas
Two Faces of Indian Healthcare
Healthcare Industry in India 3 Types of healthcare providers Private (Out of Pocket) Public Public Industry (BHEL, Railways, ONGC)
Healthcare Industry in India India is host to 17% of world’s population, 20% of all maternal deaths, 23% of child deaths, 26% of childhood vaccine preventable deaths, 30% of TB& 68% of leprosy, 20% of entire disease burden, and 8% of Doctors Average per head spending on healthcare in India = US $94 - $100 United States = $5,711 per citizen Switzerland = $3,445 per citizen Norway = $3,083 South Korea = $931 Netherlands = $2909
Healthcare Industry in India Healthcare is not a part of the concurrent list of constitution of India, every state formulates its own policy (28 states and 7 union territories) Only few national programs are run by the Indian Government – NMEP, NACO etc Healthcare Industry expected to reach from US $ 35 billion to 75 billion by 2012, and 150 billion by 2017, bulk of it will be by Private Sector (KSA Technopak)
Burden of Disease Communicable, Maternal, Perinatal, and Nutritional diseases contribute 46% of disease burden India accounts for 20% of world’s maternal deaths 40 million diabetics – expected to rise to 70 million by 2025 – every fifth diabetic in the world will be an Indian Huge burden of cardiac diseases – 38% Indians have high cholesterol levels, making 2 out of 5 Indians susceptible to heart disease
Other diseases Heart diseases Sense organs MuscoSkeletal Acute Infections Other diseases Acute Infections Heart diseases MuscoSkeletal Sense organs Acute Infections Other Disease Heart Disease Cancer Accidents / Injuries Acute Infections Other Disease Heart Disease Cancer Accidents / Injuries 2001 2012 2012 2001 USD 19 Bn USD 10 Bn Outpatient Market size ( Private spend on Healthcare Delivery) Inpatient Market size ( Private spend on Healthcare Delivery) 46% 54% … ..life style diseases will become dominant USD 6 Bn USD 18 Bn
Progression Graph - India
Government Initiatives Number of subcentres: 137,311 PHC: 22,842 CHC: 3,043 Government (Public) Medical Colleges & Hospitals – 138 Total number of Government Hospitals:  9,976  Total number of Beds: 482,522
IMR of 56/1000 (double of Brazil and China) MMR of 44/10000 (4 and 10 times of Brazil and China) Indicators India Brazil China USA Beds/1000 population .86 2.6 2.2 3.2 Bed occupancy ratio (%) 72% 60-80% 72% 69.3% Average length of stay (number of days) 10 4-8 10.6 6.7
Private sector has 38% beds (FICCI & E&Y, 2008), but  caters to approximately 80% of Indian population  Only 1-2% of Private sector beds are in hospitals of bed  size > 200 beds Additional Requirements 2008 2018 2028 Additional Beds required 1.1 million 3.1 million 2 million Beds/1000 population 0.7 – 1.7 4 5 Additional Floor Space @ 800 sq feet/bed 880 million sq feet 2480 1600 Additional Land Area (FSI 1:1) 20,000 acres 56,400 36,400
7% decline 42% growth 50% growth Number per 1000 population Average rate of population growth in India is 2% annually
Targets (2025)  Hospital Bed density = 2/1000 population Physicians per 1000 population = 1 Nurses per 1000 population = 2.2
Fastest growing Free Market Economy Fourth-Largest economy in the world in terms of Purchasing power parity Higher services mix, Increasing Urbanization, growing working population and a nascent consumer credit cycle are supporting India’s growth story Mar - 95 Mar - 02 Mar – 07 E 0.4% 3.4% 5.0% 5.0% 14.0% Private Health Insurance Social Insurance Employer’s spend Community Insurance Total Favorable shift in Demographics Exciting phase of Economic development Insurance coverage Rapid growth in per capita GDP(PPP) Upper Middle & High(> $ 1500 pa) Upper Middle & Middle($500- $ 1500 pa) Low(<$500 pa) Percent of population, 2001 … reason for optimism
Increasing Private Expenditure Public health expenditure has remained stagnant between 0.9 – 1.2% of GDP (of a total of 5.1%) Public health expenditure in developed countries like USA is in the range of 8-10% of GDP  Private expenditure on HC has increased from 60% in 1990-91 to 80% in 2000-01
Private Sector - Phases Phase 1 1947-83 Phase 2 1983-2000 Phase 3 Post 2000 Public sector focus None to be denied care, regardless of ability to pay State Responsibility to provide healthcare Private sector encouraged to provide healthcare services Access to public funded CHC expanded State’s role redefined to that of a financer of health services from that of a provider Liberalization of Insurance sector for health financing
Out-of-pocket expenditure on HC in India 4 times higher than the world average
Health Insurance Health Insurance industry is worth US $1025 million, and is expected to grow at 30% annually till 2015 to  US $5600 million, by which time insurance coverage would have increased to 10% from the present 2% Insurance coverage in India was 12% in 2007 as compared to the USA where it is more than 85% In 2000 – 20% of all plans sold were retail insurance policies, while the remaining were group insurance policies By 2008, the ratio has changed to 45% group policies and 55% retail insurance policies
Health Insurance Insurance companies need to focus on Below Poverty Level segments Rashtriya Swasthya Bima Yojana – launched by the government in 20008 Covers 300 million people living below the poverty line – each member of such families will get a maximum health insurance coverage of Rs 30,000 ($600) per annum along with additional incidental benefits Insured family pays roughly ½ a Euro annually Rajiv arogya sri health scheme Chiranjivi Project Rogi Kalyan Samitis
Potential to become the Global Healthcare destination  Overview Cost & Waiting Time Advantage Globally the Med Value Travel market is already estimated to cross $40 Bn. Thailand, South Africa, Malaysia, Cuba, Cost Rica are some of the emerging destinations In India the Medical tourism market is estimated at approx USD 0.33 Bn. Various studies project the market in India to grow to USD 2.7 Bn by end of the decade. Key drivers for the growth Quality Healthcare at fraction of the cost Availability of Skilled Doctors & Hospitals Good reputation of Indian Doctors  Issues Poor Infrastructure of the country Low information levels on good Quality Hospitals Lack of accreditation of Hospitals * These are average Costs not the actual cost which would be incurred …… .  a $3 Bn opportunity in Med Value travel by 2012
Need for a Nano model for Healthcare  Price = 1470 Euros
Way Forward Prevention of disease and promotion of healthy lifestyle Increase health insurance coverage PPP Government to become facilitator rather than provider for tertiary care and higher secondary care Infrastructure status to healthcare Unshackle medical education
Prepared by Fortis Healthcare Ltd.
Thanks Credits: FICCI Ernst & Young 2008 WHO Statistics Assocham Study Government Healthcare Statistics

Fortis

  • 1.
    TheIndian Healthcare Landscape Jim Dockins, FACHE Regional Director Fortis Healthcare Limited 731-256-0585 (US) [email_address]
  • 2.
  • 3.
  • 4.
    Hard Facts Accordingto May 2007 data, the per capita income of India was Rs 29,382 ($588) a year or Rs 2,448.5 ($49) a month A third of the global poor now reside in India The World Bank estimates that 456 million Indians (42% of the total Indian population) now live under the global poverty line of $1.25 per day (PPP) The Planning Commission of India has estimated that 27.5% of the population was living below the poverty line in 2004–2005 Criterion: monthly per capita consumption expenditure below Rs. 356.35 for rural areas and Rs. 538.60 for urban areas
  • 5.
    Two Faces ofIndian Healthcare
  • 6.
    Healthcare Industry inIndia 3 Types of healthcare providers Private (Out of Pocket) Public Public Industry (BHEL, Railways, ONGC)
  • 7.
    Healthcare Industry inIndia India is host to 17% of world’s population, 20% of all maternal deaths, 23% of child deaths, 26% of childhood vaccine preventable deaths, 30% of TB& 68% of leprosy, 20% of entire disease burden, and 8% of Doctors Average per head spending on healthcare in India = US $94 - $100 United States = $5,711 per citizen Switzerland = $3,445 per citizen Norway = $3,083 South Korea = $931 Netherlands = $2909
  • 8.
    Healthcare Industry inIndia Healthcare is not a part of the concurrent list of constitution of India, every state formulates its own policy (28 states and 7 union territories) Only few national programs are run by the Indian Government – NMEP, NACO etc Healthcare Industry expected to reach from US $ 35 billion to 75 billion by 2012, and 150 billion by 2017, bulk of it will be by Private Sector (KSA Technopak)
  • 9.
    Burden of DiseaseCommunicable, Maternal, Perinatal, and Nutritional diseases contribute 46% of disease burden India accounts for 20% of world’s maternal deaths 40 million diabetics – expected to rise to 70 million by 2025 – every fifth diabetic in the world will be an Indian Huge burden of cardiac diseases – 38% Indians have high cholesterol levels, making 2 out of 5 Indians susceptible to heart disease
  • 10.
    Other diseases Heartdiseases Sense organs MuscoSkeletal Acute Infections Other diseases Acute Infections Heart diseases MuscoSkeletal Sense organs Acute Infections Other Disease Heart Disease Cancer Accidents / Injuries Acute Infections Other Disease Heart Disease Cancer Accidents / Injuries 2001 2012 2012 2001 USD 19 Bn USD 10 Bn Outpatient Market size ( Private spend on Healthcare Delivery) Inpatient Market size ( Private spend on Healthcare Delivery) 46% 54% … ..life style diseases will become dominant USD 6 Bn USD 18 Bn
  • 11.
  • 12.
    Government Initiatives Numberof subcentres: 137,311 PHC: 22,842 CHC: 3,043 Government (Public) Medical Colleges & Hospitals – 138 Total number of Government Hospitals: 9,976 Total number of Beds: 482,522
  • 13.
    IMR of 56/1000(double of Brazil and China) MMR of 44/10000 (4 and 10 times of Brazil and China) Indicators India Brazil China USA Beds/1000 population .86 2.6 2.2 3.2 Bed occupancy ratio (%) 72% 60-80% 72% 69.3% Average length of stay (number of days) 10 4-8 10.6 6.7
  • 14.
    Private sector has38% beds (FICCI & E&Y, 2008), but caters to approximately 80% of Indian population Only 1-2% of Private sector beds are in hospitals of bed size > 200 beds Additional Requirements 2008 2018 2028 Additional Beds required 1.1 million 3.1 million 2 million Beds/1000 population 0.7 – 1.7 4 5 Additional Floor Space @ 800 sq feet/bed 880 million sq feet 2480 1600 Additional Land Area (FSI 1:1) 20,000 acres 56,400 36,400
  • 15.
    7% decline 42%growth 50% growth Number per 1000 population Average rate of population growth in India is 2% annually
  • 16.
    Targets (2025) Hospital Bed density = 2/1000 population Physicians per 1000 population = 1 Nurses per 1000 population = 2.2
  • 17.
    Fastest growing FreeMarket Economy Fourth-Largest economy in the world in terms of Purchasing power parity Higher services mix, Increasing Urbanization, growing working population and a nascent consumer credit cycle are supporting India’s growth story Mar - 95 Mar - 02 Mar – 07 E 0.4% 3.4% 5.0% 5.0% 14.0% Private Health Insurance Social Insurance Employer’s spend Community Insurance Total Favorable shift in Demographics Exciting phase of Economic development Insurance coverage Rapid growth in per capita GDP(PPP) Upper Middle & High(> $ 1500 pa) Upper Middle & Middle($500- $ 1500 pa) Low(<$500 pa) Percent of population, 2001 … reason for optimism
  • 18.
    Increasing Private ExpenditurePublic health expenditure has remained stagnant between 0.9 – 1.2% of GDP (of a total of 5.1%) Public health expenditure in developed countries like USA is in the range of 8-10% of GDP Private expenditure on HC has increased from 60% in 1990-91 to 80% in 2000-01
  • 19.
    Private Sector -Phases Phase 1 1947-83 Phase 2 1983-2000 Phase 3 Post 2000 Public sector focus None to be denied care, regardless of ability to pay State Responsibility to provide healthcare Private sector encouraged to provide healthcare services Access to public funded CHC expanded State’s role redefined to that of a financer of health services from that of a provider Liberalization of Insurance sector for health financing
  • 20.
    Out-of-pocket expenditure onHC in India 4 times higher than the world average
  • 21.
    Health Insurance HealthInsurance industry is worth US $1025 million, and is expected to grow at 30% annually till 2015 to US $5600 million, by which time insurance coverage would have increased to 10% from the present 2% Insurance coverage in India was 12% in 2007 as compared to the USA where it is more than 85% In 2000 – 20% of all plans sold were retail insurance policies, while the remaining were group insurance policies By 2008, the ratio has changed to 45% group policies and 55% retail insurance policies
  • 22.
    Health Insurance Insurancecompanies need to focus on Below Poverty Level segments Rashtriya Swasthya Bima Yojana – launched by the government in 20008 Covers 300 million people living below the poverty line – each member of such families will get a maximum health insurance coverage of Rs 30,000 ($600) per annum along with additional incidental benefits Insured family pays roughly ½ a Euro annually Rajiv arogya sri health scheme Chiranjivi Project Rogi Kalyan Samitis
  • 23.
    Potential to becomethe Global Healthcare destination Overview Cost & Waiting Time Advantage Globally the Med Value Travel market is already estimated to cross $40 Bn. Thailand, South Africa, Malaysia, Cuba, Cost Rica are some of the emerging destinations In India the Medical tourism market is estimated at approx USD 0.33 Bn. Various studies project the market in India to grow to USD 2.7 Bn by end of the decade. Key drivers for the growth Quality Healthcare at fraction of the cost Availability of Skilled Doctors & Hospitals Good reputation of Indian Doctors Issues Poor Infrastructure of the country Low information levels on good Quality Hospitals Lack of accreditation of Hospitals * These are average Costs not the actual cost which would be incurred …… . a $3 Bn opportunity in Med Value travel by 2012
  • 24.
    Need for aNano model for Healthcare Price = 1470 Euros
  • 25.
    Way Forward Preventionof disease and promotion of healthy lifestyle Increase health insurance coverage PPP Government to become facilitator rather than provider for tertiary care and higher secondary care Infrastructure status to healthcare Unshackle medical education
  • 26.
    Prepared by FortisHealthcare Ltd.
  • 27.
    Thanks Credits: FICCIErnst & Young 2008 WHO Statistics Assocham Study Government Healthcare Statistics