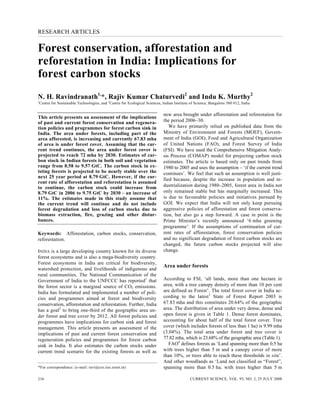
This article assesses the implications of India's past and current forest conservation, afforestation, and reforestation policies and programs on forest carbon stocks. It finds that:
1) India's forest cover has increased from 64.08 mha in 1987 to an estimated 67.83 mha in 2003 and is projected to reach 72 mha by 2030 if current trends continue.
2) India has afforested around 34 mha between 1980-2005 through programs like social forestry, and is projected to afforest another 33 mha between 2006-2030, reaching a cumulative total of 70.5 mha afforested by 2030.
3) Carbon stocks in India's forests
Mapping of Wood Carbon Stocks in the Classified Forest of Wari-Maro in Benin ...AI Publications
The Emissions Reducing program related to Deforestation and Forest Degradation (Redd +) calls for the development of approaches to quantify and spatialize forest carbon in order to design more appropriate forest management policies. The mapping of carbon stocks was done in the Wari-Maro Forest Reserve. To achieve this, forest inventory data (in situ) and remotely sensed data (Landsat 8 image) were used to construct a wood carbon stock forecasting model. Simple linear regression was used to test the correlation between these two variables. In situ surveys indicate that 64% of carbon stocks are contributed by forest formations, 32.72% are provided by savannah formations and 3.27% are from anthropogenic formations. The quantitative relationship between NDVI and carbon in situ shows a very good correlation with a high coefficient of determination R² = 91%. The carbon map generated from the model identified fronts of deforestation through their low carbon content. This remote sensing approach indicates that forest formations sequester 60% of forest carbon. The savannah formations reserve 33%, the anthropic formations bring only 6% of the stocks. Mapping has further captured the spatial variability among land use types, thus providing arguments to fully meet the objectives of Redd +.
Carbon stock of woody species along Altitude gradient in Alemsaga Forest, Sou...Agriculture Journal IJOEAR
Purpose: Forest ecosystems play a significant role in the climate change mitigation and biodiversity conservation. Therefore carbon determination provide clear indications of the possibilities of promoting forest development and management for mitigating of climate change through soil and vegetation carbon sequestration. The study was carried out to quantify carbon stock potential in Alemsaga Forest, South Gondar zone. Research method: Vegetation data Collection was made using a systematic sampling method; laying six transect lines with 500 m apart and 54 quadrants of 20 m X 20 m established 200 m distant to each other along the transect lines. In these plots, abundance, DBH and heights of all woody species were recorded, and soil sample was collected 1m X1m from the four corners and center of each quadrant. General allometric model was used for estimating above and belowground biomass. The organic carbon content of the soil samples was determined in the laboratory. Finding: A total of 66 woody plant species belong to 42 families were identified, Fabaceae was the most dominant families. The total mean above and belowground carbon stock was 216.86 ton/ha and 114.71 ton/ha respectively and soil organic carbon (SOC) 103.15 ton/ha. Above and belowground carbon increased as altitude decreased, but SOC increases with increase of altitude. Originality/value: Carbon stock estimation in the forest helps to manage the forests sustainably from the ecological, economic and environmental points of view and opportunities for economic benefit through carbon trading to farmers.
Analysis of elements of forest governance in joint forest management system: ...Innspub Net
In Pakistan, the traditional hierarchal governance of forest resources performed well as long as the large forest resources were available, however, after independence the population increased rapidly and consequently their demands of timber, fuelwood, grazing and other products and services increased too. It was felt that the any conservation measure without the people’s involvement will be in vain. Looking at the experiences and lessons learnt from the neighbouring countries like Nepal and India, the concept of Joint Forest Management was introduced in the province of KP. However, JFM-a type of co-governance-also did not perform upto the expectations despite of the fact that the main objective of JFM was to conserve the forest resource. Forest depletion is at constant rise even after the implementation of JFM model. One of the major underlying causes is the poor forest governance. This necessitates the fact to analyze the existing governance mechanism; compare it with the ideal forest governance; find out the governance issues and its underlying causes; and recommend a framework for governance reforms in JFM. With these stated objectives, the current study was designed to cover the Allai valley Guzara Forest where JFM is in place since 2004. The study resulted in key findings in relation to forest governance which will be helpful not only to the concerned authorities but also to academia, NGOs and general public. Get the full articles at: http://www.innspub.net/volume-3-number-9-september-2013-2/
The participatory management plan is a technical, legal and social device that joins the objectives of biodiversity conservation and the socio-economic needs of local populations. This research work aims to evaluate the impact of Wari-Maro classified forest management plan implementation on the structure and specific diversity of vegetation types. The methodological approach followed is based on the comparison of the dendrometric parameters and plant diversity parameters before and after the management plan implementation. The phytosociological and dendrometric database before the management plan was compiled with data from the forest inventory conducted by PAMF project in 2004 and others work. The forest and phytosociological inventories were carried out on the plots (70) from the forest inventory of PAMF project (2004) following the same methodological principles. The Shannon diversity index decreased from 3.35 ± 0.57 bits in 2004 to 1.98 ± 0.73 bits in 2014. The average density of dbh trees ≥ 10 cm decreased from 740.37 ± 269 , 86 stems / ha in 2004 to 184 ± 100 stems / ha in 2014. The results of the 5% sample matched t-test reveal a non-significant difference between the Shannon Diversity Index of 2004 and of 2014. On the other hand, the results of the sample t-test matched at the 5% threshold, reveal a significant difference between the average density value of 2004 and 2014 for all vegetation types except shrub savannas, fields and fallows. Most of the plant species found before the management plan are still present despite the decreased in individuals’ density.
IJRET : International Journal of Research in Engineering and Technology is an international peer reviewed, online journal published by eSAT Publishing House for the enhancement of research in various disciplines of Engineering and Technology. The aim and scope of the journal is to provide an academic medium and an important reference for the advancement and dissemination of research results that support high-level learning, teaching and research in the fields of Engineering and Technology. We bring together Scientists, Academician, Field Engineers, Scholars and Students of related fields of Engineering and Technology
Recent Study on National Deforestation Estimate CIFOR-ICRAF
This roundtable discussion, first delivered in Jakarta, shares research into Indonesia's national deforestation estimate, with the objective of sharing approaches and ultimately improve the reliability of the estimate.
Myanmar is one of the most forested countries in mainland South-east Asia. These forests support a large number of important species and endemics and have great value for global efforts in biodiversity conservation.
Carbon Stock Estimation in Standing Tree of Chir Pine and Banj Oak Pure Fores...science journals
A study was conducted to measure carbon stock in two Van Panchayat forest of Garhwal Himalaya. For comparative study, we selected the degraded and non-degraded site in Pine and Oak Forest and estimated total carbon stock (above and below ground).
Estimating stored carbon stock in oil palm (Elaeis guineensis Jacq.) plantati...Innspub Net
The increasing concentration of carbon in the atmosphere is a serious environmental problem that can affect living system on earth. The increase in greenhouse gas emissions caused global warming that will affect the world climate change and rising sea levels. Climate change will disrupt farming system in both the micro and macro scale. Estimation of forest carbon emissions is one of the important efforts to reduce climate change. Land clearing for palm oil plantations will affect the stored carbon in the forest reserves. The aim of this study is to determine the biomass stored carbon stocks in oil palm plantations by age group in oil palm plantations in PT Daria Dharma Pratama (PT DDP), Bengkulu Province, Indonesia. Methods of measuring the stored carbon stock of palm oil biomass using allometric equations, is non-destructive method. Methods of measuring the stored carbon stock of undergrowth biomass and piled of oil palm fronds up was conducted by destructive methods. The largest biomass stored carbon stock was in the age group of 11-15 years crop of 69.32 tonnes ha-1. Then, in the age group of 16-20 years were 54.13 tonnes ha-1, age group of >20 years were 34.91 tonnes ha-1, the age group of 6-10 years were 34.16 tonnes ha-1, and the age group 0 – 5 year were 6.98 tonnes ha-1, respectively. Stored carbon stock in oil palm was influenced by the age of the plant, soil fertility, as well as plant growth and development. Get the full articles at: http://www.innspub.net/ijaar/estimating-stored-carbon-stock-in-oil-palm-elaeis-guineensis-jacq-plantation-by-age-group-in-pt-daria-dharma-pratama-plantation-bengkulu-indonesia/
Biomass and Carbon Stock Assessment in Moist Deciduous Forests of Doon Valley...Dr. Mohommad Shahid
The study was conducted in the three forest ranges of Dehra Dun Forest Division of Doon Valley, Western Himalaya,
India. Biomass and carbon status in the moist deciduous forest were estimated using volumetric equations. A total of 150 quadrats
were laid in the study sites. The biomass ranged from 338.40 Mg ha-1 to 438.17 Mg ha-1 and carbon stocks from 169.20 Mg ha-1 to
219.08 Mg ha-1 in different study sites. The study concludes that moist deciduous forests of Doon Valley have the potential for
carbon sequestration. The study sites are also experiencing lot of anthropogenic pressures from the villages at the forest fringes.
Assessment of biomass and carbon sequestration potentials of standing Pongami...Surendra Bam
The need of identifying the plant species having multitude value in present world are essential. Even in the Climate Change mitigation measures, the utilization of those plant species having economical value like bio-disel as well as can play their role of carbon sequestration.
International Journal of Engineering and Science Invention (IJESI) is an international journal intended for professionals and researchers in all fields of computer science and electronics. IJESI publishes research articles and reviews within the whole field Engineering Science and Technology, new teaching methods, assessment, validation and the impact of new technologies and it will continue to provide information on the latest trends and developments in this ever-expanding subject. The publications of papers are selected through double peer reviewed to ensure originality, relevance, and readability. The articles published in our journal can be accessed online.
18.wild life and forest department A series of Presentation ByMr Allah Dad K...Mr.Allah Dad Khan
A series of Presentation ByMr Allah Dad Khan Special Consultant NRM , Former DG Agriculture Extension KPK Province , Visiting Professor the University of Agriculture Peshawar Pakistan allahdad52@gmail.com
Lessons for REDD+ implementation: Insights from assessment of forest governan...Innspub Net
To draw lessons for informing strategies for reducing emissions from deforestation and forest degradation and fostering conservation, sustainable management of forests and enhancement of forest carbon stocks (REDD+), this study assessed community members’ perceptions of the quality of forest governance in the joint forest management program relative to the ideal forest governance quality using the Katanino Joint Forest Management study area in Zambia. The study focused on six elements of good governance, namely participation, transparency, accountability, equity, efficiency and effectiveness. Using a two stage sampling procedure, data for this study was collected using questionnaires administered to 120 randomly selected community members who participated in the Joint Forest Management program in Serenje, Biwa and Bwengo villages of Katanino Joint Forest Management pilot area. Results showed considerable gaps between ideal quality of forest governance and the perceived quality of forest governance. One sample t-test results showed that the perceived quality of all the six governance elements were statistically different from the ideal quality of forest governance at the 95 % confidence interval, participation (t (119) = -76, ρ < 0.05), transparency (t (119) = -130, ρ < 0.05), accountability (t (119) = -82, ρ < 0.05), equity (t (119) = -53.47, ρ < 0.05), effectiveness (t (119) = -60, ρ < 0.05), efficiency (t (119) = -87, ρ < 0.05). Implications of these findings are highlighted through a governance lens to inform strategies for REDD+ implementation.
Since the existence of humans, precious trees have been destroyed to provide shelter, food, heat and supplies for economic growth and development. Consistent and an increasing demand for products for human comfort, endangers large forests and the environment. Continuous deforestation is disrupting the natural balance of ecosystems. Populations fail to realize that their daily habits and patterns of energy and paper consumption is damaging in the long-run. As deforestation becomes more and more widespread, little is being done to preserve nature
Understanding of the area under forest is necessary while studying the geography of India. Hence, in this module, the following aspects are highlighted:
1. forest area in India
2. forest areas classified
3. distribution of forest areas
4. state-wise forest areas
5. mangrove and tree cover.
This report shows the status of Forests in India from 2020 onwards. It explains the trends and pattern of forest cover gain and loss geographically and the implications on carbon sequestration.
S6c2 chapter 2 facts and figures on forestry.Shivu P
In this chapter some of the facts and figures related to forestry are mentioned like how the area under the cover of forest is decreasing, its impact on the environment, how desertification is increasing, the various causes for deforestation, urbanization and its impact on the forest and so on are mentioned in this chapter.
Climate Change and Forest Management: Adaptation of Geospatial Technologiesrsmahabir
eraction with the environment, has led to increased concerns about the impact of such disruption on major areas of sustainable development. This has resulted in various innovations in technology, policy and forged alliances at regional and international scales in an effort to reduce humans’ impact on climate. Forests provide a suitable option for reducing the net amount of carbon dioxide in the atmosphere by acting as carbon sinks, thereby forming one part of a more complete solution for combating climate change. At the same time, forests are also sensitive to changes in climate, making sustainable forest management a critical component of present and future climate change strategies. This paper examines the contribution of geospatial technologies in supporting sustainable forest management, emphasizing its use in the classification of forests, estimation of their structure, detecting change and modeling of carbon stocks.
The present forest and tree cover of the country is 78.37 million ha in 2007 which is 23.84% of the geographical areas and it includes 2.82% tree cover. This becomes 25.25%, if the areas above tree line i.e., 4000m are excluded from the total geographical area. The forest cover is classified into 3 canopy density classes.
1. Very Dense Forest (VDF) with canopy density more than 70%
2. Moderately Dense Forest (MDF) with Canopy density between 40-70% and
3. Open Forest (OF) with Canopy density between 10-40%
The Roman Empire A Historical Colossus.pdfkaushalkr1407
The Roman Empire, a vast and enduring power, stands as one of history's most remarkable civilizations, leaving an indelible imprint on the world. It emerged from the Roman Republic, transitioning into an imperial powerhouse under the leadership of Augustus Caesar in 27 BCE. This transformation marked the beginning of an era defined by unprecedented territorial expansion, architectural marvels, and profound cultural influence.
The empire's roots lie in the city of Rome, founded, according to legend, by Romulus in 753 BCE. Over centuries, Rome evolved from a small settlement to a formidable republic, characterized by a complex political system with elected officials and checks on power. However, internal strife, class conflicts, and military ambitions paved the way for the end of the Republic. Julius Caesar’s dictatorship and subsequent assassination in 44 BCE created a power vacuum, leading to a civil war. Octavian, later Augustus, emerged victorious, heralding the Roman Empire’s birth.
Under Augustus, the empire experienced the Pax Romana, a 200-year period of relative peace and stability. Augustus reformed the military, established efficient administrative systems, and initiated grand construction projects. The empire's borders expanded, encompassing territories from Britain to Egypt and from Spain to the Euphrates. Roman legions, renowned for their discipline and engineering prowess, secured and maintained these vast territories, building roads, fortifications, and cities that facilitated control and integration.
The Roman Empire’s society was hierarchical, with a rigid class system. At the top were the patricians, wealthy elites who held significant political power. Below them were the plebeians, free citizens with limited political influence, and the vast numbers of slaves who formed the backbone of the economy. The family unit was central, governed by the paterfamilias, the male head who held absolute authority.
Culturally, the Romans were eclectic, absorbing and adapting elements from the civilizations they encountered, particularly the Greeks. Roman art, literature, and philosophy reflected this synthesis, creating a rich cultural tapestry. Latin, the Roman language, became the lingua franca of the Western world, influencing numerous modern languages.
Roman architecture and engineering achievements were monumental. They perfected the arch, vault, and dome, constructing enduring structures like the Colosseum, Pantheon, and aqueducts. These engineering marvels not only showcased Roman ingenuity but also served practical purposes, from public entertainment to water supply.
Francesca Gottschalk - How can education support child empowerment.pptxEduSkills OECD
Francesca Gottschalk from the OECD’s Centre for Educational Research and Innovation presents at the Ask an Expert Webinar: How can education support child empowerment?
A Strategic Approach: GenAI in EducationPeter Windle
Artificial Intelligence (AI) technologies such as Generative AI, Image Generators and Large Language Models have had a dramatic impact on teaching, learning and assessment over the past 18 months. The most immediate threat AI posed was to Academic Integrity with Higher Education Institutes (HEIs) focusing their efforts on combating the use of GenAI in assessment. Guidelines were developed for staff and students, policies put in place too. Innovative educators have forged paths in the use of Generative AI for teaching, learning and assessments leading to pockets of transformation springing up across HEIs, often with little or no top-down guidance, support or direction.
This Gasta posits a strategic approach to integrating AI into HEIs to prepare staff, students and the curriculum for an evolving world and workplace. We will highlight the advantages of working with these technologies beyond the realm of teaching, learning and assessment by considering prompt engineering skills, industry impact, curriculum changes, and the need for staff upskilling. In contrast, not engaging strategically with Generative AI poses risks, including falling behind peers, missed opportunities and failing to ensure our graduates remain employable. The rapid evolution of AI technologies necessitates a proactive and strategic approach if we are to remain relevant.
Palestine last event orientationfvgnh .pptxRaedMohamed3
An EFL lesson about the current events in Palestine. It is intended to be for intermediate students who wish to increase their listening skills through a short lesson in power point.
The French Revolution, which began in 1789, was a period of radical social and political upheaval in France. It marked the decline of absolute monarchies, the rise of secular and democratic republics, and the eventual rise of Napoleon Bonaparte. This revolutionary period is crucial in understanding the transition from feudalism to modernity in Europe.
For more information, visit-www.vavaclasses.com
Welcome to TechSoup New Member Orientation and Q&A (May 2024).pdfTechSoup
In this webinar you will learn how your organization can access TechSoup's wide variety of product discount and donation programs. From hardware to software, we'll give you a tour of the tools available to help your nonprofit with productivity, collaboration, financial management, donor tracking, security, and more.
Synthetic Fiber Construction in lab .pptxPavel ( NSTU)
Synthetic fiber production is a fascinating and complex field that blends chemistry, engineering, and environmental science. By understanding these aspects, students can gain a comprehensive view of synthetic fiber production, its impact on society and the environment, and the potential for future innovations. Synthetic fibers play a crucial role in modern society, impacting various aspects of daily life, industry, and the environment. ynthetic fibers are integral to modern life, offering a range of benefits from cost-effectiveness and versatility to innovative applications and performance characteristics. While they pose environmental challenges, ongoing research and development aim to create more sustainable and eco-friendly alternatives. Understanding the importance of synthetic fibers helps in appreciating their role in the economy, industry, and daily life, while also emphasizing the need for sustainable practices and innovation.
1. RESEARCH ARTICLES
CURRENT SCIENCE, VOL. 95, NO. 2, 25 JULY 2008216
*For correspondence. (e-mail: ravi@ces.iisc.ernet.in)
Forest conservation, afforestation and
reforestation in India: Implications for
forest carbon stocks
N. H. Ravindranath1,
*, Rajiv Kumar Chaturvedi2
and Indu K. Murthy2
1
Centre for Sustainable Technologies, and 2
Centre for Ecological Sciences, Indian Institute of Science, Bangalore 560 012, India
This article presents an assessment of the implications
of past and current forest conservation and regenera-
tion policies and programmes for forest carbon sink in
India. The area under forests, including part of the
area afforested, is increasing and currently 67.83 mha
of area is under forest cover. Assuming that the cur-
rent trend continues, the area under forest cover is
projected to reach 72 mha by 2030. Estimates of car-
bon stock in Indian forests in both soil and vegetation
range from 8.58 to 9.57 GtC. The carbon stock in ex-
isting forests is projected to be nearly stable over the
next 25 year period at 8.79 GtC. However, if the cur-
rent rate of afforestation and reforestation is assumed
to continue, the carbon stock could increase from
8.79 GtC in 2006 to 9.75 GtC by 2030 – an increase of
11%. The estimates made in this study assume that
the current trend will continue and do not include
forest degradation and loss of carbon stocks due to
biomass extraction, fire, grazing and other distur-
bances.
Keywords: Afforestation, carbon stocks, conservation,
reforestation.
INDIA is a large developing country known for its diverse
forest ecosystems and is also a mega-biodiversity country.
Forest ecosystems in India are critical for biodiversity,
watershed protection, and livelihoods of indigenous and
rural communities. The National Communication of the
Government of India to the UNFCCC has reported1
that
the forest sector is a marginal source of CO2 emissions.
India has formulated and implemented a number of poli-
cies and programmes aimed at forest and biodiversity
conservation, afforestation and reforestation. Further, India
has a goal2
to bring one-third of the geographic area un-
der forest and tree cover by 2012. All forest policies and
programmes have implications for carbon sink and forest
management. This article presents an assessment of the
implications of past and current forest conservation and
regeneration policies and programmes for forest carbon
sink in India. It also estimates the carbon stocks under
current trend scenario for the existing forests as well as
new area brought under afforestation and reforestation for
the period 2006–30.
We have primarily relied on published data from the
Ministry of Environment and Forests (MOEF), Govern-
ment of India (GOI); Food and Agricultural Organization
of United Nations (FAO), and Forest Survey of India
(FSI). We have used the Comprehensive Mitigation Analy-
sis Process (COMAP) model for projecting carbon stock
estimates. The article is based only on past trends from
1980 to 2005 and uses the assumption – ‘if the current trend
continues’. We feel that such an assumption is well justi-
fied because, despite the increase in population and in-
dustrialization during 1980–2005, forest area in India not
only remained stable but has marginally increased. This
is due to favourable policies and initiatives pursued by
GOI. We expect that India will not only keep pursuing
aggressive policies of afforestation and forest conserva-
tion, but also go a step forward. A case in point is the
Prime Minister’s recently announced ‘6 mha greening
programme’. If the assumptions of continuation of cur-
rent rates of afforestation, forest conservation policies
and no significant degradation of forest carbon stocks are
changed, the future carbon stocks projected will also
change.
Area under forests
According to FSI, ‘all lands, more than one hectare in
area, with a tree canopy density of more than 10 per cent
are defined as Forest’. The total forest cover in India ac-
cording to the latest3
State of Forest Report 2003 is
67.83 mha and this constitutes 20.64% of the geographic
area. The distribution of area under very dense, dense and
open forest is given in Table 1. Dense forest dominates,
accounting for about half of the total forest cover. Tree
cover (which includes forests of less than 1 ha) is 9.99 mha
(3.04%). The total area under forest and tree cover is
77.82 mha, which is 23.68% of the geographic area (Table 1).
FAO4
defines forests as ‘Land spanning more than 0.5 ha
with trees higher than 5 m and a canopy cover of more
than 10%, or trees able to reach these thresholds in situ’.
And other woodlands as ‘Land not classified as “Forest”,
spanning more than 0.5 ha; with trees higher than 5 m
2. RESEARCH ARTICLES
CURRENT SCIENCE, VOL. 95, NO. 2, 25 JULY 2008 217
and a canopy cover of 5–10 per cent, or trees able to
reach these thresholds in situ; or with a combined cover
of shrubs, bushes and trees above 10 per cent. Both of
these categories do not include the land that is predomi-
nantly under agricultural or urban land use’. According to
FAO, the area under forests and other wooded land in
India has increased from 63.93 mha in 1990 to 67.70 mha
in 2005. Thus FAO estimates do not significantly differ
from FSI estimates.
Trends in area under forest and tree cover
The FSI has been periodically estimating the forest cover
in India since 1987, using remote sensing techniques. The
forest cover reported5
for 1987 was 64.08 mha and ac-
cording to the latest assessment3
for 2003, the forest
cover is 67.83 mha. This indicates an increase in forest
cover of 3.75 mha over a period of 15 years (Figure 1). It
can be observed from Figure 1 that the forest cover in In-
dia has nearly stabilized and has been increasing margin-
ally over the years3,5–12
. FSI has included the tree cover in
the 2001 and 2003 assessments3,6
, in addition to forest
cover. The area under tree cover reported is also found to
be marginally increasing (Figure 1).
Afforestation and reforestation programmes
India has been implementing an aggressive afforestation
programme. The country initiated large-scale afforesta-
tion under the social forestry programme starting in the
Table 1. Status of forest cover in India3,4
Per cent
Tree crown class Area (mha) geographic area
Very dense forest (>70%) 5.13 1.56
Dense forest (40–70%) 33.93 10.32
Open forest (10–40%) 28.78 8.76
Mangroves 0.45 0.14
Total forest cover 67.83 20.64
Tree cover 9.99 3.04
Total 77.82 23.68
Forest cover according to FAO 67.7 –
0
10
20
30
40
50
60
70
80
90
1987 1989 1991 1993 1995 1997 1999 2001 2003
Forestandtreecover(Mha)
Forest cover Tree cover
Figure 1. Trends in area under forest and tree cover3,5–12
.
early 1980s. Figure 2 shows the progress of afforestation
in India for the period 1951–2005. It can be seen from
Figure 2 that the cumulative area afforested in India dur-
ing the period 1980–2005 is about 34 mha, at an average
annual rate2
of 1.32 mha2
. This includes community wood-
lots, farm forestry, avenue plantations and agro-forestry.
Afforestation and reforestation in India are being carried
out under various programmes, namely social forestry
initiated in the early 1980s, Joint Forest Management
Programme initiated in 1990, afforestation under National
Afforestation and Eco-development Board (NAEB) pro-
grammes since 1992, and private farmer and industry-
initiated plantation forestry.
Future trends in area under forests and
afforestation
The projections for area under forest as well as area affor-
ested are based on current trends or what is generally
termed the ‘current trend scenario’. The current trend sce-
nario is based on the past, current and short-term affore-
station plans. The projections exclude the tree cover
component as reported in 2001 and 2003 by the FSI.
Projections for area under forest cover based on
current trend scenario
The forest cover is projected up to 2030, based on the
past and current trends, as reported by the periodic re-
Figure 2. Cumulative area afforested2
during 1951–2005.
0
10
20
30
40
50
60
70
80
1987
1989
1991
1993
1995
1997
1999
2001
2003
2005
2007
2009
2011
2013
2015
2017
2019
2021
2023
2025
2027
2029
2031
Forestcover(Mha)
Figure 3. Projected trend in forest cover under the current trend sce-
nario3,5–12
.
3. RESEARCH ARTICLES
CURRENT SCIENCE, VOL. 95, NO. 2, 25 JULY 2008218
ports of the FSI. It can be observed from Figure 3 that the
forest cover will continue to increase all the way up to
2030. The forest cover is projected to reach 72.19 mha by
2030, assuming that the current trend scenario will con-
tinue.
Projected afforestation rates based on current
trends
The long-term average annual rate of afforestation over
the period 1980–2005 is 1.32 mha. Assuming the average
rate2
of 1.32 mha for the period 2006–30, the total area
that would be afforested is 33 mha. The cumulative area
afforested would be 70.5 mha by 2030 (Figure 4). This
includes short- and long-rotation plantation forestry as
well as natural regeneration. It is important to note that
some of the afforested area, particularly short-rotation
plantations, is likely to be periodically harvested and re-
planted or left for coppice regrowth.
Carbon stocks in forests
The forest sector could be a source or a sink of carbon.
Forest carbon stock includes biomass and soil carbon
pools. Biomass carbon can be further disaggregated into
aboveground and belowground biomass and dead organic
matter. Change in forest carbon stock between two time
periods is an indicator of the net emissions of CO2 from
the sector. Carbon stocks are estimated and projected for
the period 2005–30.
Methodology
The COMAP model13
is a set of versatile models with the
ability to analyse the mitigation potential as well as cost-
effectiveness of diverse activities such as forest conserva-
tion (e.g. Protected Areas and halting forest conversion),
Figure 4. Projected afforestation under the current trend scenario.
natural regeneration (with no logging) and afforesta-
tion/reforestation through plantation forestry, including
short- as well as long-rotation forestry (with logging or har-
vesting).
Assessment of mitigation activities using the COMAP
model would involve consideration of the following:
• Land availability for different mitigation activities
during different years.
• Wood product demand and supply to ensure that socio-
economic demands are met with and real additional
mitigation is feasible.
• Developing a baseline or current trend scenario to enable
estimation of incremental carbon mitigation.
• Developing a mitigation scenario incorporating the
extent of area to be covered for meeting different
goals.
Data required for assessing different activities: The data
required for assessing the mitigation potential of affore-
station and reforestation include land area-related infor-
mation, baseline carbon density (tC/ha) in above-ground
vegetation and soil, rotation period, above-ground woody
biomass accumulation rate (tC/ha/yr), soil carbon en-
hancement rate (tC/ha/yr), and cost and benefit flows. In-
put data were obtained from the literature14,15
.
Outputs of the COMAP model: These include mitiga-
tion potential estimates per ha and aggregate tonnes of
carbon benefit, annual carbon stocks, carbon stocks for a
given year such as 2008 and 2012 and cumulative over a
period, and cost-effectiveness parameters.
Carbon stock estimates
Estimates for the forest carbon stocks, including biomass
and soil carbon from previous studies are given in Figure
5. According to an earlier estimate by Richards and Flint16
,
0
2000
4000
6000
8000
10000
12000
1880
1980
1986
1986
1994
2005
Carbonstock(MtC)
Biomass carbon Soil carbon
Figure 5. Trends in carbon stock estimates for Indian forests15–19
.
4. RESEARCH ARTICLES
CURRENT SCIENCE, VOL. 95, NO. 2, 25 JULY 2008 219
0
1000
2000
3000
4000
5000
6000
7000
8000
9000
10000
2006 2008 2010 2012 2014 2016 2018 2020 2022 2024 2026 2028 2030
Carbonstock(MtC)
Forest Short rotation Long rotation Natural regeneration
0
2000
4000
6000
8000
10000
12000
2006 2008 2010 2012 2014 2016 2018 2020 2022 2024 2026 2028 2030
Carbonstock(MtC)
Soil carbon Biomass carbon
Figure 6. Projected forest carbon stocks. a, Under the current trend scenario for existing forests and area afforested (short- and
long-rotation and natural regeneration). b, According to biomass and soil carbon.
the biomass carbon stock in Indian forests was 7.94 MtC
during 1880. This study does not provide soil carbon esti-
mates. Further estimates by the same authors for 1980
showed that forest biomass carbon stock had declined by
nearly half over a period of 100 years. Estimates17–19
of
forest carbon stock, including biomass and soil carbon for
the year 1986, are in the range 8.58–9.57 GtC. According
to a latest estimate by FAO4
, total forest carbon stock in
India is 10.01 GtC. Thus, the carbon stocks in Indian forests
have not declined, and in fact seem to have increased,
over a period of 20 years (1986–2005). Forest soil carbon
accounts for over 50% of the total forest carbon stock.
Carbon stock projections under current trend
scenario
Carbon stock projections for the existing forests as well
as new area brought under afforestation and reforestation
for the current trend scenario are made for the period
2006–30. The carbon stock projections are made using
the COMAP model. The forest cover data were obtained
from the projections made using the FSI area trends (Fig-
ure 3) and afforestation rates were obtained from the past
trends (average annual rate of 1.32 mha). The biomass
and soil carbon stock and growth rates were obtained from
published literature14,15
. The afforestation rate of 1.32 mha/
annum was allocated to short- and long-rotation and natu-
ral regeneration at 63.7, 32.2 and 4.1% respectively,
based on the previous years’ trend12
.
The carbon stock projections for the period 2006–30
are given in Figure 6. The carbon stock in the existing for-
ests is projected to be nearly stable over the 25-year pe-
riod at 8.79 GtC (Figure 6 a). When afforestation and
reforestation is included, the carbon stock is projected to
increase from 8.79 GtC in 2006 to 9.75 GtC by 2030,
about 11% increase (Figure 6 a). It is important to note
that COMAP model accounts for harvests and the result-
ing emissions. Thus, Indian forests will be a net sink over
the next 25 years. Figure 6 b shows the dominance of soil
carbon in the total forest carbon stock.
Factors contributing to stabilization of carbon
stocks in Indian forests
India is one of the few countries where deforestation rate
has been reduced and regulated and forest cover nearly
stabilized, unlike most other tropical countries. Further,
the projections of carbon stocks for the period 2006–30
showed that the carbon stock will increase. Thus, it is
important to understand the likely factors contributing to
the observed and projected stabilization of forest cover as
well as forest carbon stocks in India. The factors include
legislations, forest conservation and afforestation pro-
grammes, and community awareness and participation.
Forest Conservation Act, 1980
This Act is one of the most effective legislations contrib-
uting to reduction in deforestation. This was enacted to
reduce indiscriminate diversion of forest land for non-
forestry purposes, and to help regulate and control the re-
corded forest land-use changes.
Compensatory afforestation
According to Forest Conservation Act, 1980, when after
careful consideration forest land is released for any infra-
structure projects, it is mandatory for compensatory plan-
tations to be raised on an equivalent non-forested land or
equal to double the area on degraded forestland.
Wildlife parks and protected area
In India, 15.6 mha is Protected Area, where all human in-
tervention or extraction is banned.
Afforestation
India has been implementing large-scale afforestation/
reforestation since 1980 under social forestry, Joint Forest
5. RESEARCH ARTICLES
CURRENT SCIENCE, VOL. 95, NO. 2, 25 JULY 2008220
Management, silvi-pasture, farm forestry and agro-forestry
programmes, covering over 30 mha. This may have reduced
pressure on the forests.
National Forest Policy, 1988
It envisages people’s participation in the development and
protection of forests. The basic objective of this policy is
to maintain environmental stability through preservation
of forests as a natural heritage.
Joint Forest Management (JFM), 1990
The Forest Policy 1988 set the stage for participatory forest
management in India. The JFM programme recognized
the rights of the protecting communities over forest lands.
The local communities and the Forest Department jointly
plan and implement forest regeneration programmes and
the communities are rewarded for their efforts in protection
and management. The total area covered under the JFM
programme is over 15 mha. This has enabled protection
of existing forests, regeneration of degraded forests and
raising of forest plantations, potentially contributing to
conservation of existing forests and carbon stocks.
Significance of stabilization of forest carbon
stocks in India
India is one of the few countries in the world, particularly
among the tropical countries, where carbon stock in forests
has stabilized or is projected to increase. This has impli-
cations for reducing the carbon emissions from forest sector,
potentially contributing to stabilization of CO2 concentra-
tion in the atmosphere. This Indian achievement is sig-
nificant due to the following.
High population density and low per capita
forest area
India is a large developing country with a population
density of 363 persons/km2
. Even more significantly, the
forest area per capita is only 0.06 ha, compared to the world
average of 0.62 ha/capita and Asian average of 0.15 ha/
capita. A comparison of key developing countries and
Western European countries4
is provided in Table 2. For-
ests and wooded land area per 1000 population in Germany
and France is nearly two and five times that of India.
Similarly, forest and wooded land in other major develop-
ing countries such as Brazil, China and Indonesia are also
higher by 3 to 40 times, as compared to India.
Low deforestation rate compared to other
developing countries
According to the Global Forest Resources Assessment4
,
countries such as India and China are experiencing an in-
crease in forest area since 1990 (Table 3). However, majo-
rity of the other tropical countries with large area under
forests are experiencing deforestation on a significant
scale since 1990 (Table 3). Majority of the countries (42–
65%) are experiencing reduction in forest area or net de-
forestation4
(Table 4).
High dependence of human population on forests
In India, nearly 196,000 villages are in the forests or on the
forest fringes. Fuelwood is a dominant source of cooking
energy for the rural population with forests contributing
significantly to this. Apart from fuelwood, village commu-
nities depend on forests for small timber, bamboo and non-
timber forest products.
High livestock density
India accounts for 2.3% of the world’s geographic area,
but accounts for 15% of the global livestock population.
The cattle (cows, bullocks and buffaloes) population den-
sity is nearly one per hectare. When sheep and goats are
included along with cattle, the livestock population den-
sity further increases to 1.5 per hectare. However, if only
forest land is considered, the livestock density is 7 per
hectare, which is among the highest in the world.
Table 2. Comparison of total forest area and forest area/1000 population4
Total area under Forest and wooded
Population Forest area Other wooded forest and wooded land (ha/1000
Country (million) (‘000 ha) land (‘000 ha) land (‘000 ha) population)
India 1079 67,701 4110 71,811 66
China 1326 197,290 87,615 284,905 215
Brazil 178 477,698 0 477,698 2673
Indonesia 217 88,495 0 88,495 406
Germany 82 11,076 0 11,076 134
United Kingdom 59 2845 20 2865 48
France 59 15,554 1708 17,262 287
6. RESEARCH ARTICLES
CURRENT SCIENCE, VOL. 95, NO. 2, 25 JULY 2008 221
Table 3. Comparison of forest area change and deforestation (in ‘000 ha) in other major developing countries4
Net annual change in Area under forest Net annual change in
forest area (‘000 ha) (‘000 ha) forest area (‘000 ha)
Key developing
Region 1990 to 2000 2000 to 2005 countries 1990 2000 2005 1990–2000 2000–2005
Asia –792 1003 China 157,141 177,001 197,290 1986 4058
India 63,939 67,554 67,701 362 29
Indonesia 116,567 97,852 88,495 –1872 –1871
Malaysia 22,376 21,591 20,890 –78 –140
Philippines 10,574 7949 7162 –262 –157
Africa –4375 –4040 Sudan 76,381 70,491 67,546 –589 –589
Zambia 49,124 44,676 42,452 –445 –445
UR Tanzania 41,441 37,318 35,257 –412 –412
Nigeria 17,234 13,137 11,089 –410 –410
South Africa 9203 9203 9203 0 0
South America –3802 –4251 Brazil 520,027 493,213 477,698 –2681 –3103
Argentina 35,262 33,770 33,021 –149 –150
Mexico 69,016 65,540 64,238 –348 –260
Peru 70,156 69,213 68,742 –94 –94
Columbia 61,439 60,963 60,728 –48 –47
Table 4. Countries with positive, negative and zero or marginal annual rate of change in forest area4
Countries with negative Countries with positive Countries with zero net Countries with no
Total number rate of net annual change rate of net annual change annual change in forest significant net annual change
Region of countries in forest area (2000–05) in forest area (2000–05) area (2000–05) in forest area (2000–05)
Asia 48 20 13 12 3
Africa 58 38 8 8 4
South America 15 8 2 3 2 (not available)
Dominance of agrarian economy
Rural areas in India are characterized by large depend-
ence of the population on land resources, particularly
cropland and forest land, leading to more human pressure
on land.
Implications of Indian forest conservation and
development programmes and policies for global
change
India is a large developing country with a high population
density and low forest area per capita. The livestock
population density is among the highest in the world. Fur-
ther, nearly 70% of the population residing in rural areas
depends on forest and other biomass resources for fuel-
wood, timber and non-timber forest products for its en-
ergy needs and livelihood. In such a socio-economic
scenario, one would have expected the forest area to decline,
leading to large emissions of CO2 from the forest sector.
The analysis of forest cover, afforestation and refores-
tation has shown that the forest cover has stabilized in the
past 15 years (64–67 mha). Projections under the current
trend scenario indicate that the forest cover is likely to
increase in the period 2006–30. Further, model-based
projections of carbon stocks in the Indian forest sector
show a likely increase (from 8.79 GtC in 2005 to 9.75 GtC
in 2030). This is a significant achievement for a develop-
ing country such as India, despite high human and live-
stock population density, high dependence of rural
communities on forests for biomass resources and low per
capita forest area. The factors contributing to the current
and projected trends of stable or increasing carbon stocks
in the forests are progressive and effective forest conser-
vation legislations, afforestation and reforestation pro-
grammes and community participation in forest protection,
regeneration and management.
The progressive conservation-oriented forest policies
and afforestation programmes are contributing to reduc-
tion in CO2 emissions to the atmosphere, stabilization of
carbon stocks in forests and conservation of biodiversity.
Thus, the Indian forest sector is projected to keep making
positive contributions to global change and sustainable
development. This projected estimate and conclusion ex-
cludes any potential decline in forest carbon stocks due to
forest conversion, forest degradation, biomass extraction,
fire, etc.
7. RESEARCH ARTICLES
CURRENT SCIENCE, VOL. 95, NO. 2, 25 JULY 2008222
1. Ministry of Environment and Forests, India’s Initial National
Communication to UNFCCC (NATCOM), New Delhi, 2004;
available at http://www.natcomindia.org/natcomreport.htm
2. http://envfor.nic.in/nfap/, accessed on 11 July 2007.
3. Forest Survey of India, State of Forest Report 2003, Ministry of
Environment and Forests, Dehra Dun.
4. FAO, State of the World’s Forests, Rome, 2005.
5. Forest Survey of India, State of Forest Report 1987, Ministry of
Environment and Forests, Dehra Dun.
6. Forest Survey of India, State of Forest Report 2001, Ministry of
Environment and Forests, Dehra Dun.
7. Forest Survey of India, State of Forest Report 1989, Ministry of
Environment and Forests, Dehra Dun.
8. Forest Survey of India, State of Forest Report 1991, Ministry of
Environment and Forests, Dehra Dun.
9. Forest Survey of India, State of Forest Report 1993, Ministry of
Environment and Forests, Dehra Dun.
10. Forest Survey of India, State of Forest Report 1995, Ministry of
Environment and Forests, Dehra Dun.
11. Forest Survey of India, State of Forest Report 1997, Ministry of
Environment and Forests, Dehra Dun.
12. Forest Survey of India, State of Forest Report 1999, Ministry of
Environment and Forests, Dehra Dun.
13. Sathaye, J. and Meyers, S., Greenhouse Gas Mitigation Assess-
ment: A Guidebook, Kluwer, Dordrecht, The Netherlands, 1995.
14. Ravindranath, N. H. et al., Methodological Issues in forestry miti-
gation projects: A case study of Kolar district. Miti. Adap. Strat.
Global Change, 2007, 12, 1077–1098.
15. Ravindranath, N. H., Sudha, P. and Sandhya, R., Forestry for sus-
tainable biomass production and carbon sequestration in India.
Miti. Adap. Strat. Global Change, 2001, 6, 233–256.
16. Richards, J. F. and Flint, E. P., Historic land use and carbon esti-
mates for South and Southeast Asia 1880–1980. ORNL/CDIAC-
61, NDP-046, Oak Ridge National Laboratory, Tennessee, USA,
1994.
17. Ravindranath, N. H., Somashekhar, B. S. and Gadgil, M., Carbon
flows in Indian forests. Climate Change, 1997, 35, 297–320.
18. Chhabra, A. and Dadhwal, V. K., Assessment of major pools and
fluxes of carbon in Indian forests. Climate Change, 2004, 64, 341–
360.
19. Haripriya, G. S., Carbon budget of the Indian forest ecosystem. Cli-
mate Change, 2003, 56, 291–319.
ACKNOWLEDGEMENTS. We thank the MOEF, GOI for supporting
this project as well as climate change research activities at the Centre
for Ecological Sciences, Indian Institute of Science, Bangalore. We
also thank Jayant Sathaye and Ken Andrasko for their support in our
climate change research over the years.
Received 12 July 2007; revised accepted 22 May 2008
Erratum
Sago starch: An economical substitute for in vitro primary screening of starch utilizing microorganisms
R. B. Binky, R. Saikiran, S. Tushar, P. Umesh, J. Yogesh and A. N. Syed
[Curr. Sci., 2007, 93, 459–461]
Line 1, para 2, 2nd column should have been:
1. Successful use of isabgol derived from Plantago ovata seeds, gum katira exuded from Cochlospermum religiosum
bark and guar gum from endosperm of Cyamopsis tetragonoloba as gelling agent has been reported for microbial
culture media3,6,7
.
2. Nene, Z. L. in ref. 6 should have been Nene, Y. L.
We regret the error.
—Authors