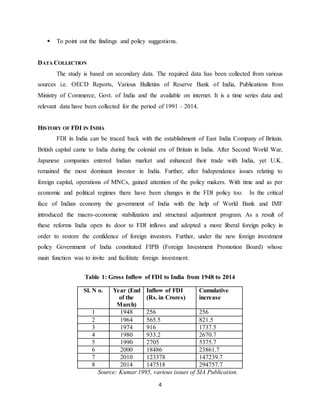
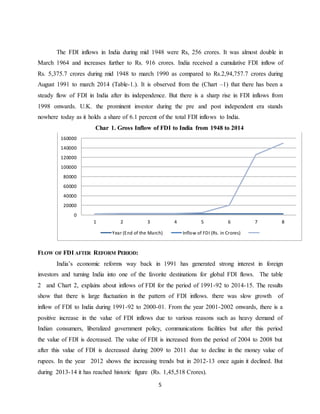
FOREIGN DIRECT INVESTMENT AND 
INDIAN ECONOMY 
1 
Dr. Shoukat ali M Magalmani1 
INTRODUCTION 
Foreign Direct Investment (FDI) is considered to be the life blood and an important 
vehicle for economic development for the developing nations. The important effect of FDI is its 
contribution to the growth of the economy. Both home country and host country get benefit from 
it. The home countries take the advantage of vast international market for its abundance resource 
and host country specially developing nations accepted FDI as a sole visible panacea for all their 
scarcities. They try to acquire the financial, capital, entrepreneurial, technological know- how, 
skills and practices, access to markets- abroad- in their economic development. It has also an 
important impact on country‘s trade balance, increasing labour standards and skills, transfer of 
technology and innovative ideas and the general business climate. In present day FDI provides 
opportunity for technological transfer and up gradation, access to global managerial skills and 
practices, optimal utilization of human capabilities and natural resources, making industry 
internationally competitive, opening up export markets, access to international quality goods and 
services and augmenting employment opportunities. 
MEANING OF FDI 
FDI is defined as “cross-border investment by a resident entity in one economy with the 
objective of obtaining a lasting interest in an enterprise resident in another economy”. In other 
words FDI refers to ‘capital inflows from abroad that is invested in or to enhance the production 
capacity of the economy’. It is also is an investment made by a foreign company or entity into a 
company or entity based in another country. Entities making direct investments typically have a 
significant degree of influence and control over the company into which the investment is made. 
Open economies with skilled workforces and good growth prospects tend to attract larger 
1 HOD and Associate Professor, Department of Economics, JSS Banashankari Arts, Commerce and S K Gubbi Science 
College, Vidyagiri, Dharwad 580004. E-mail: shoukat_mm@yahoo.com. Mob. 9448529867
amounts of foreign direct investment than closed and highly regulated economies. Organization 
for Economic Co-operation and Development (OECD) has defined FDI as “investment by a 
foreign investor in at least 10% or more of the voting stock or ordinary shares of the investee 
company”. So the FDI may affect the government trade barriers and policies for the foreign 
investments and leads to less or more effective towards contribution in economy as well as GDP 
of the economy. 
2 
BENEFITS OF FDI FOR HOST COUNTRIES 
The FDI helps not only for home country but also for host country. This has been 
explained under following box 1. 
Box 1 
Host country determinants of foreign direct investment (FDI) 
Host country determinants 
Type of FDI 
classified by 
motives of firms 
Principal economic 
determinants in host countries 
Policy framework for FDI 
stability 
Rules regarding entry and 
operations 
affiliates 
Policies on functioning and 
structure of markets (especially 
competition and policies governing 
mergers and acquisitions) 
barriers) and coherence of FDI and 
trade policies 
Economic determinants & Business 
facilitation 
Investment promotion (including 
image-building and investment- 
Market-seeking 
income 
markets 
-specific consumer 
preferences 
Resource/asset-seeking 
-cost unskilled labor 
Technological, innovative, 
and other created assets (for 
example, brand names), 
including as embodied in 
individuals, firms, and clusters 
ts, 
roads, power, 
telecommunications) 
Efficiency seeking 
listed above, adjusted for labor 
productivity
3 
generating activities and investment-and 
administrative efficiency) 
bilingual schools, quality of life) 
-investment services 
transport and communication 
costs to/from and within host 
economy and other intermediate 
products 
integration agreement conducive 
to the establishment of regional 
corporate networks 
Source: UNCTAD, World Investment Report 1998: Trends and Determinants, Table IV.1, p. 91. 
REVIEW OF LITERATURE 
The various studies are carried out by large number of researchers. They try to correlate 
the economic development with FDI inflows. There are two school of thought argued FDI is 
needed for growth of Indian economy and another traditional school of thought assumed that FDI 
plays a negative role in economic development of the country. 
Lipsey (2002) identifies the effect of inward FDI on the economic growth of host 
country. FDI helps domestic firms to achieve higher productivity. Alfro (2003) study concluded 
that FDI flows into the different sectors of the economy (namely primary, manufacturing, and 
services) exert different effects on economy. Jiang et.al. (2010) conducted a study to know the 
impact of FDI on Chinese culture. The study has concluded that FDI from Japan and Singapore 
has a significantly positive effect on the degree of in-group collectivism. Ramasamy and Yeung 
(2010) examined the relation between FDI, wages and productivity in china. It was found that 
FDI inflow influenced the wage rates and has a positive effect on productivity. 
Hausmann and Fernandez-Arias (2000) explored the limitation attach with FDI. The 
study recommended that the foreign companies will bring minimize new technology because of 
fear of acceptance and also do not want to leakage their technology. 
OBJECTIVES OF THE STUDY 
The main objectives of the present study is follows 
 To know the historical growth of FDI inflow into India. 
 To distinguish the flow of FDI pre and post reform period. 
 To identify the flow of FDI from across the countries and states. 
 To analyse the sector wise flow of FDI.
 To point out the findings and policy suggestions. 
Inflow of FDI 
(Rs. in Crores) 
1 1948 256 256 
2 1964 565.5 821.5 
3 1974 916 1737.5 
4 1980 933.2 2670.7 
5 1990 2705 5375.7 
6 2000 18486 23861.7 
7 2010 123378 147239.7 
8 2014 147518 294757.7 
4 
DATA COLLECTION 
The study is based on secondary data. The required data has been collected from various 
sources i.e. OECD Reports, Various Bulletins of Reserve Bank of India, Publications from 
Ministry of Commerce, Govt. of India and the available on internet. It is a time series data and 
relevant data have been collected for the period of 1991 – 2014. 
HISTORY OF FDI IN INDIA 
FDI in India can be traced back with the establishment of East India Company of Britain. 
British capital came to India during the colonial era of Britain in India. After Second World War, 
Japanese companies entered Indian market and enhanced their trade with India, yet U.K. 
remained the most dominant investor in India. Further, after Independence issues relating to 
foreign capital, operations of MNCs, gained attention of the policy makers. With time and as per 
economic and political regimes there have been changes in the FDI policy too. In the critical 
face of Indian economy the government of India with the help of World Bank and IMF 
introduced the macro-economic stabilization and structural adjustment program. As a result of 
these reforms India open its door to FDI inflows and adopted a more liberal foreign policy in 
order to restore the confidence of foreign investors. Further, under the new foreign investment 
policy Government of India constituted FIPB (Foreign Investment Promotion Board) whose 
main function was to invite and facilitate foreign investment. 
Table 1: Gross Inflow of FDI to India from 1948 to 2014 
Sl. N o. Year (End 
of the 
March) 
Cumulative 
increase 
Source: Kumar 1995, various issues of SIA Publication.
The FDI inflows in India during mid 1948 were Rs, 256 crores. It was almost double in 
March 1964 and increases further to Rs. 916 crores. India received a cumulative FDI inflow of 
Rs. 5,375.7 crores during mid 1948 to march 1990 as compared to Rs.2,94,757.7 crores during 
August 1991 to march 2014 (Table-1.). It is observed from the (Chart –1) that there has been a 
steady flow of FDI in India after its independence. But there is a sharp rise in FDI inflows from 
1998 onwards. U.K. the prominent investor during the pre and post independent era stands 
nowhere today as it holds a share of 6.1 percent of the total FDI inflows to India. 
Char 1. Gross Inflow of FDI to India from 1948 to 2014 
1 2 3 4 5 6 7 8 
Year (End of the March) Inflow of FDI (Rs. in Crores) 
5 
160000 
140000 
120000 
100000 
80000 
60000 
40000 
20000 
0 
FLOW OF FDI AFTER REFORM PERIOD: 
India’s economic reforms way back in 1991 has generated strong interest in foreign 
investors and turning India into one of the favorite destinations for global FDI flows. The table 
2 and Chart 2, explains about inflows of FDI for the period of 1991-92 to 2014-15. The results 
show that there is large fluctuation in the pattern of FDI inflows. there was slow growth of 
inflow of FDI to India during 1991-92 to 2000-01. From the year 2001-2002 onwards, there is a 
positive increase in the value of FDI inflows due to various reasons such as heavy demand of 
Indian consumers, liberalized government policy, communications facilities but after this period 
the value of FDI is decreased. The value of FDI is increased from the period of 2004 to 2008 but 
after this value of FDI is decreased during 2009 to 2011 due to decline in the money value of 
rupees. In the year 2012 shows the increasing trends but in 2012-13 once again it declined. But 
during 2013-14 it has reached historic figure (Rs. 1,45,518 Crores).
Table 2: Inflow of FDI: Post Reform Period 1991 to 2014 
Sl, No. 
Years 
FDI inflows in India 
6 
(Rs. in Crores ) 
1 1991-92 409 
2 1992-93 1094 
3 1993-94 2018 
4 1994-95 4312 
5 1995-96 6916 
6 1996-97 9654 
7 1997-98 13548 
8 1998-99 12343 
9 1999-00 10311 
10 2000-01 10,733 
11 2001-02 18,654 
12 2002-03 12,871 
13 2003-04 10,064 
14 2004-05 14,653 
15 2005-06 24,584 
16 2006-07 56,390 
17 2007-08 98,642 
18 2008-09 ‘*’ 142,829 
19 2009-10 # 123,120 
20 2010-11 # 97,320 
21 2011-12 # ^ 165,146 
22 2012-13 # 121,907 
23 2013-14 147,518 
24 2014-15 (Apr - Jul, 2014) 64,193 
Source: Various issues of SIA Publication 
Note: (i) including amount remitted through RBI’s-NRI Schemes (2000-2002). 
(ii) FEDAI (Foreign Exchange Dealers Association of India) conversion rate from rupees 
to US dollar applied, on the basis of monthly average rate provided by RBI (DEPR), 
Mumbai. 
# Figures for the years 2009-10, 2010-11, 2011-12 & 2012-13 (from April, 2012 to 
September, 2012) are provisional subject to reconciliation with RBI. 
^ Inflows for the month of March, 2012 are as reported by RBI, consequent to the 
adjustment made in the figures of March, ‘11, August, ’11 and October, ‘11.
Chart 2. FDI inflow in India (Rs. in Crores) 
180000 
160000 
140000 
120000 
100000 
80000 
60000 
40000 
20000 
Source: Various issues of SIA Publications. 
FDI FROM THE VARIOUS COUNTRIES IN THE WORLD: 
Table 3 presents the FDI equity inflows from top ten countries to India from April, 2000 
to July, 2014. Our country received maximum FDI from Mauritius (35.88%), followed by 
Singapore (11.88%), U.K (9.46%), Japan (7.49%) and Netherlands (5.57%) by securing rank 
first, second, third, fourth and fifth respectively. The main reason for higher levels of investment 
from Mauritius was that the fact India entered into a double taxations avoidance agreement 
(DDTA) with Mauritius were protected from taxations in India.(Chart 3) 
Table 3.Top Ten Country-wise FDI Equity Inflows to India from 
April, 2000 to July, 2014 
7 
0 
Year 
1991-92 
1992-93 
1993-94 
1994-95 
1995-96 
1996-97 
1997-98 
1998-99 
1999-00 
2000-01 
2001-02 
2002-03 
2003-04 
2004-05 
2005-06 
2006-07 
2007-08 
2008-09 ‘*’ 
2009-10 # 
2010-11 # 
2011-12 # ^ 
2012-13 # 
2013-14 
Inflow of FDI 
Years 
S.No Name of the 
Country 
Amount of FDI Inflows (Rs. 
in crore) 
%age with total 
FDI Inflows (+) 
1 Mauritius 390691.18 35.88 
2 Singapore 135784.52 11.88 
3 United Kingdom 105795.83 9.46 
4 Japan 85639.02 7.49 
5 Netherlands 65256.29 5.57 
6 U.S.A 57835.90 5.38 
7 Cyprus 37349.33 3.38 
8 Germany 33486.48 2.99 
9 France 19398.74 1.75 
10 Switzerland 13801.42 1.23
8 
Source: RBI bulletin 
Chart 3. Inflow of FDI from Top 10 Countries in the World 
450000 
400000 
350000 
300000 
250000 
200000 
150000 
100000 
50000 
0 
Amount of FDI Inflow 
STATE-WISE INFLOW OF FDI 
Countries 
The following table 4 shows that inflow of FDI to different states in the country. Among 
the state-wise, Maharashtra, Dadra & Nagar Haveli, Daman & Diu received as high as 
Rs.3,28,166 crores from 2000 to 2014. Among these, Maharashtra receives highest because it is 
one of the commercial metropolitan city of India. The second highest share in inflow of FDI is 
Delhi and some part of Haryana, counting Rs. 2,19,274 crores (19 %) between 2000 to 2014. The 
third highest attracter of FDI is Tamil Nadu, Pondicherry accounting Rs. 71,017 (6%) Karnataka 
is also a best destination for inflow of FDI. It has received about Rs. 63,294 crores (6%) for the 
same years. 
Table 4: State-wise Inflow of FDI from April, 2000 to July, 2014 (Rs. in Crores) 
S. 
No. 
State-wise Inflows of FDI 
Cumulative 
(April ’2000 
July,2014) 
%age to total 
Inflows 
1 MAHARASHTRA, DADRA & 
NAGAR HAVELI, DAMAN & DIU 
328,166 
30 
2 DELHI, PART OF UP AND 216,274 19
9 
HARYANA 
3 TAMIL NADU, PONDICHERRY 71,017 6 
4 KARNATAKA 63,294 6 
5 GUJARAT 45,627 4 
6 ANDHRA PRADESH 45,160 4 
7 WEST BENGAL, SIKKIM, 
ANDAMAN & NICOBAR ISLANDS 
13,584 1 
8 CHANDIGARH, PUNJAB, 
HARYANA, HIMACHAL 
PRADESH 
6,227 0.6 
9 RAJASTHAN 6,623 0.5 
10. MADHYA PRADESH, 
CHATTISGARH 
6,095 0.5 
11 KERALA, LAKSHADWEEP 4,893 0.4 
12 GOA 3,710 0.4 
13 UTTAR PRADESH, UTTRANCHAL 1,965 0.2 
14 ORISSA 1,926 0.2 
15 ASSAM, ARUNACHAL PRADESH, 
MANIPUR, MEGHALAYA, 
MIZORAM, NAGALAND, 
TRIPURA 
352 0 
16 BIHAR, JHARKHAND 247 0 
17 JAMMU & KASHMIR 26 0 
18 REGIONS NOT INDICATED# 292,906 26.06 
19 TOTAL 1,108,091 100 
Source: RBI Bulletin 
Note: #Represents, FDI inflows through acquisition of existing shares by transfer from residents 
to non residents. For this, RBI Regional wise information is not provided by Reserve Bank of 
India 
SECTOR-WISE INFLOW OF FDI 
The different sectors in India received FDI for their development. This can be observed 
as follows. 
Table 5. Sector-wise FDI Equity Inflow from April, 2000 to July, 2014 
Sl. No Sectors FDI 
Inflow (Rs. In Crores) 
Percentages of 
Total FDI Inflow 
1 Service 191752.15 17.73 
2 Construction 111127.49 10.40 
3 Telecommunication 80608.47 7.23 
4 Computer Software & 
Hardware 
61707.07 5.76 
5 Drugs &Pharmaceuticals 61340.03 5.47 
6 Automobile Industry 49678.09 4.41
10 
7 Chemicals (Other than 
Fertilizers) 
47538.99 4.40 
8 Power 44667.08 4.05 
9 Metallurgical Industry 39225.17 3.60 
10 Hotel & Tourism 38030.37 3.25 
Source: RBI Bulletins. 
Note: * Services sector includes Financial, Banking, Insurance, Non-Financial / Business, 
Outsourcing, R&D, Courier, Tech. Testing and Analysis 
FDI inflows data re-classified, as per segregation of data from April 2000 onwards. 
‘+’ Percentage of inflows worked out in terms of US$ & the above amount of inflows received 
through FIPB/SIA route RBI’s automatic route & acquisition of existing shares only. 
FDI Sectoral data has been revalidated / reconciled in line with the RBI, which reflects minor 
changes in the FDI figures (increase/decrease) as compared to the earlier published sectoral 
data. 
Chart 5: Major Sector-wise inflow of FDI (Rs. in Crores) 
Service, 191752.15 
Construction , 
111127.49 
Telecommunication 
, 80608.47 
Metallurgical 
Hotel & Tourism, 
Industry, 39225.17 
Power, 44667.08 
Chemicals , 
47538.99 
Automobile 
Industry, 49678.09 
Drugs 
&Pharmaceuticals, 
61340.03 
Computer Software 
& Hardware, 
61707.07 
38030.37 
The table 5 shows the trend of FDI equity inflows in different sector from the period of 
April 2000- July 2014 in India. The results revealed that maximum contribution (17.73 %) of 
FDI inflows in service sector. After this investors’ prefer to invest in construction industry (10.40 
%), telecommunication (7.23%), computer software and hardware (5.76%) and drugs & 
pharmaceuticals (5.47%) because these sectors are more profitable as compared to others.
Services sector includes financial, banking, insurance, non-financial, outsourcing, R&D, courier, 
tech. testing and analysis. At the same time sectors like service sector, computer hardware and 
software, telecommunication etc. This can be seen in the following chart 5. 
11 
FINDINGS 
 India is one of the most important countries in the world to attract FDI. 
 The FDI inflow to India was not new one, because it was prevailed way back during the 
colonial period. 
 Since introduction of New Economic Policy 1991, FDI inflow got greater scope. This is 
because of open market conditions. 
 Service sector, construction, telecommunication etc tertiary sector attracting more FDI 
then agricultural and small scale industries. Because we need more fund the primary 
sector but they are deprived from the investment. 
 Sectors which are deprived from the FDI are those where large market potential is present 
but these are ignored by the policy makers & poor infrastructure as well as due to high 
concentration on priority sectors also contributed to the cause. 
 State- wise FDI inflows show that Maharashtra, New Delhi, Karnataka, Gujarat and 
Tamil Nadu received major investment from investors because of the infrastructural 
facilities and favourable business environment provided by these states. 
 It is observed that major investment in the above sectors came from Mauritius and 
investments in these sectors in India are primarily concentrated in Mumbai and New 
Delhi. 
 It is also observed that the realisation of approved FDI into actual disbursement is quite 
low. 
POLICY PRESCRIPTIONS 
The FDI is one of the important components for economic development of our country. 
Our economic growth has maintained higher level. Still government should take some important 
steps for further attracting and utilization of FDI. Following are suggestions for further 
impartment in FDI inflow
 The policy makers should design policies where foreign investment can be utilised as 
means of enhancing domestic production, savings, and exports; as medium of 
technological learning and technology diffusion and also in providing access to the 
external market. 
 It is suggested that the government should push for the speedy improvement of 
infrastructure sector’s requirements which are important for diversification of business 
activities. 
 Government should ensure the equitable distribution of FDI inflows among states. 
 Government must target at attracting specific types of FDI that are able to generate 
spillovers effects in the overall economy. 
 The government must promote policies which allow development process starts from 
within (i.e. through productive capacity and by absorptive capacity).. 
 Government must pay attention to the emerging Asian continent as the new economic 
12 
power – house of business transaction. 
 It is suggested that the policy makers should ensure optimum utilization of funds and 
timely implementation of projects. 
CONCLUSIONS 
A large number of changes were introduced in the country after LPG era after 1991. India 
brought about a structural breakthrough in the volume of the FDI inflows into the economy 
maintained a fluctuating and unsteady trend during reform period. It might be interest to note that 
more than 50 per cent of the total FDI inflows received in India come from Mauritius, Singapore 
and the USA. The main reason for higher levels of investment from Mauritius was that the fact 
that India entered into a double taxation avoidance agreement (DTAA) with Mauritius were 
protected from taxation in India. Among the different sectors, the service sector had received the 
larger proportion followed by computer software and hardware sector and then 
telecommunication sector. 
REFERENCES 
Alfro, L. (2003), “Foreign Direct Investment and Growth: Does Sector Matter?”, Accessed from this site 
www.grips.ac.jp/teacher/oono/hp/docu01/paper14.pdf on 5 Nov. 2013
Arabi, U. (2005). Foreign Direct Investment Flows and Sustained Growth: A Case Study of India and China. 
Paper for DEGIT conference in Mexico-City, mimeo. 
Hausmann, R. and E. Fernandez Arias. (2000), “Foreign Direct Investment: Good Cholesterol?”, Inter - 
American Development Bank, mimeo, Working paper 417, Accesed from this site www.researchgate.net/ 
ForeignDirectInvestmen tGoodCholeste on 6 Nov. 2013. 
13 
http://www.tarj.in 
Jiang, L., Chen, Q, and Liu, Y. (2010), “FDI and the Change in the Chinese Culture”, International Journal of 
Social Economies, Vol. 37 (2), pp. 101- 118 
Lipsey, R. E. (2002), “Home and Host Country Effects of FDI,” NBER Working Paper 9293, 
Accessed from this site www.nber.org/papers/w9293 on 4 Nov. 2013. 
Ramasamy, B. and Yeung, M. (2010), “A Casualty Analysis of FDI – Wages Productivity nexus 
in China”, Journal of Chinese Economic and foreign Trade Studies, Vol. 3 (1), pp. 5-23 
Weisskof T E (1972), “The Impact of Foreign Capital Inflow on Domestic Savings in Underdeveloped 
Countries”, Journal of Interna-tional Economics, Vol. 2, pp. 25-38. 
Hooda Sapna (2011), “A Study of FDI and Indian Economy ” Ph.D theses submitted NIT Kurukshetra, 
Haryana.

FDI and India

  • 1.
    FOREIGN DIRECT INVESTMENTAND INDIAN ECONOMY 1 Dr. Shoukat ali M Magalmani1 INTRODUCTION Foreign Direct Investment (FDI) is considered to be the life blood and an important vehicle for economic development for the developing nations. The important effect of FDI is its contribution to the growth of the economy. Both home country and host country get benefit from it. The home countries take the advantage of vast international market for its abundance resource and host country specially developing nations accepted FDI as a sole visible panacea for all their scarcities. They try to acquire the financial, capital, entrepreneurial, technological know- how, skills and practices, access to markets- abroad- in their economic development. It has also an important impact on country‘s trade balance, increasing labour standards and skills, transfer of technology and innovative ideas and the general business climate. In present day FDI provides opportunity for technological transfer and up gradation, access to global managerial skills and practices, optimal utilization of human capabilities and natural resources, making industry internationally competitive, opening up export markets, access to international quality goods and services and augmenting employment opportunities. MEANING OF FDI FDI is defined as “cross-border investment by a resident entity in one economy with the objective of obtaining a lasting interest in an enterprise resident in another economy”. In other words FDI refers to ‘capital inflows from abroad that is invested in or to enhance the production capacity of the economy’. It is also is an investment made by a foreign company or entity into a company or entity based in another country. Entities making direct investments typically have a significant degree of influence and control over the company into which the investment is made. Open economies with skilled workforces and good growth prospects tend to attract larger 1 HOD and Associate Professor, Department of Economics, JSS Banashankari Arts, Commerce and S K Gubbi Science College, Vidyagiri, Dharwad 580004. E-mail: shoukat_mm@yahoo.com. Mob. 9448529867
  • 2.
    amounts of foreigndirect investment than closed and highly regulated economies. Organization for Economic Co-operation and Development (OECD) has defined FDI as “investment by a foreign investor in at least 10% or more of the voting stock or ordinary shares of the investee company”. So the FDI may affect the government trade barriers and policies for the foreign investments and leads to less or more effective towards contribution in economy as well as GDP of the economy. 2 BENEFITS OF FDI FOR HOST COUNTRIES The FDI helps not only for home country but also for host country. This has been explained under following box 1. Box 1 Host country determinants of foreign direct investment (FDI) Host country determinants Type of FDI classified by motives of firms Principal economic determinants in host countries Policy framework for FDI stability Rules regarding entry and operations affiliates Policies on functioning and structure of markets (especially competition and policies governing mergers and acquisitions) barriers) and coherence of FDI and trade policies Economic determinants & Business facilitation Investment promotion (including image-building and investment- Market-seeking income markets -specific consumer preferences Resource/asset-seeking -cost unskilled labor Technological, innovative, and other created assets (for example, brand names), including as embodied in individuals, firms, and clusters ts, roads, power, telecommunications) Efficiency seeking listed above, adjusted for labor productivity
  • 3.
    3 generating activitiesand investment-and administrative efficiency) bilingual schools, quality of life) -investment services transport and communication costs to/from and within host economy and other intermediate products integration agreement conducive to the establishment of regional corporate networks Source: UNCTAD, World Investment Report 1998: Trends and Determinants, Table IV.1, p. 91. REVIEW OF LITERATURE The various studies are carried out by large number of researchers. They try to correlate the economic development with FDI inflows. There are two school of thought argued FDI is needed for growth of Indian economy and another traditional school of thought assumed that FDI plays a negative role in economic development of the country. Lipsey (2002) identifies the effect of inward FDI on the economic growth of host country. FDI helps domestic firms to achieve higher productivity. Alfro (2003) study concluded that FDI flows into the different sectors of the economy (namely primary, manufacturing, and services) exert different effects on economy. Jiang et.al. (2010) conducted a study to know the impact of FDI on Chinese culture. The study has concluded that FDI from Japan and Singapore has a significantly positive effect on the degree of in-group collectivism. Ramasamy and Yeung (2010) examined the relation between FDI, wages and productivity in china. It was found that FDI inflow influenced the wage rates and has a positive effect on productivity. Hausmann and Fernandez-Arias (2000) explored the limitation attach with FDI. The study recommended that the foreign companies will bring minimize new technology because of fear of acceptance and also do not want to leakage their technology. OBJECTIVES OF THE STUDY The main objectives of the present study is follows  To know the historical growth of FDI inflow into India.  To distinguish the flow of FDI pre and post reform period.  To identify the flow of FDI from across the countries and states.  To analyse the sector wise flow of FDI.
  • 4.
     To pointout the findings and policy suggestions. Inflow of FDI (Rs. in Crores) 1 1948 256 256 2 1964 565.5 821.5 3 1974 916 1737.5 4 1980 933.2 2670.7 5 1990 2705 5375.7 6 2000 18486 23861.7 7 2010 123378 147239.7 8 2014 147518 294757.7 4 DATA COLLECTION The study is based on secondary data. The required data has been collected from various sources i.e. OECD Reports, Various Bulletins of Reserve Bank of India, Publications from Ministry of Commerce, Govt. of India and the available on internet. It is a time series data and relevant data have been collected for the period of 1991 – 2014. HISTORY OF FDI IN INDIA FDI in India can be traced back with the establishment of East India Company of Britain. British capital came to India during the colonial era of Britain in India. After Second World War, Japanese companies entered Indian market and enhanced their trade with India, yet U.K. remained the most dominant investor in India. Further, after Independence issues relating to foreign capital, operations of MNCs, gained attention of the policy makers. With time and as per economic and political regimes there have been changes in the FDI policy too. In the critical face of Indian economy the government of India with the help of World Bank and IMF introduced the macro-economic stabilization and structural adjustment program. As a result of these reforms India open its door to FDI inflows and adopted a more liberal foreign policy in order to restore the confidence of foreign investors. Further, under the new foreign investment policy Government of India constituted FIPB (Foreign Investment Promotion Board) whose main function was to invite and facilitate foreign investment. Table 1: Gross Inflow of FDI to India from 1948 to 2014 Sl. N o. Year (End of the March) Cumulative increase Source: Kumar 1995, various issues of SIA Publication.
  • 5.
    The FDI inflowsin India during mid 1948 were Rs, 256 crores. It was almost double in March 1964 and increases further to Rs. 916 crores. India received a cumulative FDI inflow of Rs. 5,375.7 crores during mid 1948 to march 1990 as compared to Rs.2,94,757.7 crores during August 1991 to march 2014 (Table-1.). It is observed from the (Chart –1) that there has been a steady flow of FDI in India after its independence. But there is a sharp rise in FDI inflows from 1998 onwards. U.K. the prominent investor during the pre and post independent era stands nowhere today as it holds a share of 6.1 percent of the total FDI inflows to India. Char 1. Gross Inflow of FDI to India from 1948 to 2014 1 2 3 4 5 6 7 8 Year (End of the March) Inflow of FDI (Rs. in Crores) 5 160000 140000 120000 100000 80000 60000 40000 20000 0 FLOW OF FDI AFTER REFORM PERIOD: India’s economic reforms way back in 1991 has generated strong interest in foreign investors and turning India into one of the favorite destinations for global FDI flows. The table 2 and Chart 2, explains about inflows of FDI for the period of 1991-92 to 2014-15. The results show that there is large fluctuation in the pattern of FDI inflows. there was slow growth of inflow of FDI to India during 1991-92 to 2000-01. From the year 2001-2002 onwards, there is a positive increase in the value of FDI inflows due to various reasons such as heavy demand of Indian consumers, liberalized government policy, communications facilities but after this period the value of FDI is decreased. The value of FDI is increased from the period of 2004 to 2008 but after this value of FDI is decreased during 2009 to 2011 due to decline in the money value of rupees. In the year 2012 shows the increasing trends but in 2012-13 once again it declined. But during 2013-14 it has reached historic figure (Rs. 1,45,518 Crores).
  • 6.
    Table 2: Inflowof FDI: Post Reform Period 1991 to 2014 Sl, No. Years FDI inflows in India 6 (Rs. in Crores ) 1 1991-92 409 2 1992-93 1094 3 1993-94 2018 4 1994-95 4312 5 1995-96 6916 6 1996-97 9654 7 1997-98 13548 8 1998-99 12343 9 1999-00 10311 10 2000-01 10,733 11 2001-02 18,654 12 2002-03 12,871 13 2003-04 10,064 14 2004-05 14,653 15 2005-06 24,584 16 2006-07 56,390 17 2007-08 98,642 18 2008-09 ‘*’ 142,829 19 2009-10 # 123,120 20 2010-11 # 97,320 21 2011-12 # ^ 165,146 22 2012-13 # 121,907 23 2013-14 147,518 24 2014-15 (Apr - Jul, 2014) 64,193 Source: Various issues of SIA Publication Note: (i) including amount remitted through RBI’s-NRI Schemes (2000-2002). (ii) FEDAI (Foreign Exchange Dealers Association of India) conversion rate from rupees to US dollar applied, on the basis of monthly average rate provided by RBI (DEPR), Mumbai. # Figures for the years 2009-10, 2010-11, 2011-12 & 2012-13 (from April, 2012 to September, 2012) are provisional subject to reconciliation with RBI. ^ Inflows for the month of March, 2012 are as reported by RBI, consequent to the adjustment made in the figures of March, ‘11, August, ’11 and October, ‘11.
  • 7.
    Chart 2. FDIinflow in India (Rs. in Crores) 180000 160000 140000 120000 100000 80000 60000 40000 20000 Source: Various issues of SIA Publications. FDI FROM THE VARIOUS COUNTRIES IN THE WORLD: Table 3 presents the FDI equity inflows from top ten countries to India from April, 2000 to July, 2014. Our country received maximum FDI from Mauritius (35.88%), followed by Singapore (11.88%), U.K (9.46%), Japan (7.49%) and Netherlands (5.57%) by securing rank first, second, third, fourth and fifth respectively. The main reason for higher levels of investment from Mauritius was that the fact India entered into a double taxations avoidance agreement (DDTA) with Mauritius were protected from taxations in India.(Chart 3) Table 3.Top Ten Country-wise FDI Equity Inflows to India from April, 2000 to July, 2014 7 0 Year 1991-92 1992-93 1993-94 1994-95 1995-96 1996-97 1997-98 1998-99 1999-00 2000-01 2001-02 2002-03 2003-04 2004-05 2005-06 2006-07 2007-08 2008-09 ‘*’ 2009-10 # 2010-11 # 2011-12 # ^ 2012-13 # 2013-14 Inflow of FDI Years S.No Name of the Country Amount of FDI Inflows (Rs. in crore) %age with total FDI Inflows (+) 1 Mauritius 390691.18 35.88 2 Singapore 135784.52 11.88 3 United Kingdom 105795.83 9.46 4 Japan 85639.02 7.49 5 Netherlands 65256.29 5.57 6 U.S.A 57835.90 5.38 7 Cyprus 37349.33 3.38 8 Germany 33486.48 2.99 9 France 19398.74 1.75 10 Switzerland 13801.42 1.23
  • 8.
    8 Source: RBIbulletin Chart 3. Inflow of FDI from Top 10 Countries in the World 450000 400000 350000 300000 250000 200000 150000 100000 50000 0 Amount of FDI Inflow STATE-WISE INFLOW OF FDI Countries The following table 4 shows that inflow of FDI to different states in the country. Among the state-wise, Maharashtra, Dadra & Nagar Haveli, Daman & Diu received as high as Rs.3,28,166 crores from 2000 to 2014. Among these, Maharashtra receives highest because it is one of the commercial metropolitan city of India. The second highest share in inflow of FDI is Delhi and some part of Haryana, counting Rs. 2,19,274 crores (19 %) between 2000 to 2014. The third highest attracter of FDI is Tamil Nadu, Pondicherry accounting Rs. 71,017 (6%) Karnataka is also a best destination for inflow of FDI. It has received about Rs. 63,294 crores (6%) for the same years. Table 4: State-wise Inflow of FDI from April, 2000 to July, 2014 (Rs. in Crores) S. No. State-wise Inflows of FDI Cumulative (April ’2000 July,2014) %age to total Inflows 1 MAHARASHTRA, DADRA & NAGAR HAVELI, DAMAN & DIU 328,166 30 2 DELHI, PART OF UP AND 216,274 19
  • 9.
    9 HARYANA 3TAMIL NADU, PONDICHERRY 71,017 6 4 KARNATAKA 63,294 6 5 GUJARAT 45,627 4 6 ANDHRA PRADESH 45,160 4 7 WEST BENGAL, SIKKIM, ANDAMAN & NICOBAR ISLANDS 13,584 1 8 CHANDIGARH, PUNJAB, HARYANA, HIMACHAL PRADESH 6,227 0.6 9 RAJASTHAN 6,623 0.5 10. MADHYA PRADESH, CHATTISGARH 6,095 0.5 11 KERALA, LAKSHADWEEP 4,893 0.4 12 GOA 3,710 0.4 13 UTTAR PRADESH, UTTRANCHAL 1,965 0.2 14 ORISSA 1,926 0.2 15 ASSAM, ARUNACHAL PRADESH, MANIPUR, MEGHALAYA, MIZORAM, NAGALAND, TRIPURA 352 0 16 BIHAR, JHARKHAND 247 0 17 JAMMU & KASHMIR 26 0 18 REGIONS NOT INDICATED# 292,906 26.06 19 TOTAL 1,108,091 100 Source: RBI Bulletin Note: #Represents, FDI inflows through acquisition of existing shares by transfer from residents to non residents. For this, RBI Regional wise information is not provided by Reserve Bank of India SECTOR-WISE INFLOW OF FDI The different sectors in India received FDI for their development. This can be observed as follows. Table 5. Sector-wise FDI Equity Inflow from April, 2000 to July, 2014 Sl. No Sectors FDI Inflow (Rs. In Crores) Percentages of Total FDI Inflow 1 Service 191752.15 17.73 2 Construction 111127.49 10.40 3 Telecommunication 80608.47 7.23 4 Computer Software & Hardware 61707.07 5.76 5 Drugs &Pharmaceuticals 61340.03 5.47 6 Automobile Industry 49678.09 4.41
  • 10.
    10 7 Chemicals(Other than Fertilizers) 47538.99 4.40 8 Power 44667.08 4.05 9 Metallurgical Industry 39225.17 3.60 10 Hotel & Tourism 38030.37 3.25 Source: RBI Bulletins. Note: * Services sector includes Financial, Banking, Insurance, Non-Financial / Business, Outsourcing, R&D, Courier, Tech. Testing and Analysis FDI inflows data re-classified, as per segregation of data from April 2000 onwards. ‘+’ Percentage of inflows worked out in terms of US$ & the above amount of inflows received through FIPB/SIA route RBI’s automatic route & acquisition of existing shares only. FDI Sectoral data has been revalidated / reconciled in line with the RBI, which reflects minor changes in the FDI figures (increase/decrease) as compared to the earlier published sectoral data. Chart 5: Major Sector-wise inflow of FDI (Rs. in Crores) Service, 191752.15 Construction , 111127.49 Telecommunication , 80608.47 Metallurgical Hotel & Tourism, Industry, 39225.17 Power, 44667.08 Chemicals , 47538.99 Automobile Industry, 49678.09 Drugs &Pharmaceuticals, 61340.03 Computer Software & Hardware, 61707.07 38030.37 The table 5 shows the trend of FDI equity inflows in different sector from the period of April 2000- July 2014 in India. The results revealed that maximum contribution (17.73 %) of FDI inflows in service sector. After this investors’ prefer to invest in construction industry (10.40 %), telecommunication (7.23%), computer software and hardware (5.76%) and drugs & pharmaceuticals (5.47%) because these sectors are more profitable as compared to others.
  • 11.
    Services sector includesfinancial, banking, insurance, non-financial, outsourcing, R&D, courier, tech. testing and analysis. At the same time sectors like service sector, computer hardware and software, telecommunication etc. This can be seen in the following chart 5. 11 FINDINGS  India is one of the most important countries in the world to attract FDI.  The FDI inflow to India was not new one, because it was prevailed way back during the colonial period.  Since introduction of New Economic Policy 1991, FDI inflow got greater scope. This is because of open market conditions.  Service sector, construction, telecommunication etc tertiary sector attracting more FDI then agricultural and small scale industries. Because we need more fund the primary sector but they are deprived from the investment.  Sectors which are deprived from the FDI are those where large market potential is present but these are ignored by the policy makers & poor infrastructure as well as due to high concentration on priority sectors also contributed to the cause.  State- wise FDI inflows show that Maharashtra, New Delhi, Karnataka, Gujarat and Tamil Nadu received major investment from investors because of the infrastructural facilities and favourable business environment provided by these states.  It is observed that major investment in the above sectors came from Mauritius and investments in these sectors in India are primarily concentrated in Mumbai and New Delhi.  It is also observed that the realisation of approved FDI into actual disbursement is quite low. POLICY PRESCRIPTIONS The FDI is one of the important components for economic development of our country. Our economic growth has maintained higher level. Still government should take some important steps for further attracting and utilization of FDI. Following are suggestions for further impartment in FDI inflow
  • 12.
     The policymakers should design policies where foreign investment can be utilised as means of enhancing domestic production, savings, and exports; as medium of technological learning and technology diffusion and also in providing access to the external market.  It is suggested that the government should push for the speedy improvement of infrastructure sector’s requirements which are important for diversification of business activities.  Government should ensure the equitable distribution of FDI inflows among states.  Government must target at attracting specific types of FDI that are able to generate spillovers effects in the overall economy.  The government must promote policies which allow development process starts from within (i.e. through productive capacity and by absorptive capacity)..  Government must pay attention to the emerging Asian continent as the new economic 12 power – house of business transaction.  It is suggested that the policy makers should ensure optimum utilization of funds and timely implementation of projects. CONCLUSIONS A large number of changes were introduced in the country after LPG era after 1991. India brought about a structural breakthrough in the volume of the FDI inflows into the economy maintained a fluctuating and unsteady trend during reform period. It might be interest to note that more than 50 per cent of the total FDI inflows received in India come from Mauritius, Singapore and the USA. The main reason for higher levels of investment from Mauritius was that the fact that India entered into a double taxation avoidance agreement (DTAA) with Mauritius were protected from taxation in India. Among the different sectors, the service sector had received the larger proportion followed by computer software and hardware sector and then telecommunication sector. REFERENCES Alfro, L. (2003), “Foreign Direct Investment and Growth: Does Sector Matter?”, Accessed from this site www.grips.ac.jp/teacher/oono/hp/docu01/paper14.pdf on 5 Nov. 2013
  • 13.
    Arabi, U. (2005).Foreign Direct Investment Flows and Sustained Growth: A Case Study of India and China. Paper for DEGIT conference in Mexico-City, mimeo. Hausmann, R. and E. Fernandez Arias. (2000), “Foreign Direct Investment: Good Cholesterol?”, Inter - American Development Bank, mimeo, Working paper 417, Accesed from this site www.researchgate.net/ ForeignDirectInvestmen tGoodCholeste on 6 Nov. 2013. 13 http://www.tarj.in Jiang, L., Chen, Q, and Liu, Y. (2010), “FDI and the Change in the Chinese Culture”, International Journal of Social Economies, Vol. 37 (2), pp. 101- 118 Lipsey, R. E. (2002), “Home and Host Country Effects of FDI,” NBER Working Paper 9293, Accessed from this site www.nber.org/papers/w9293 on 4 Nov. 2013. Ramasamy, B. and Yeung, M. (2010), “A Casualty Analysis of FDI – Wages Productivity nexus in China”, Journal of Chinese Economic and foreign Trade Studies, Vol. 3 (1), pp. 5-23 Weisskof T E (1972), “The Impact of Foreign Capital Inflow on Domestic Savings in Underdeveloped Countries”, Journal of Interna-tional Economics, Vol. 2, pp. 25-38. Hooda Sapna (2011), “A Study of FDI and Indian Economy ” Ph.D theses submitted NIT Kurukshetra, Haryana.