Download to read offline

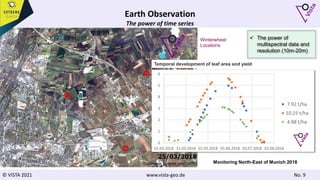
![© VISTA 2021 www.vista-geo.de No. 10
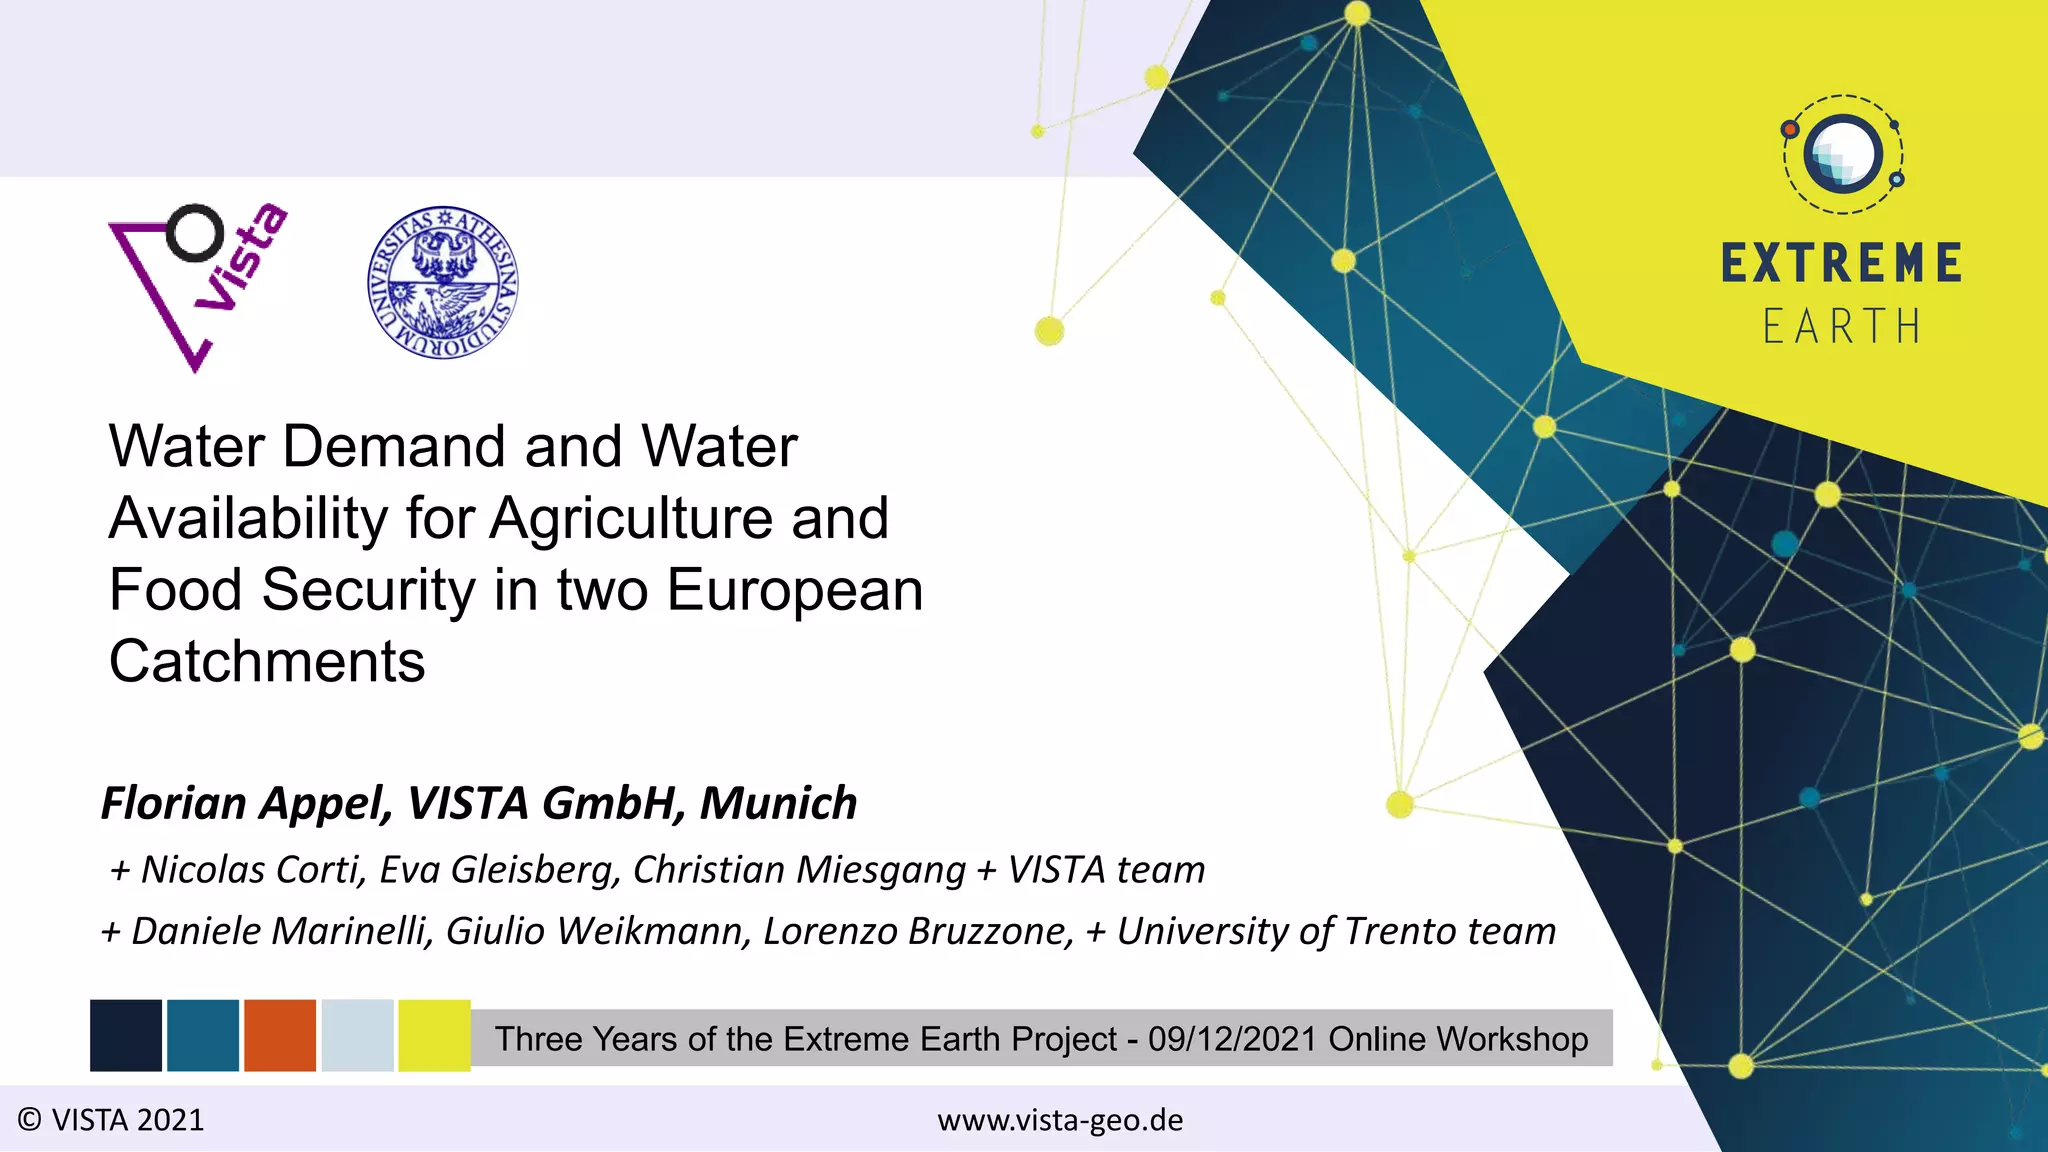
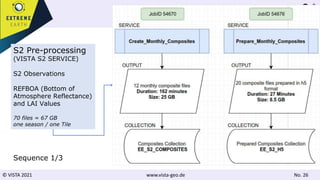
Sentinel-2 Processing
Leaf area [m²/m²]
Atmospheric
Correction
Cloud
Classification
Retrieval of
Plant
Parameters
Land Surface
Classification
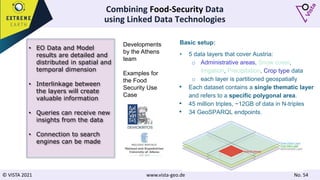
Operational Optical EO Data
Sentinel-2 EO data from the
Copernicus provides high spatial and
high temporal resolution observation
Sophisticated processing needs to be
applied to ensure detail information
Bottom of Atmosphere (BOA)
reflectance information and Leaf Area
Index (LAI) as basic products
VISTA’s Processing Chain fully
Applied on the Food Security TEP](https://image.slidesharecdn.com/foodsecurityusecasepublicworkshop08-211217124200/85/Food-Security-Use-Case-ExtremeEarth-Open-Workshop-10-320.jpg)
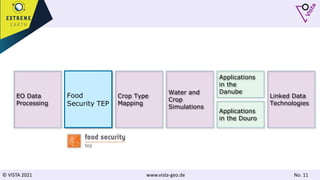
![© VISTA 2021 www.vista-geo.de No. 38
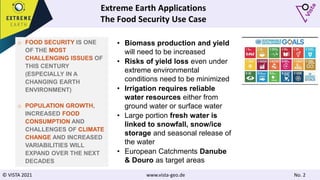
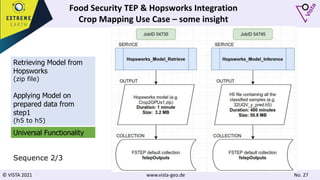
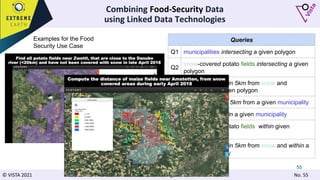
Results 2018
Danube Area / Upper Danube
0.00
0.20
0.40
0.60
0.80
1.00
0.00
10.00
20.00
30.00
40.00
50.00
crop
water
stress
precipitation
[mm],
crop
water
demand
[mm]
Upper Austria Corn
0.00
0.20
0.40
0.60
0.80
1.00
0.00
10.00
20.00
30.00
40.00
crop
water
stress
precipitation
[mm],
crop
water
demand
[mm]
Styria Corn
Precipitation CWD Water Stress
Upper
Austria
Salzburg
Lower
Austria Burgenland
Styria
Carinthia
Tyrol
Vorarlberg
Water Stress &
Crop Water Demand
Upper
Austria
Salzburg
Lower
Austria Burgenland
Styria
Carinthia
Tyrol
Vorarlberg
Upper
Austria
Salzburg
Lower
Austria
Burgenland
Styria
Carinthia
Tyrol
Vorarlberg
Rainfall
plus Irrigation
enhancing
Model Simulations
Water Stress
Irrigation
Yield
Publications
Services](https://image.slidesharecdn.com/foodsecurityusecasepublicworkshop08-211217124200/85/Food-Security-Use-Case-ExtremeEarth-Open-Workshop-38-320.jpg)
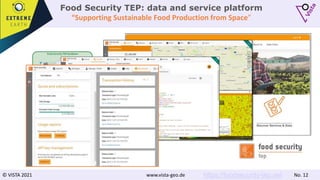
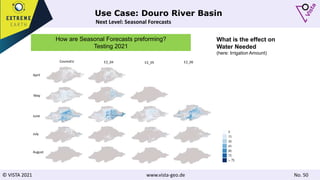
![© VISTA 2021 www.vista-geo.de No. 45
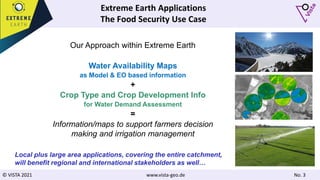
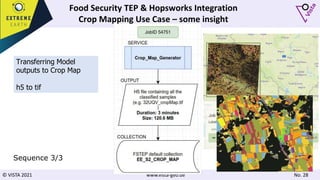
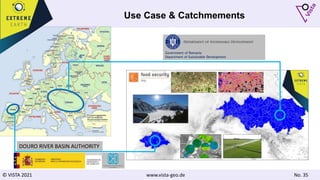
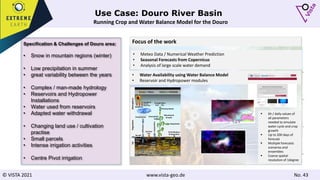
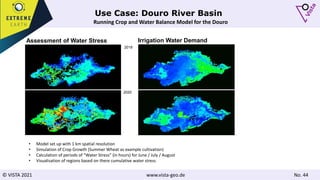
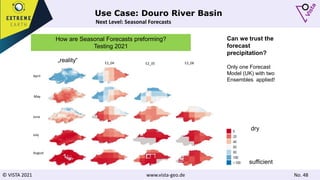
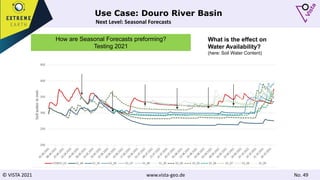
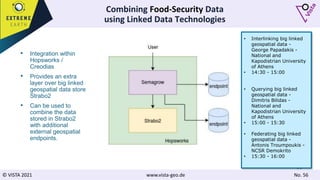
Use Case: Douro River Basin
Water Availability (Preliminary Results!)
Details
for
2021
Precipitation
[mm]
April
2021
June
2021
August
2021
Soil Water
Content
[mm]
Water
Availability](https://image.slidesharecdn.com/foodsecurityusecasepublicworkshop08-211217124200/85/Food-Security-Use-Case-ExtremeEarth-Open-Workshop-45-320.jpg)
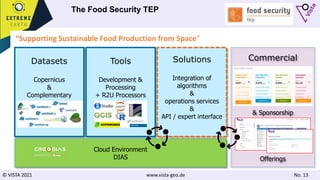
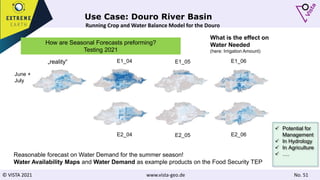
![© VISTA 2021 www.vista-geo.de No. 46
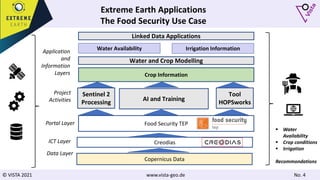
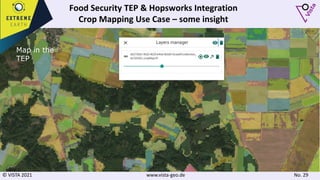
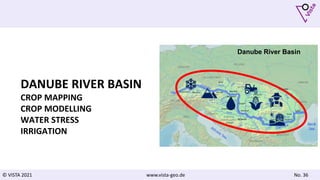
Use Case: Douro River Basin
Water Availability & Irrigation (Preliminary Results!)
Details for 2021
Irrigation Demand
[mm]
Details
for
2021
May
2021
June
2021
July
2021](https://image.slidesharecdn.com/foodsecurityusecasepublicworkshop08-211217124200/85/Food-Security-Use-Case-ExtremeEarth-Open-Workshop-46-320.jpg)
![© VISTA 2021 www.vista-geo.de No. 47
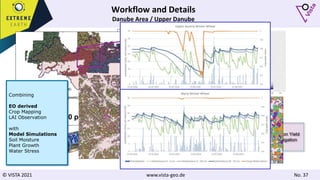
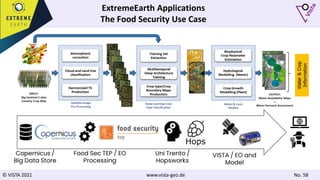
Use Case: Douro River Basin
Water Availability & Irrigation (Preliminary Results!)
Irrigation Demand
[mm]
Details
for
2021
June
2021
Areas Equipped with Irrigation
(FAO Database)](https://image.slidesharecdn.com/foodsecurityusecasepublicworkshop08-211217124200/85/Food-Security-Use-Case-ExtremeEarth-Open-Workshop-47-320.jpg)


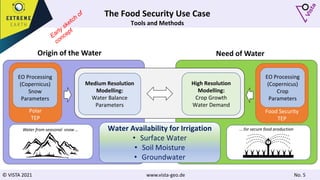
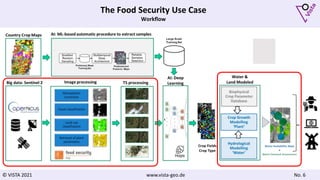
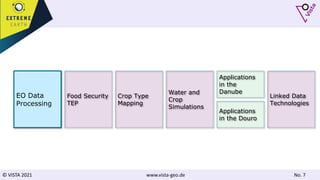
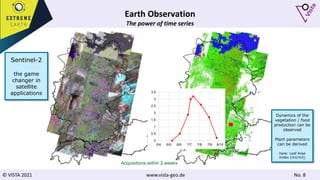
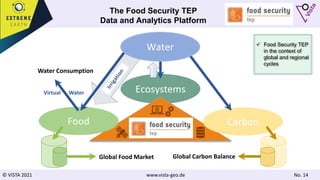
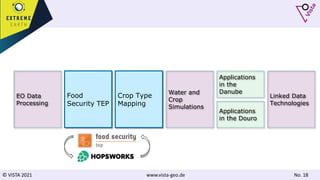
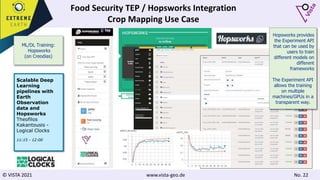
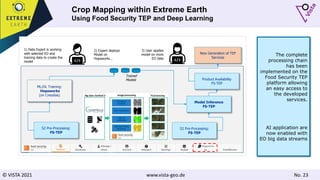
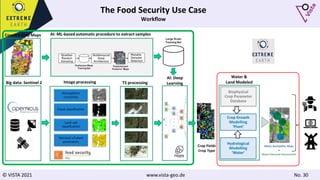
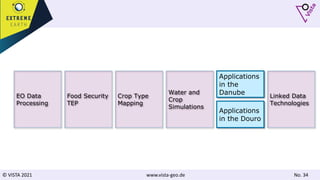
The document discusses using Earth observation data and modeling to assess water availability and demand for agriculture in two European river basins. It describes combining Sentinel-2 satellite imagery processing with crop mapping, water balance modeling, and linked data platforms to generate information on crop types, water availability, irrigation needs, and yields. Case studies are presented for the Danube and Douro River basins focusing on integrating these data and tools to support sustainable food production and irrigation management decisions.


