Role of Temperature Profiles in Basal Crevasse Transition to Rifts
1. The Transition from Basal Crevasses to Rifts: The Role of Vertical Temperature Profile
Niall Coffey1, Ching-Yao Lai1,2, Yongji Wang2, W. Roger Buck3
1Program in Atmospheric and Oceanic Sciences, Princeton University
2Department of Geosciences, Princeton University
3Lamont-Doherty Earth Observatory, Columbia University
Summary
The Problem
Temperature Modification
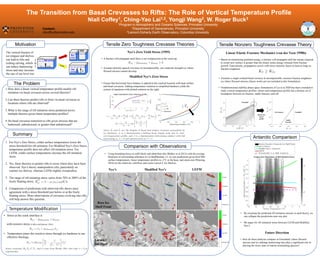
Tensile Zero Toughness Crevasse Theories
1. For Nye’s Zero Stress, colder surface temperatures lower the
stress threshold for rift initiation. For Modified Nye’s Zero Stress,
temperature profile does not affect rift initiation stress. For
LEFM, colder surface temperatures increase the rift initiation
stress.
2. Yes, these theories re-predict rifts to occur where they have been
observed. Nye’s theory underpredicts rifts, particularly on
warmer ice shelves, whereas LEFM slightly overpredicts.
3. The range of rift initiation stress varies from 70% to 200% of the
freely floating stress,
4. Comparison of predictions with observed rifts shows most
agreement with a stress threshold just below or at the freely
floating stress. More observations of crevasses evolving into rifts
will help answer this question.
Comparison with Observations
Nye’s Zero Yield Stress (1955)
• A fracture will propagate until there is net compression at the crack tip.
• Assumes densely-spaced crevasses in incompressible, zero material strength ice where
flexural stresses cannot develop.
Motivation
The vertical fracture of
ice tongues and shelves
can lead to rifts and
iceberg calving, which
can reduce buttressing
stress and may increase
the rate of sea level rise.
1.How does a linear vertical temperature profile modify rift
initiation via basal crevasses across several theories?
2.Can these theories predict rifts to form via basal crevasses in
locations where rifts are observed?
3.What is the range of rift initiation stress predicted across
multiple theories given linear temperature profiles?
4.Do basal crevasses transition to rifts given stresses that are
buttressed, unbuttressed, or greater than unbuttressed?
Contact:
nbcoffey@princeton.edu
• Stress at the crack interface is
with resistive stress (Cuffey and Paterson, 2010)
• Temperature enters the resistive stress through ice hardness in our
effective rheology,
Modified Nye’s Zero Stress
• Ensure that horizontal force balance is upheld at the cracked location with dual surface
and basal crevasses. Adding temperature variation to simplified hardness yields the
system of equations with plotted solution on the right,
Nye’s Modified Nye’s LEFM
• Using bounding boxes to infill likely and identified rifts (Walker et al 2013) with the average
thickness of surrounding unbroken ice in BedMachine v2, we test predictions given RACMO
surface temperatures, linear temperature profiles to -2°C at the base, and strain rate (Wearing,
2016) on the relatively cold Ross and warm Larsen C Ice Shelves.
Antarctic Comparison
• By rescaling the predicted rift initiation stresses in each theory, we
can collapse the predictions onto one plot.
• We argue for rift initiation stress between LEFM and Modified
Nye’s.
Linear Elastic Fracture Mechanics (van der Veen 1998b)
• Based on minimizing potential energy, a fracture will propagate until the energy required
to create new surface is greater than the elastic strain energy released from fracture
growth. Equivalently, propagation occurs with stress intensity factor at least as large as
fracture toughness.
• Assumes a single isolated basal crevasse in incompressible, nonzero fracture toughness
ice where flexural stresses (future work) are not included in this formulation.
• Nondimensional stability phase space formulation of Lai et al 2020 has been extended to
study vertical temperature profiles, where each temperature profile has a distinct set of
boundaries between no fracture, stable fracture, and rift.
Unstable!
No Fracture Unstable!
Stable
Fracture
Future Direction
• How do these analyses compare in Greenland, where flexural
stresses and ice mélange buttressing may play a significant role in
altering the stress state of marine-terminating glaciers?
Repeat for
each T
profile
Ross Ice
Shelf Front
Larsen C
Ice Shelf
Tensile Nonzero Toughness Crevasse Theory
2. Hydrofracture Vulnerability in Greenland’s Ice Slab Areas
Riley Culberg, Yue Meng, Ching-Yao Lai
Department of Geosciences, Princeton University
Motivation Poromechanical Model
Application to the Greenland Ice Sheet
Will crevasses in ice slabs fill with water?
Are water-induced stresses sufficient to hydrofracture firn?
Non-Dimensional Analysis
Comparison of the rate of water infiltration into the
firn from the crevasse tip versus the rate at which
surface streams may feed water into a crevasse.
Blue bars show the plausible range of firn water
infiltration rates. Yellow bars show small stream
discharge values measured in the ablation zone of
Southwest Greenland. Red bars show large stream
discharges from the same region. Discharge from
the smallest streams is similar to the rate of leak-
off from the crevasse tip into the firn, so the
crevasse will not fill, preventing hydrofracture.
However, larger streams can inject water fast
enough to fill crevasses. Therefore, we also need to
understand whether the resulting water pressure in
the crevasse is sufficient to cause hydrofracture.
Firn Mechanical Properties
𝛿𝜎𝑥𝑥 𝑚𝑎𝑥
′
𝛽𝑏𝛿𝑝 −
𝜈
− 𝜈
𝜌𝑤𝑔 𝐻𝑤 − 𝐻𝑖
Constant Pressure
𝛿𝑝 𝜌𝑤𝑔𝐻𝑤
Constant Injection Velocity
𝛿𝑝
𝜋
𝜂𝑤𝑉𝑖𝑛𝑗𝐿𝑐𝑟𝑒𝑣
𝑘0
l
𝜂𝑤𝑉𝑖𝑛𝑗𝐿𝑐𝑟𝑒𝑣
𝜋𝜌𝑤𝑔𝑧0𝑘0
On the Greenland Ice Sheet, hydrofracture connects the supraglacial and subglacial
hydrologic systems, coupling surface runoff dynamics and ice velocity. Over the last two
decades, the growth of low-permeability ice slabs in the firn above the equilibrium line
has expanded Greenland’s runoff zone, but the vulnerability of these regions to
hydrofracture is still poorly understood. Observations from Northwest Greenland
suggest that when meltwater drains through crevasses in ice slabs, it is often stored in
the underlying relict firn layer and does not reach the ice sheet bed. However, there is
also evidence for the drainage of buried supraglacial lakes in this same region,
suggesting some eventual transition from infiltration to fracture.
Motivating Questions:
▪ What prevents water-filled crevasses in ice slabs from propagating unstably through
the underlying relict firn layer?
▪ What drives the observed transition to full ice thickness hydrofracture once all pore
space directly beneath a lake has been filled by refreezing?
Parameter Sweep
To apply the analytical model, we must define reasonable values for the physical, mechanical, and
hydraulic properties of ice slab-firn systems in Greenland. Unfortunately, given the sparse and
uncertain observations available, it is hard to choose a single representative value for any of these
parameters. Therefore, we take a Monte Carlo simulation approach. For each variable, we define
an empirical distribution of reasonable values using a compilation of in situ, laboratory, and remote
sensing measurements reported in the literature. For the hydraulic and mechanical properties, we
use various empirical relations to define these properties as a function of firn density.
Analytical model to calculate the maximum effective stress at the crack tip for ice slab-firn systems
and solid ice.
We use a two-phase poromechanics
model to simulate water injection into
a firn layer with constant pressure and
constant injection velocity boundary
conditions. We run a suite of
simulations with different mechanical
and hydraulic properties to develop an
analytical estimate of the maximum
effective stress in the firn.
Distributions of Effective Stress
Key Conclusions
• The firn layer beneath ice slabs imparts significant
resilience to hydrofracture because:
1) Leak-off into the firn may prevent crevasses from filling
with water
2) When crevasses do fill, much of the hydrostatic stress
is accommodated by a change in pore pressure, rather
than a being transmitted to the solid skeleton
• Surface-to-bed drainage connections are unlikely to form
until all local pore space has been filled with refrozen ice.
Non-dimensional maximum effective stress as a function of firn porosity and non-dimensional
water height in the crevasse. a) Water-filled crevasses. Effective stress increases with firn porosity
and water height due to the increasing water pressure, stronger fluid-solid coupling, and reduced
lithostatic stress. b) Supraglacial lake over a crevasse. Effective stress becomes more compressive
as the water level increases, due to the added lithostatic stress. As water level increases, firn
porosity plays a great role in determining the stress, since it modulates both the hydrostatic stress
transmitted to the solid skeleton, and the portion of the lithostatic stress transmitted horizontally.
Contact:
rtculberg@princeton.edu
Physically plausible distributions of maximum effective stress in firn (purple bars) and solid ice
(blue bars). a) Partially water-filled crevasse. The ice slab-firn and solid ice systems are similar, as
reduced overburden in the ice slab-firn system balances the complete transmission of hydrostatic
stress in the solid ice system. b) Mostly water-filled crevasse. Effective stress in the solid ice
system is tensile, but remains compressive in the ice slab-firn system, as pore pressure
accommodates much of the hydrostatic stress. c) Supraglacial lake overtop a crevasse. In the ice
slab-firn system, the effective stress becomes more compressive, because lithostatic stress
increases faster with lake depth than the portion of hydrostatic stress felt by the solid skeleton.
Biot Coefficient:
portion of stress felt by
the solid skeleton
Poisson’s Ratio:
portion of vertical stress
transmitted horizontally
3. Improving Greenland Ice Sheet Freshwater Flux Parameterizations
Ellyn M. Enderlin1, Aman KC1, Dominik Fahrner2, Twila Moon3, Dustin Carroll4
1Boise State University, 2University of Oregon, 3National Snow and Ice Data Center, 4San Jose State University
Background
• Dynamic mass loss from marine-
terminating glaciers, called frontal or
terminus ablation, has two parts (Fig. 1):
(1) mass flux towards the terminus & (2)
mass removal from the terminus
• Terminus ablation is commonly estimated
as mass flux across a fixed inland “gate”
Ongoing Work
Revising terminus ablation estimates (Fig. 3)
• Focus on ~58 glaciers with good bed data near the terminus
• Flux across a fixed inland “gate” from Mankoff et al. (2020)
• Terminus delineations from TermPicks (Goliber et al., 2022)
• Filter spikes & dips in terminus change rate using near-
terminus flow speed from NASA ITS_LIVE
• Clip or extend delineations to fjord walls (Fig. 4)
• Terminus thickness from ArcticDEM & BedMachine bed
adjusted for surface elevation change using Khan (2017)
• Terminus ablation = discharge – terminus volume change
Estimating iceberg melt rates
1. Elevation-differencing method applied to all terminus
ablation sites: (method in Enderlin & Hamilton, 2014)
• manually map elevation changes using high-resolution
digital elevation models from 2011-present (Fig. 5)
• convert elevation change to meltwater fluxes using ice
density
• estimate melt rates orthogonal to a simplified
submerged geometry using meltwater flux, surface area,
and elevation data
2. Melt modeling with in situ ocean data:
• parameterize melt rates with in situ temperature +
salinity profiles & velocities from moorings near ~7
study sites
• Moon et al. (2018) iceberg melt model applied to a
range of iceberg geometries
Preliminary Results
• Basic code and dataset to be submitted for
review to Earth System Science Data (Fahrner et
al., in prep)
• (Fig. 6) Over decadal time scales, terminus
ablation is dominated by the “big 3”: Sermeq
Kujalleq (Jakobshavn), Helheim, & Kangerlussuaq
• Termpicks delineations resolve seasonal
variations in terminus position from ~2013-
present after filtering for changes that exceed
flow (mostly in automated delineation dataset)
• Seasonal terminus ablation pulses associated
with retreat (Fig. 7) can be orders of magnitude
greater than flux gate discharge
• Inter-annual variations in terminus ablation are
typically driven by discharge change, with much
small contributions from terminus
retreat/advance
Next Steps
• Augment terminus ablation pipeline to incorporate thickness changes from digital
elevation model timeseries
• Compare seasonal terminus ablation, mélange characteristic, & air and ocean
temperature reanalysis timeseries
• Expand elevation- and model-based iceberg melt datasets
References & Acknowledgements
This project is funded by NSF project “Improving estimates of Greenland’s freshwater flux: Where
do icebergs form and where do they melt?” (2052561/2052549/2052551) and the NSF-funded
Greenland Ice Sheet Ocean (GRISO) Science Network. Thank you to the GRISO Ocean Forcing Ice
Working Group for their help with the ESSD paper draft!
Mankoff et al. 2020 (doi:10.5194/essd-12-1367-2020); Goliber et al. 2022 (doi:10.5194/tc-16-3215-2022); Khan
2017 (http://promice.org/PromiceDataPortal/api/download/90fb4cbf-e88e-4e26-af95-a47d19a9cf10); Enderlin &
Hamilton 2014 (doi:10.3189/2014JoG14J085); Moon et al. 2018 (doi:10.1038/s41561-017-0018-z)
• Why iceberg production & decay matters:
• more precise knowledge of mass loss timing can
lead to insights on controls
• when & where ice is converted to liquid
freshwater may influence local-to-global ocean
circulation
• Our project’s goal is to develop Greenland
freshwater flux parameterizations that
account for variations in iceberg detachment
& melt in space and time (Fig. 2)
(top) Fig. 1:
Illustration of how
terminus ablation
can differ from
mass flux across
an inland gate for
several terminus
change scenarios.
(bottom) Fig. 2:
Project flowchart.
Objectives 1-2 are
described in the
ongoing work
section below.
Fig. 3: Flowchart outlining
terminus ablation
estimation process.
(above) Fig. 4: Modifications to terminus
delineations for mass change quantification.
(below) Fig. 5: Example of high-resolution
iceberg observations for melt estimation.
(above) Fig. 6: Cumulative terminus
ablation for 1987-2015. Symbols
colors denote magnitude and size
denotes percent for all sites.
(left) Fig. 7:
Terminus ablation
timeseries (a-c) and
terminus position
maps (d-f) for
Narsap Sermia,
Saqqarliup Sermia,
and Helheim
Gletsjer,
respectively.
Terminus
delineation colors
denote observation
year (see legend).
a) c)
b)
d) e) f)
Fig. 7b,e
Fig. 7a,d
Fig. 7c,f
4. Surprising surface similitude to bed topography in Greenland
1. Interpreting subglacial geology; and 2
1. Interpreting subglacial geology; and 2
1. Interpreting subglacial geology; and 2
Joseph A. MacGregor (joseph.a.macgregor@nasa.gov), Liam Colgan + GreenValley team
We’ve long known that prominent subglacial topographic features beneath the ice sheets can generate observable surface expressions. Recent advances in digital
elevation models (e.g., GrIMP) and bed-to-surface transfer theory now permit widespread observation of this phenomenon and easier interpretation. Hillshading a digital
elevation model across the direction of ice flow highlights major surface features nicely. For Greenland, comparison against NASA/KU/CReSIS airborne
radar-sounding data confirms that most features are due to subglacial topography and are typically valleys. This suggests a better path toward: 1. Interpolating subglacial
topography between sparse radar observations by developing methods that also require fidelity to observed surface relief; 2. Interpreting subglacial geology.
Bumps in the night
Sun valley slopes
GrIMP mosaic hillshaded
across the local direction
of ice flow (explained
below).
(A) Map of whole island
with manually traced
lineations overlain
(B–G) Zoom-ins of
selected regions with bed
elevation anomaly Δzb
(bed elevation minus 5-km
running mean) from
NASA/KU/CReSIS
radar-sounding tracks
overlain. Bed high / low.
(right column) Selected
radar-sounding tracks
from panels B–G with
along-track surface
elevation anomaly.
Ng et al. (2018)
How’d they do that?
1. Filter both the GrIMP DEM and MEaSUREs surface velocity using a 5H
thickness-dependent triangular filter and resample to a 5 km grid.
2. For the slower interior (< 100 m yr–1
), weight the flow direction toward filtered GrIMP
gradient direction.
3. Illuminate using a standard hillshade algorithm but allow illumination azimuth to vary for
each pixel, selecting the azimuth 90º counter-clockwise from the filtered ice-flow
direction. This direction consistently highlights coherent surface textures / lineations.
Next season
1. Invert for ice thickness and sliding rate across
the interior using a mono-layer model.
2. Better resolve subglacial geology using this
improved ice thickness and seismic, gravity
and magnetic data.
3. Hiring a new post-doc! Could be you!
v
5. • Current fracture mechanics (i.e., LEFM) assumes that the stored elastic energy in an
impermeable solid matrix is instantaneously dissipated by creating new crack
surfaces, which only holds for impermeable solid media. Firn is porous material that
violates such assumption;
• We extend Biot’s poroelastic theory to two-phase immiscible flow to capture the
feedback between fluid flow and matrix deformation in the firn. We show that the
presence of a permeable firn layer prevents fracture propagation because a
significant portion of the hydrostatic stress is accommodated by changes in pore
pressure (~78% of total stress change), rather than being transmitted to the solid
skeleton (~22% of total stress change);
• To couple poromechanics, including thermoporoelasticity, thermoporoplasticity,
thermoporoviscoelasticity, with suitable glacial hydrology, rheology and fracture
models, to better understanding glacier dynamics.
Vulnerability of Firn to Hydrofracture: Poromechanics Modeling
Yue Meng, Riley Culberg, Ching-Yao Lai
Department of Geosciences, Princeton University
Motivation Poromechanics: The Concept of Effective Stress
Modeling Results Are water-induced stresses sufficient to hydrofracture firn?
On the Greenland Ice Sheet, hydrofracture connects the supraglacial and subglacial
hydrologic systems, coupling surface runoff dynamics and ice velocity. Over the last two
decades, the growth of low-permeability ice slabs in the firn above the equilibrium line
has expanded Greenland’s runoff zone, but the vulnerability of these regions to
hydrofracture is still poorly understood. Observations from Northwest Greenland
suggest that when meltwater drains through crevasses in ice slabs, it is often stored in
the underlying relict firn layer and does not reach the ice sheet bed. However, there is
also evidence for the drainage of buried supraglacial lakes in this same region,
suggesting some kind of transition point from infiltration to fracture.
Motivating Questions:
▪ What prevents water-filled crevasses in ice slabs from unstably propagating through
the underlying relict firn layer?
▪ What drives the observed transition to full ice thickness hydrofracture once all pore
space directly beneath a lake has been filled by refreezing?
Analytical model to calculate the maximum effective stress at the crack tip for ice slab/firn systems and
solid ice. The poromechanical model predicts 𝛽 0.22.
When stress is applied to porous media, part of the stress is transmitted through the pore
fluid and part of the stress is transmitted through the solid skeleton. Effective stress—the
fraction of the total stress that is transmitted through the solid skeleton—controls the
mechanical behavior of porous media.
Contact:
om3193@princeton.edu
δ𝝈 𝛿𝝈′ − 𝑏𝛿𝑝𝑰
pore fluid (𝛿𝑝)
solid skeleton (𝛿𝜎′)
total stress (𝛿𝜎)
𝑏 −
𝐾
𝐾𝑠
∈ [0 ]
What is the fracture criterion for the porous firn?
0
0
2
Water injection into the firn induces a
tensile effective stress change at the
crevasse tip ( 𝛿𝜎𝑥𝑥
′ ). When the
horizontal effective stress exceeds the
firn tensile strength ( 𝜎𝑡
′
), vertical
fractures are generated. The fracture
criterion at the crevasse tip is written
as follows:
𝜎𝑥𝑥
′
𝜎𝑥𝑥 0
′
𝛿𝜎𝑥𝑥
′
≥ 𝜎𝑡
′
calculated from
lithostatic stress
calculated from
poromechanics
The 2D, Two-Phase Poroelastic Continuum Model
We use a 2D, two-phase poroelastic continuum model to solve the infiltration-induced stress
and pressure changes. The model has four governing equations, two derived from
conservation of fluid mass and two derived from conservation of linear momentum. The
model solves the time evolution of four unknowns: (1) pore pressure field 𝑝 𝑥 𝑧 𝑡 ; (2) water
saturation field 𝑆 𝑥 𝑧 𝑡 ; (3) horizontal displacement field 𝑢 𝑥 𝑧 𝑡 , and (4) vertical
displacement field 𝑤 𝑥 𝑧 𝑡 of the porous firn layer. The governing equations are summarized
and written in the x, z coordinates as follows:
Model set-up
𝟏. 𝜙
𝜕𝑆
𝜕𝑡
𝑆 𝑏
𝜕𝜖𝑘𝑘
𝜕𝑡 𝑀
𝜕𝑝
𝜕𝑡
−
𝑘0
𝜂𝑤
𝜕
𝜕𝑥
𝑘𝑟𝑤
𝜕𝑝
𝜕𝑥
−
𝑘0
𝜂𝑤
𝜕
𝜕𝑧
𝑘𝑟𝑤
𝜕𝑝
𝜕𝑧
− 𝜌𝑤𝑔 0;
𝟐. 𝑏
𝜕𝜖𝑘𝑘
𝜕𝑡 𝑀
𝜕𝑝
𝜕𝑡
− 𝑘0
𝜕
𝜕𝑥
𝑘𝑟𝑤
𝜂𝑤
𝑘𝑟𝑎
𝜂𝑎
𝜕𝑝
𝜕𝑥
−𝑘0
𝜕
𝜕𝑧
𝑘𝑟𝑤
𝜂𝑤
𝑘𝑟𝑎
𝜂𝑎
𝜕𝑝
𝜕𝑧
−
𝑘𝑟𝑤
𝜂𝑤
𝜌𝑤
𝑘𝑟𝑎
𝜂𝑎
𝜌𝑎 𝑔 0;
𝟑.
𝜕𝜎𝑥𝑥
𝜕𝑥
𝜕𝜎𝑧𝑥
𝜕𝑧
0;
𝟒.
𝜕𝜎𝑥𝑧
𝜕𝑥
𝜕𝜎𝑧𝑧
𝜕𝑧
− 𝜙 𝜌𝑠 𝜙 𝜌𝑎 − 𝑆 𝜌𝑤𝑆 𝑔 0.
δ𝝈 𝛿𝝈′ − 𝑏𝛿𝑝𝑰
𝛿𝝈′
𝛿𝝈′
3𝐾𝜈
𝜈
𝜖𝑘𝑘𝑰
3𝐾 − 2𝜈
𝜈
𝝐
Fluid continuity equations (for water and air phases):
Force balance equations (in x and z directions):
∗
𝑀
𝜙𝑆𝑐𝑤 𝜙 − 𝑆 𝑐𝑎 𝑏 − 𝜙 𝑐𝑠; 𝑘𝑟𝑤 𝑆3 𝑘𝑟𝑎 − 𝑆 2.
Here, we consider two scenarios of water infiltration into the porous firn layer:
▪ A constant water height (𝐻𝑤) in the surface crevasse;
▪ A constant water injection velocity (𝑉𝑖𝑛𝑗) at the crevasse tip.
How does the pore pressure or the skeleton stress
evolves during meltwater infiltration?
0
0.22
𝛿𝜎𝑥𝑥 𝑚𝑎𝑥
′
𝛽𝑏𝛿𝑝 −
𝜈
− 𝜈
𝜌𝑤𝑔 𝐻𝑤 − 𝐻𝑖
The poromechanical model predicts 𝛽 0.22.
Constant Pressure
𝛿𝑝 𝜌𝑤𝑔𝐻𝑤
Constant Injection Velocity
𝛿𝑝
2
𝜋
𝜂𝑤𝑉𝑖𝑛𝑗𝐿𝑐𝑟𝑒𝑣
𝑘0
l
2𝜂𝑤𝑉𝑖𝑛𝑗𝐿𝑐𝑟𝑒𝑣
𝜋𝜌𝑤𝑔𝑧0𝑘0
How does 𝜹𝝈𝒙𝒙 𝒎𝒂𝒙
′ depend on modeling parameters?
Analytical Expressions of 𝜹𝒑 and 𝜹𝝈𝒙𝒙 𝒎𝒂𝒙
′
Key Conclusions
Future Work