
More Related Content
What's hot
What's hot (15)
Viewers also liked
Viewers also liked (19)
Similar to fmc technologies 2004ar
Similar to fmc technologies 2004ar (20)
More from finance50
More from finance50 (20)
Recently uploaded
Recently uploaded (20)
fmc technologies 2004ar
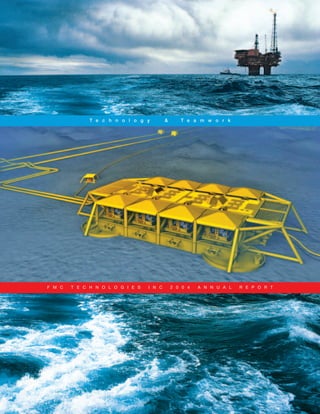
- 1. Technology & Teamwork FMC TECHNOLOGIES INC 2004 ANNUAL REPORT
- 2. corporate profile FMC Technologies, Inc. is a global leader providing mission- critical solutions, based on innovative, industry-leading technologies, for the energy, food processing and air transportation industries. The Company designs, manufactures and services sophisticated systems and products for its customers through its Energy Systems (comprising Energy Production Systems and Energy Processing Systems), FoodTech and Airport Systems businesses. FMC Technologies operates 31 manufacturing facilities in 16 countries. about the cover An artist’s concept of FMC Technologies’ subsea production system layout for Norsk Hydro’s Ormen Lange project in the North Sea illustrates the placement of subsea trees and associated structures. With reserves estimated at more than 14 trillion cubic feet, Ormen Lange is the second largest gas field on the Norwegian Continental Shelf.
- 3. Financial Highlights 2004 2003 (In millions, except per share, common stock and employee data) Total Revenue $ 2,767.7 $ 2,307.1 Net income $ 116.7 $ 68.9 Adjusted net income, a non-GAAP measure $ 86.7 — Diluted earnings per share: Net income $ 1.68 $ 1.03 Adjusted net income, a non-GAAP measure $ 1.25 — Financial and other data: Common stock price range $ 34.50 - $ 21.97 $ 24.60 - $ 17.94 At December 31 Net debt (1) $ 39.0 $ 192.5 Order backlog (2) $ 1,587.1 $ 1,258.4 Number of employees 9,000 8,600 (1) Net debt consists of short-term debt, long-term debt and the current portion of long-term debt, less cash and cash equivalents. (2) Order backlog is calculated as the estimated sales value of unfilled, confirmed customer orders at the reporting date. Reconciliation of Non-GAAP Measure to Earnings Reported in Accordance with GAAP Per Diluted Share Net Income Twelve months ended December 31, 2004 As reported in accordance with GAAP $ 116.7 $ 1.68 Unusual Items Less: Gain on conversion of investment in MODEC International LLC (36.1) (0.52) Plus: Goodwill impairment 6.1 0.09 Adjusted income, a non-GAAP measure $ 86.7 $ 1.25 Management reports its financial results in accordance with generally accepted accounting principles (“GAAP”). However, management believes that certain non-GAAP performance measures utilized for internal analysis provide financial statement users meaningful comparisons between current and prior period results, as well as important information regard- ing performance trends. This non-GAAP financial measure may be inconsistent with similar measures presented by other companies. Non-GAAP financial measures should be viewed in addition to, and not as an alternative for, the Company’s reported results. energy production systems 53% energy processing systems 18% 2004 revenues $2.8B foodtech 19% airport systems 10% 1 Financial Highlights
- 4. Performance Review Revenue $M Energy Production Systems • Energy Production Systems’ sales of $1.5B grew 31% from 2003 on the strength of subsea systems and floating production systems. 1500 • Subsea sales have more than doubled since 2001, reaching over $1B in 2004. 1200 • Operating profit in 2004 of $71.1M grew 8% from 2003, even with a $21.4M loss 900 due to weather-related costs on a floating production project offshore Algeria. • Inbound orders in 2004 increased 53% from 2003, reaching over $1.8B, due to record subsea 600 orders. Order backlog of over $1.2B provides a solid platform for 2005. 300 • Low investment requirements for subsea allowed significant growth without 0 increasing capital employed. '01 '02 '03 '04 Energy Processing Systems • Energy Processing Systems’ sales of $493M grew 14% from 2003 on increased demand for WECO®/Chiksan® equipment and strong demand for measurement and material handling systems. 1500 • Operating profit in 2004 of $27.4M includes a $6.5M charge for the impairment of goodwill 1200 in the blending and transfer product line. Operating profit improved in other product lines due to sales volume and operating margin improvements, specifically in WECO®/Chiksan® equipment 900 and measurement and material handling systems. 600 Inbound orders of $461M were up slightly from 2003 on strong demand for WECO®/Chiksan® • 300 equipment and measurement systems. Backlog fell below the 2003 level, due to delayed orders for loading systems and the absence of large projects in material handling systems. 0 '01 '02 '03 '04 • Capital employed declined in 2004, primarily on lower working capital requirements. F o o d Te c h 1500 • FoodTech sales of $526M were essentially flat compared to 2003. Strong volume in the North American and Asian freezing and cooking markets was offset by reduced food processing equip- 1200 ment sales and lower citrus revenue due to the Florida hurricanes’ impact. 900 • Operating profit in 2004 of $36.8M was below 2003, due to lower citrus profit and lower food processing equipment sales. 600 • Inbound orders of $551M increased slightly over 2003, but strong fourth quarter 2004 inbound 300 resulted in record year-end backlog of $143M. 0 • Capital requirements remained fairly level for 2003. '01 '02 '03 '04 Airport Systems 1500 Airport Systems’ sales of $280M grew 25% from 2003 on increased demand for Jetway® passen- • 1200 ger boarding bridges and ground support equipment. 900 • Operating profit in 2004 of $16M grew 29% from 2003 on increased volume and improved operating margins in both Jetway® and ground support products. 600 Inbound orders of $270M increased 12% from 2003 on greater demand for Jetway® passenger • 300 boarding bridges and ground support equipment. 0 • Capital employed increased to $78M, due to the effects on working capital of a changing '01 '02 '03 '04 customer mix. FMC Technologies Inc. Annual Report 2004 2
- 5. All years at December 31. Inbound Orders/Order Backlog $M Operating Profit $M Capital Employed *$M 400 80 2000 350 70 300 60 1500 250 50 200 40 1000 150 30 100 20 500 50 10 0 0 0 '01 '02 '03 '04 '01 '02 '03 '04 '01 '02 '03 '04 Legend Inbound Backlog 2000 80 400 70 350 1500 60 300 50 250 1000 40 200 30 150 500 20 100 10 50 0 0 0 '01 '02 '03 '04 '01 '02 '03 '04 '01 '02 '03 '04 2000 80 400 70 350 1500 60 300 50 250 1000 40 200 30 150 500 20 100 10 50 0 0 0 '01 '02 '03 '04 '01 '02 '03 '04 '01 '02 '03 '04 2000 400 80 350 70 1500 300 60 250 50 1000 200 40 150 30 500 100 20 10 50 0 0 0 '01 '02 '03 '04 '01 '02 '03 '04 '01 '02 '03 '04 * See discussion of capital employed on page 100. 3 Performance Review
- 7. Shareholders’ Letter
- 9. technology has reinforced our strong relation- In all our businesses, ships with our customers and led to the formation of enduring customer alliances. teamwork is our most distinctive This combination of technology and competitive advantage. 5 Shareholders’ Letter
- 10. from the Chairman and CEO Joseph H. Netherland Chairman, President and Chief Executive Officer, FMC Technologies, Inc. FMC Technologies had a very good year in 2004. Sales increased 20 percent and earnings per share were up 63 percent over 2003. As with most years, not everything we did was successful, but we had many more successes than disappointments. The successes were in areas that we can continue to build on, and, hopefully, our disappointments are unusual occurrences that we can avoid in the future. Net Debt & Sale-Leaseback Obligations Diluted Earnings Per Share All Years at December 31 $ $M 2.0 350 300 $1.68 1.5 250 200 1.0 $1.03 150 $0.87 $0.77 100 0.5 50 0.0 0 '01 '02 '03 '04 '01 '02 '03 '04 Net Debt Sale-Leaseback 2001 – Adjusted diluted earnings per share, a Net debt consists of short-term debt, long-term debt and the current non-GAAP measure (reconciliation on page 100) portion of long-term debt, less cash and cash equivalents. FMC Technologies Inc. Annual Report 2004 6
- 11. The successes were: The disappointments were: • Our performance on the • Our energy businesses, including $36 million while maintaining a Sonatrach contract within Energy both Energy Production Systems significant ownership stake in Production Systems, which lost and Energy Processing Systems, one of the leading Floating $13 million after tax primarily due took advantage of growth in oil- Production Storage and Offshore to higher costs associated with field activity levels by increasing (FPSO) system manufacturers in weather-related delays. sales 26 percent over 2003. the world. • A series of Florida hurricanes • Our subsea systems business, • Our focus on working capital destroyed a third of the Florida within Energy Production management allowed us to limit citrus crop, resulting in the small- Systems, again led the way by our growth in working capital est orange crop in 12 years and continuing its increase in market during the year. We reduced our the smallest grapefruit crop in 66 share to report sales of over net debt by over $150 million in years. This negatively impacted $1 billion and orders received 2004. our FoodTech business in the during the year of $1.5 billion. second half of 2004 and is likely • We were successful in resolving to negatively affect FoodTech in • Our Airport Systems business a series of tax disputes and the first half of 2005. performed well in a difficult airline tax audits during 2004 that industry environment, growing provided us with $12 million in • A lack of orders for our blending sales by 25 percent. lower domestic and foreign and transfer business within income taxes. Energy Processing Systems, • We exchanged our ownership in which created an operating loss MODEC International LLC for and caused us to impair cash and stock in MODEC, Inc., $6.5 million of goodwill realizing an after-tax gain of associated with the business. Inbound Orders Order Backlog $M $M 3500 2000 3000 1500 2500 2000 1000 1500 1000 500 500 0 0 '01 '02 '03 '04 '01 '02 '03 '04 Energy Production Energy Processing FoodTech Airport Systems 7 Shareholders’ Letter
- 12. Even including these disappointments, Business performance In our Energy Production Systems business, we increased sales in all earnings per share were up 63 per- From our company’s formation in businesses as total sales rose 31 percent cent and we saw in 2004 a 26 percent 2001 through 2004, our growth in over 2003. We delivered subsea sys- increase in order backlog. As I said earnings has been driven by our tems for major oil companies such as before, 2004 was a very good year. energy businesses, especially our BP, Shell and Kerr-McGee in the Gulf subsea business, which has capital- Our stock responded well to our of Mexico, ExxonMobil offshore West ized on the secular growth in deep- performance and appreciated over Africa, Petrobras offshore Brazil, and water development. Oilfield activity 38 percent in 2004. This compares Statoil in the North Sea. During 2004, levels improved in 2004 and had a favorably with the Oil Service Index we received orders totaling $1.8 billion, positive effect on most of our Energy (OSX), which was up 32 percent, and which included subsea orders for BP’s Systems businesses. Our Energy the S&P 500 Index, which increased Greater Plutonio project, Total’s Rosa Systems business revenue reached 9 percent in 2004. Since our IPO in almost $2 billion in 2004. 2001, our stock price has improved 61 percent compared to an increase of 2 percent in the OSX and a decline of 3 percent in the S&P 500 Index during the same period. Our technology innovations are known throughout the energy industry. technology FMC Technologies Inc. Annual Report 2004 8
- 13. reliability Jarle Rabben (left), FMC project and Woodside Energy’s Our FoodTech business experienced a Technologies Technical Service Chinguetti project, all offshore West challenging year in 2004 as four hurri- Engineer, and Frode Juvik, Africa, as well as Statoil’s Tampen canes impacted the Florida citrus crop Statoil Head Engineer, observe Area project in the North Sea. Higher and our revenue and profits from cit- operations at FMC costs and extreme weather effects on rus processing. Consolidation among Technologies’ subsea service the Sonatrach contract limited earn- the major juice producers increased facilities in Bergen, Norway. In ings growth in Energy Production competitive pressures on citrus prof- addition to receiving subsea Systems to 8 percent in 2004. itability. However, our food processing equipment orders for Statoil’s systems business experienced a Åsgard-Q, Norne Satellites and In our Energy Processing Systems recovery and improvement in its North Tampen Area projects in 2004, business, we saw strong demand American and Asian markets, particu- FMC Technologies signed an from oilfield service companies for our larly in freezing and cooking systems. extension of its existing subsea WECO®/Chiksan® equipment. We FoodTech sales were flat compared service agreement with Statoil. also experienced strong demand in with 2003, and earnings declined measurement systems and material 16 percent in 2004. handling systems. Conversely, our blending and transfer business was Airport Systems performed well in adversely impacted by order post- 2004 despite a difficult airline industry ponements. Sales grew 14 percent environment. Our ground support over the prior year, and earnings, equipment business benefited from which included a $6.5 million goodwill the strengthening businesses of inter- impairment charge for blending and national airlines and ground transfer, declined by $2.9 million in handling companies. In addition, we 2004. benefited from incremental volume improvements in our Jetway® passen- ger boarding bridge and ground sup- port equipment businesses. We deliv- ered 70 Halvorsen cargo loaders in 2004 and received orders from the U.S. Air Force for product enhance- ment work and 40 loaders to be deliv- ered in 2005. Revenues improved 25 percent and operating profit improved 29 percent over 2003. Cesar Silva de Azevedo (left), Assembly Technician, and Nivaldo Batista dos Santos, Offshore Technician, inspect a subsea tree for Petrobras’ Albacora Leste field. In 2004, FMC Technologies’ subsea operations in Brazil produced subsea trees, manifolds, risers and related equipment for several Petrobras projects, including Roncador. This busi- ness has supplied 227 subsea trees to the Brazilian oil industry since 1961. 9 Shareholders’ Letter
- 14. strength Financial performance The growth in adjusted income and In 2004, we continued to invest in the our disciplined capital management advancement of new technologies Our diluted earnings per share were provided a 12.3 percent after-tax upon which future growth will be $1.68 in 2004. The reported earnings return on investment, which is near based. Our technology development is for all periods presented include the the top of our industry and higher than driven by the needs of our customers expensing of employee stock options. most industrial companies. We believe and our commitment to provide them The 2004 results were impacted by a that earning high returns on the capital with the most effective solutions for number of unusual items. The that shareholders entrust to us is one their challenges. exchange of our equity interest in of our most important jobs and one MODEC International generated a gain Our high-pressure/high-temperature that will create shareholder value. of $0.52 per share. We recorded a subsea system, capable of operating non-cash loss of $0.09 per share for Investments in technology under pressures of 15,000 psi and the impairment of goodwill in our Throughout our short history as a temperatures up to 350º F, was blending and transfer product line. separate public company, FMC installed in 2004. Employment of this Technologies has grown through con- After excluding these unusual items, system on the Na Kika project in the tinuous improvement in its technology the remaining adjusted income per Gulf of Mexico helped Shell and BP and teamwork with customers, which share, a non-GAAP measure (reconcil- win a distinguished achievement has translated into strong financial iation on page 100), of $1.25 per award at the 2004 Offshore Tech- performance. In all our businesses, share is comparable to historical earn- nology Conference. We have provided technology has reinforced our strong ings. It is a 21 percent improvement subsea systems for seven of the last relationships with our customers and over 2003 and represents an 18 per- eight projects that have received this cent annual growth rate since our for- led to the formation of enduring cus- prestigious award. At the 2004 confer- mation in 2001. tomer alliances. This combination of ence, developments in our riserless technology and teamwork is our most light well intervention technology Additionally, in 2004 we had unusually distinctive competitive advantage, as received a Spotlight on New low income tax expense, primarily due evidenced by our leading market Technology award. to favorable resolutions of a tax dis- positions in many of the industries in pute and foreign tax audits completed which we compete. during the year, which nearly offset the loss on the Sonatrach project. Our focus on working capital manage- ment limited the amount of capital required to support our growing busi- nesses. Working capital, excluding cash and debt, increased only 11 percent during 2004. Working cap- ital discipline, in combination with low capital expenditures and the proceeds from the MODEC International conver- sion, allowed the Company to gener- ate free cash flow sufficient to reduce net debt by $154 million. This brought our net debt to $39 million at year-end 2004. We also continue to benefit from low-cost debt, having locked in a 2.9 percent interest rate through mid- 2008 for up to $150 million in debt. FMC Technologies Inc. Annual Report 2004 10
- 15. We also continued development of an Our joint venture company, GTL poultry. Additionally, we developed all-electric subsea production system. MicroSystems, is moving forward with technologies to enable the sterilization A total of 16 production systems with commercial development of gas-to-liq- of food packaged in paper containers. electric choke valves operated prob- uids (GTL) technology. When it is com- Within our airport equipment busi- lem-free in the North Sea throughout mercially developed, our objective is to nesses, we focused on development 2004. The all-electric subsea system enable small volumes of stranded gas of our new RampSnake® product, will use simpler controls than conven- reserves to be converted into liquid which is an articulated belt loader for tional systems, which rely on form with a small plant that can be narrow-body aircraft. It is designed to hydraulics. located on offshore platforms. promote safer working conditions for We advanced our subsea separation We have made a number of technolo- baggage handlers and better produc- and processing technologies and were gy advancements in our measurement tivity for airlines. engaged to perform studies for business, particularly with multiphase All of these technology advances are Petrobras and Statoil designed to metering. Multiphase metering is set- being achieved by working with our demonstrate our separation technolo- ting new standards for operational effi- customers to understand their chal- gy for subsea applications. We have ciency, in both surface and subsea lenges and develop systems and been conducting independent environments. products to meet those challenges. research and development activities in In our FoodTech business, we contin- subsea processing technology and ue to improve the efficiency of our cit- acquired controlling interest in CDS rus extractors, increasing yield and Engineering for its state-of-the-art value for our customers. In 2004, we separation technology in 2003. We introduced a new, more accurate por- believe that subsea processing repre- Our safety tioner for our chicken processing cus- sents a long-term growth opportunity tomers that uses 3-D optical technolo- record is among for us. gy and high-pressure waterjets to cut the best in the industry. FMC Technologies’ food pro- cessing solutions include the M-fryer, the first of a new gen- eration of immersion fryers engineered to meet the needs of global convenience food processors. The series of fry- Total Recordable Injuries and Illnesses Lost Workday Injuries and Illnesses ers is designed to produce uni- Per 100 Full-Time Workers Per 100 Full-Time Workers form quality, shorter prepara- 2.5 10 tion times and enhanced food safety. Manufacturing 2.0 8 Manufacturing Industry Industry 1.5 6 Oil and Gas Oil and Gas 6.8 1.6 Industry Industry 1.0 4 4.4 1.2 FMC 0.5 FMC 2 Technologies Technologies 0.14 0.79 0.0 0 2003 Average people 2004 2003 Average 2004 Source: U.S. Bureau of Labor Statistics, FMC Technologies 11 Shareholders’ Letter
- 16. By partnering Enfield projects; Customer alliances with customers, CNR’s Baobab proj- A cornerstone of our strategy has we are able to ect; Total’s Rosa proj- been and continues to be developing develop innovative ect; Kerr-McGee’s Red close working relationships with our solutions to the most Hawk and Gunnison proj- customers in all of our businesses. In significant problems they ects; Statoil’s Norne and our Energy Production Systems busi- face. Our subsea engineers work Tampen Area projects; and Norsk ness, these relationships have taken alongside our customers’ engineers. Hydro’s Ormen Lange project repre- the form of alliances, frame agree- By deeply immersing ourselves in our sent some of the current projects ments and other types of partnerships customers’ businesses, we are able to where we are solving our customer’s on a regional or global basis. We provide them the reliability, practicality technical challenges on a day-to-day believe that we have more of these and economy they value. BP’s basis. At the same time, our alliances types of arrangements with key cus- Thunder Horse, Atlantis and Greater and frame agreements enable us to tomers – such as BP, Shell, Kerr- Plutonio projects; Shell’s Na Kika, invest in technologies that our cus- McGee, Statoil, Woodside Energy and Coulomb and Llano projects; tomers need. By working collabora- Norsk Hydro – than any other compa- Woodside Energy’s Chinguetti and tively with our customers, we are able ny in our market sector. We have also to assist them in getting the most out formed collaborative alliances with oil- of their oilfields while we strengthen field service companies in our Energy our own market positions and grow Processing Systems business, air our businesses. cargo companies in our Airport Systems business and citrus proces- sors in our FoodTech business. João Barão (left) and Ricardina Benjamim, at FMC Technologies’ Angola facilities, observe assembly of subsea equipment for offshore West Africa projects. In 2004, we signed subsea system con- tracts for BP’s Greater Plutonio, Total’s Rosa and Woodside Energy’s Chinguetti projects in this region. tomorrow FMC Technologies Inc. Annual Report 2004 12
- 17. results People and principles Outlook for 2005 Based on our solid backlog position and business activity level entering the Our success is ultimately determined We look forward to a year of solid per- year, combined with the dedication of by our people. They create technology formance in 2005. Our energy busi- a talented team of employees, we that meets customer needs and make nesses, driven by the secular growth believe that 2005 will be another good our alliances work. We believe that of subsea and the continuing high oil- year for FMC Technologies. nothing is more important than provid- field activity levels, should have a ing them with a safe place to work. strong year. The Airport Systems busi- Our safety record is among the best in ness should see some growth as our Sincerely, new RampSnake® product debuts our industries. We also believe that our commitment to ethics is essential and equipment replacements increase. to maintaining the integrity of our com- FoodTech’s performance will be ham- pany with employees, customers, pered by the impact of the 2004 investors and suppliers. This commit- Florida hurricanes on the citrus crop. Joseph H. Netherland ment guides our business dealings, Chairman, President and Chief One of our challenges for the future is corporate governance practices and Executive Officer to find a way to utilize our excess cash compliance with regulations such as February 21, 2005 to increase shareholder value. We the Sarbanes-Oxley legislation. have recently announced a stock We are fortunate to have the services repurchase program of up to two mil- of a capable and experienced man- lion shares. Additionally, we continue agement team and Board of Directors. to look for acquisitions that comple- In 2004, our management depth was ment and build on our current busi- further strengthened with four key nesses. We want businesses with executive appointments – Peter technology that provides unique Kinnear to Executive Vice President, advantages and that are available at a Charlie Cannon to Senior Vice reasonable cost. If we are unable to President and John Gremp and Tore find these kinds of acquisition oppor- Halvorsen to Vice President. All four tunities, we plan to return the capital are proven leaders, with distinguished to shareholders through further stock company and industry backgrounds. repurchases or dividends. We said farewell to Dolph Bridgewater, who retired from our Board in 2004. Although his contribution will be missed, we will continue to benefit from the efforts of our other excep- tionally qualified Board members. Our success is ultimately determined by our people, such as this techni- cian at our facilities in Kongsberg, Norway. They create technology that meets customer needs and make our alliances work. 13 Shareholders’ Letter
- 19. Our Businesses
- 21. energy production systems systems energy processing foodtech fmc airport systems 15 Our Businesses
- 22. deeply immersed in our Energy Production Systems customers’ world. FMC Technologies Inc. Annual Report 2004 16
- 23. Energy Production Systems designs and manufactures systems and services for customers involved in land and offshore, particularly deepwater, exploration and production of oil and gas. We have production facilities near the world’s principal off- shore oil-producing basins. Our Energy Production Systems businesses include subsea systems, floating production systems, surface production equip- ment and separation systems. Subsea systems, used in the offshore agreement also includes provision production of crude oil and natural of additional equipment for Statoil- gas, are the fastest growing part of operated fields that we have Energy Production Systems. Subsea previously supplied. Energy Production Systems’ systems are installed on the seafloor The design and manufacture of sub- revenue comprised approxi- and are used to control the flow of sea systems require a high degree of crude oil and natural gas from the mately 53 percent of FMC technical expertise and innovation. reservoir to a host processing facility, These systems are designed to with- Technologies’ total revenue such as a floating production facility, stand exposure to the extreme hydro- in 2004. a fixed platform or an onshore facility. static pressure encountered in deep- Our subsea equipment is remotely water environments as well as internal controlled by the host processing pressures of 15,000 pounds or more facility. per square inch and temperatures in 53% In 2004, we signed agreements to excess of 300º F. The foundation of supply subsea production systems for this business is our technology and BP’s Greater Plutonio, Total’s Rosa engineering expertise. and Woodside Energy’s Chinguetti The development of our integrated projects, offshore West Africa; subsea systems usually includes initial Petrobras’ Roncador project, offshore engineering design studies, subsea Brazil; Statoil’s Åsgard-Q, Norne trees, control systems, manifolds, Satellites and Tampen area projects umbilicals, seabed template systems, in the North Sea; and Kerr-McGee’s flowline connection and tie-in systems, Gunnison, Merganser and installation and workover tools, and Ticonderoga projects in the Gulf of subsea wellheads. In order to provide Mexico. We continued to supply these systems and services, we have equipment and services for a number highly-developed system and detail of projects for these and other cus- engineering, project management and tomers in all the major offshore global procurement, manufacturing, producing areas. assembly and testing capabilities. We also signed an extension of our Further, we provide service technicians existing subsea service agreement and tools for equipment installation with Statoil to provide technical servic- and field support for commissioning, es and subsea equipment for an addi- intervention and maintenance of our tional two years, with an option for subsea developments throughout the two more years beyond that. This life of an oilfield. Håkon Sivertsen (foreground) and agreement comprises technical servic- Jarle Rimork, technicians in FMC es and equipment related to comple- Technologies’ workshop in tion, workover, installation, mainte- Kongsberg, Norway, check subsea nance and other activities associated trees prior to delivery to customers’ with subsea field development. The North Sea projects. 17 Energy Production Systems
- 24. We are a global supplier of marine ter- In 2003, we acquired 55 percent Marco Polo in the Gulf of Mexico, Anadarko Petroleum’s first deep- minals, turret and mooring systems, ownership in CDS Engineering with a water development project, riser systems, swivel systems and commitment to purchase the remain- employs one of the world’s deep- control and service buoys for a broad ing 45 percent in 2009. CDS est TLP installations, at approxi- range of marine and subsea projects. Engineering’s separation technology mately 4,300 feet of water depth. These products and services are part modifies conventional separation tech- FMC Technologies supplied sub- of our customers’ overall floating pro- nologies by allowing the flow to move sea trees, production risers, sub- duction system, which produces, in a spiral, spinning motion. This caus- sea wellhead systems and asso- processes, stores, and offloads crude es the elements of the flow stream to ciated equipment for the project. oil from offshore fields. separate more efficiently. These sys- tems are currently capable of operat- Our floating systems business was ing on surface systems onshore or off- chosen in 2004 to design and supply shore facilities. We believe this tech- a disconnectable turret mooring sys- nology has the potential to advance tem for Santos’ Mutineer-Exeter proj- our subsea processing capabilities in ect, offshore Australia. This business the future. also made progress with the offshore oil loading project in Algeria for We are encouraged about the Sonatrach-TRC, the Algerian Oil and prospects of developing subsea sepa- Gas Company, although severe ration processing technologies through storms in November delayed comple- our CDS subsidiary. Subsea process- tion of the pipeline installation phase of ing is an emerging technology in the the project. industry, which we believe offers con- siderable benefits to the oil and gas In addition to our subsea systems that producer, enabling a more rapid and control the flow of oil and natural gas efficient approach to separation. First, from deepwater locations, we provide it can significantly reduce the capital a full range of surface wellheads and investment required for floating vessels trees for both standard and critical or platforms, since the integration of service applications. Surface wellhead processing capabilities will not be equipment is used to support the cas- required. Also, if separation is per- ing and tubing strings in a well and to formed on the seabed, the hydrostatic contain the well pressure. Surface pressure of the fluid going from the trees are used to control and regulate seabed to the surface is reduced, the flow from the well. Our surface allowing the well to flow more efficient- products and systems are used world- ly, accelerating production and wide on both land and offshore plat- enabling higher recoveries from the forms and can be used in difficult cli- subsea reservoir. matic conditions, such as Arctic cold or intense heat. We support our cus- tomers by providing leading engineer- ing, manufacturing, field installation support and aftermarket services. FMC Technologies Inc. Annual Report 2004 18
- 25. In 2003, we also formed a joint ven- ture company, GTL MicroSystems, with Accentus plc, a subsidiary of AEA Technology plc, for the commercial development of gas-to-liquids (GTL) technology, specifically addressing the problem of associated gas production in remote offshore oil fields. A signifi- cant portion of the world’s natural gas exists in small, stranded reserves or is associated with oil production. These reserves are difficult to exploit eco- nomically using current technology. However, we believe a new technology will allow commercial extraction of gas reserves at lower capital costs than those of traditional, large-scale plants, and the technology is designed to enable the plants to be located on floating production facilities. With our integrated systems for sub- sea production, we have pursued alliances with oil and gas companies that are actively engaged in the sub- sea development of crude oil and nat- ural gas. Development of subsea fields, particularly in deepwater envi- ronments, involves substantial capital investments by our customers. We believe that our customers have sought the security of alliances with us to ensure timely and cost-effective delivery of subsea and other energy- related systems that provide an inte- grated solution to their needs. Our alliances establish important ongoing relationships with our customers. Our subsea engineers work alongside our customers’ engineers in our plants and on their rigs. 19 Energy Production Systems
- 26. Offshore oil and gas industry forecast to spend $1.4 trillion over next 10 years production The study projects that, unlike oil, offshore gas output will continue Offshore oil and gas is forecast to to rise from both shallow and deep waters. In total, a growth of grow from 39 million barrels of oil equivalent per day (BOE/d) in 40 percent is expected by 2015. Douglas-Westwood projects that 2004 to 55 million BOE/d by 2015, according to a study by around 12 percent will be coming from deepwater, compared to Douglas-Westwood, noted energy industry consultants. From pro- 7 percent in 2004. By 2015, offshore gas is expected to provide viding about 34 percent of total global production in 2004, 34 percent of world demand. A large increase in supply is expect- Douglas-Westwood projects offshore oil will reach 39 percent by ed from the Middle East. The study forecasts that offshore gas’ 2015. share of the energy mix will rise from 33 percent in 2004 to The study also forecasts that the complete costs to explore for, 40 percent in 2015. It anticipates that this trend will continue develop and operate offshore oil and gas fields, currently some driving an unprecedented growth in expenditure in gas develop- $100 billion, will total more than $1.4 trillion over the next 10 ments, including pipelines, liquefied natural gas (LNG) plants, gas- years. During this time, it is estimated that 200 billion barrels of oil to-liquid processing plants, tanker transport and loading and equivalent will be produced. unloading terminals. According to the study, an important trend is the move to deep waters. Around 25 percent of offshore oil is anticipated to come from water depths beyond 1,600 feet (about 500 meters) in 2015, compared to 10 percent in 2004. Most significantly, after 2010 all offshore oil production growth is expected to be from deep Offshore Oil and Gas Production waters, compensating for declining output from shallow waters. 2004 – 2015 Another major change noted by the study is the shift in regional activity. According to the study, offshore oil production began in Millions Billions North America in 1938. Since then, growth from all the regions BOE/d $ has continued, most rapidly from Western Europe – mainly the 1400 60 North Sea. In 2004, Western Europe was providing 21 percent of 1200 all offshore oil, but is forecast to be providing only 11 percent by 50 2015. The Middle East, due to its larger reserves, and Africa and 55 1000 40 Latin America, due to their deep waters, are forecast by the study 800 to contribute the largest shares in 2015, with 21 percent, 39 30 19 percent and 18 percent, respectively. 600 20 400 10 200 0 0 2004 2015 Production Costs (Photos left and center) Arild Nymo, of FMC Technologies, and Carsten Scheby, of Shell, review systems specifications for the Ormen Lange project in Kongsberg, Norway. Although he is employed by Shell, which is the production phase operator for Ormen Lange, Carsten often wears Norsk Hydro’s identification while working on the project. (Photo far right) Per Foss, a technician in Kongsberg, checks connections on a subsea control module. 20 FMC Technologies Inc. Annual Report 2004
- 27. Ormen Lange – Norsk Hydro develops giant gas field With gas reserves over 14 trillion cubic feet (close to 400 billion systems for flowlines and umbilicals. An additional contract cubic meters) and development costs of $9.5 billion, the includes technical services related to installation and startup. Ormen Lange field ranks as the second largest gas field on The contract also includes an option for Norsk Hydro to the Norwegian Continental Shelf. The Ormen Lange gas order eight additional subsea trees and associated equip- reservoir covers a 135 square mile area, more than 6,000 ment as well as potential further equipment deliveries in the feet below the seafloor, approximately 600 miles northwest future. of Kristiansund, Norway. Water depths in the area vary Production from Ormen Lange is scheduled to commence between 2,800 and 3,600 feet, making Ormen Lange the in 2007 and should reach its peak by the end of the decade deepest Norwegian offshore development project to date. – supplying up to 700 billion cubic feet (20 billion standard cubic meters) of gas per year. Construction work started immediately after approval by the Norwegian authorities in April 2004. The development concept combines a subsea production facility with an onshore processing facility at Nyhamna on the northwestern coast of Norway. In addition to water depth, the Ormen Lange development faces a number of other technical challenges. In the Storegga area, where Ormen Lange is located, a major sub- sea slide occurred some 8,000 years ago. As a result, the seafloor is very uneven – with peaks that rise as much as 197 feet – and consists of both hard and soft sediments. The Ormen Lange gas field is located at the base of the Storegga slide area, some 3,000 feet below the sea’s sur- face, in an area with strong currents and extreme wave and wind conditions. The development plan calls for four subsea templates for up to 24 wells. Two 30-inch pipelines will transport gas, con- densate and water from the subsea production facilities, up the steep Storegga escarpment and through uneven subsea Norsk Hydro, Through its relationship with terrain to the onshore gas terminal at Nyhamna. The FMC Technologies is supplying subsea systems and related pipelines will travel a distance of approximately 75 miles. services for the first phase development of the Ormen Lange Ormen Lange will provide important supplies of natural gas Field in the North Sea. Our subsea production systems con- to the United Kingdom and other European markets. Norsk tract for the first phase, valued at approximately $145 million, Hydro expects the field to be a major supplier of gas for the includes eight subsea trees and associated structures, mani- next 20 to 30 years. folds and production control systems, as well as connection 21 Energy Production Systems
- 28. Enfield – Woodside Energy’s pioneering development offshore Western Australia Subsea control modules are being prepared for deliv- ery to Woodside Energy’s Enfield project, offshore Western Australia. We are providing 13 subsea trees, production controls and associated systems for Enfield, which was the first project to be supplied under our preferred supplier agreement with Woodside Energy. Enfield Enfield comprises subsea wells with flowlines back to an The Area Development Project is about 25 miles northwest off the North West Cape of Australia, in FPSO. The Enfield FPSO will have a double hull and a stor- water depths ranging from 1,310 to 1,805 feet (400 to 550 age capacity of approximately 900,000 barrels. It will be meters). The Enfield oil field was discovered in 1999, with equipped with a disconnectable mooring and its own recoverable oil reserves in excess of 125 million barrels. First propulsion system, giving it the ability to avoid tropical oil production from Enfield is forecast by the second half of cyclones. Gas-lift wells will be used to produce fluids and 2006, and Woodside Energy believes oil production at water injection wells will be used to dispose of produced Enfield will be a major contributor to its future growth. water, supplemented by the injection of seawater to main- tain reservoir pressure. Excess gas will be reinjected into the In January 2003, we were chosen by Woodside Energy as a reservoir. Crude oil will be stored in the FPSO's tanks and preferred supplier of subsea production systems, and Enfield periodically exported through an offloading hose to tandem was the first project to be supplied under this agreement. This moored off-take tankers. Typical export cargoes will be was the first agreement of its type in the Australian region. As about 550,000 barrels. a preferred supplier to Woodside Energy, we established an office in Perth and will undertake our work on subsea struc- Production from Enfield is expected to extend over a long tures primarily with local fabricators. period, and the facilities have been designed for 20 years of In early 2004, we began executing our agreement with operation. The FPSO is intended to remain on station for Woodside Energy to supply subsea systems and related servic- the entire design life without needing to dry dock for main- es for the Enfield project. The contract value is approximately tenance. $65 million. The agreement includes 13 subsea trees, produc- tion controls and associated systems. We also will furnish tech- nical services related to installation and startup. FMC Technologies Inc. Annual Report 2004 22
- 29. Greater Plutonio – BP’s reserves enhanced in Block 18, offshore Angola Eduardo Dinis and Nascimento Peterson, at FMC Technologies’ service base in Luanda, Angola, are involved in preparing subsea systems for BP’s Greater Plutonio project in Block 18, offshore West Africa. Our supply of subsea systems for Greater Plutonio will involve local content, expansion of our Angolan facilities, local employment opportunities and a technical training program. BP’ s involvement with Angola dates back to the 1970s. FMC Technologies’ scope of supply for the entire Greater During the 1990s, BP made substantial investments in Plutonio project is expected to include 45 subsea trees and Angola’s offshore oil, and these investments are growing in associated structures, manifolds and production control sys- importance. BP has interests in six blocks offshore Angola tems, as well as connection systems for flowlines and umbil- and is the operator of two. One of those is Block 18, in icals. We also will supply technical services related to instal- which six fields will be the first development and the first lation and startup. The supply of equipment and services BP-operated project offshore Angola. The fields, Galio, will be supported by our operations in Angola. Deliveries, Cromio, Paladio, Plutonio, Cobalto and Platina, collectively which began in early 2005, will be completed over a multi- known as Greater Plutonio, are located in water depths of year period. Our supply of subsea systems for the Greater 3,900 to 4,900 feet (1,200 to 1,500 meters). Plutonio project will involve local content, an expansion of our Angolan facilities, local employment opportunities and a In 2004, Sociedade Nacional de Combustíveis de Angola technical training program. (Sonangol), Angola’s state-owned oil company, authorized BP to proceed with the awarding of major contracts for the Block 18 has an area of approximately 1,930 square miles. development of Greater Plutonio in Block 18, and we were The Greater Plutonio development will consist of a single chosen to supply subsea systems and related services for the spread-moored FPSO vessel linked by risers to a network of project. The value of the project to FMC Technologies is subsea flowlines, manifolds and wells. BP estimates that its approximately $382 million in revenue. net production from Angola will rise from 50,000 barrels of oil per day in 2004 to approximately 250,000 barrels per day by 2007. 23 Energy Production Systems
- 30. FMC Technologies subsea systems installed in world-record water depth In 2004, our subsea systems were installed on the Shell- standardized processes, installation times for the tree system operated Coulomb project, in the world-record water depth were reduced by 50 percent, and tree delivery times have for a subsea completion of 7,570 feet. been reduced by as much as 60 percent. Capital expendi- ture reductions of more than 40 percent have been realized. Coulomb The project is a two-well subsea The standard system design has proved itself with numerous tieback to the Na Kika host facility, in the Mississippi Canyon Shell projects in the Gulf of Mexico. The Coulomb project area of the ultra-deepwater Gulf of Mexico. Petrobras is a utilizes the standard vertical subsea tree completion system partner in one of the two wells. FMC Technologies also sup- developed through the alliance. plied the subsea systems for the Na Kika project, which is co-owned by Shell and BP. “The subsea tree for the Coulomb project was one of 47 manufactured last year in our Houston facility, which focus- In 1996, Shell and FMC Technologies formed a subsea es on serving the Gulf of Mexico,” said Peter D. Kinnear, alliance for the development of projects within Shell’s deep- Executive Vice President. “This milestone was made possible water portfolio. The alliance was founded on the concept of through our subsea alliance and close working relationship engineering standardized products that could be integrated with Shell.” into a wide variety of systems used to develop multi-well subsea projects. Following implementation of the alliance’s FMC Technologies Inc. Annual Report 2004 24
- 31. Red Hawk – Kerr-McGee provides deepest application of Enhanced Horizontal Tree technology Kerr-McGee’s Red Hawk field was Since the first EHXT was installed, tree installation time has developed using new technologies – the world’s first cell been reduced by one and one-half days per tree, resulting Spar and the second permanent use of synthetic moorings in significant project savings. The EHXT was first used at in the Gulf of Mexico. This innovative Spar, which is the Kerr-McGee’s Nansen and Boomvang fields in the Gulf of third generation of Spar technology, reduces the reserve Mexico. In addition to Red Hawk, Nansen and Boomvang, threshold required for an economical development in deep FMC Technologies has supplied equipment and services for waters. Kerr-McGee’s Neptune and Gunnison projects. Our current work with Kerr-McGee includes their Merganser, Nile and The Red Hawk project is the deepest application to date Ticonderoga projects. (5,342 feet, or approximately 1,629 meters) using FMC Technologies’ Enhanced Horizontal Tree (EHXT) technology. Red Hawk also is an example of how important strong cus- tomer relations and standardization are to achieving improved reliability and reduced project cycle time. Our scope of work for Red Hawk included two EHXTs, rated to 10,000 psi, associated equipment and materials, and sys- tem integration testing, offshore installation support and technical assistance. A number of innovative techniques were employed that enabled Kerr-McGee to lower installa- tion costs. Additionally, batch setting of both trees con- tributed to reducing the overall installation costs by requir- ing only one trip with the drilling riser for completion oper- ations. Also, new jumper fabrication techniques permitted more equipment to be transported and installed from a single installation vessel. These fabrication methods also saved ves- sel load-out and trip time from the shore base. A new-generation hydraulic running tool that is smaller and lighter than previous models was used for the first time. When combined with the overall jumper assembly, this tool helped reduce weight, enabling Kerr-McGee to lift and install the jumper assemblies from a smaller, lower-cost installation vessel. Another cost saving came from equipment standardization on other Kerr-McGee projects. This enabled us to preorder long-lead raw material and reduce the lead times and costs. In 2004, FMC Technologies set a world depth record for a FMC Technologies has supplied a number of enhanced hori- subsea completion with installation of our subsea systems zontal subsea trees for Kerr-McGee’s deepwater projects in on the Shell-operated Coulomb project in the Gulf of the Gulf of Mexico and developed standardization methods Mexico. The water depth for this completion was 7,570 feet, that save time and money. These projects include Red which was almost 400 feet deeper than the previous record Hawk, which employs the world’s first cell spar, Gunnison, holder. Neptune, Nansen and Boomvang. 25 Energy Production Systems
- 32. Roncador – Petrobras’ record-setting development prepares for second phase production The Roncador Field was dis- covered in 1996 at water depths ranging from 4,900 to 6,600 feet (1,500 to 2,000 meters) in the northern part of the Campos Basin, approximately 80 miles off the coast of Brazil. The Roncador Field was a breakthrough in many respects, including employment of the world’s first drill pipe riser, subsea tree and early production riser rated for 6,600 feet. FMC Technologies and Petrobras set a world depth record with Roncador in 1999, and the first phase of this project was put on-stream in May 2000. Roncador comprises eight production and three injection wells producing to an FPSO. In 2006, the second phase of the project’s first module will start operating, bringing the total to 20 production and 10 injection wells. These wells will be connected to a new semi- submersible platform with the capacity to produce 180,000 FMC Technologies has been involved in Petrobras’ barrels of oil per day. This unit will be one of the largest in Roncador project since 1998, setting a subsea completion the world, with a total displacement of 80,000 metric tons. depth record in 1999. Our scope of supply for Roncador is Feasibility studies are being conducted for three additional broad and substantial, and in 2004 we received an order for Roncador modules. additional equipment, including manifolds such as the one in the photo below. Since our first subsea tree was supplied for Roncador, we have provided substantial support for the project. Our scope of work for Roncador has included vertical and horizontal subsea trees, manifolds, early production and drill pipe ris- ers, subsea control modules and associated equipment and services. In 2004, FMC Technologies received an order from Petrobras to supply additional subsea production equipment for Roncador, which will generate approximately $36 mil- lion in revenue. The order includes manifolds, production controls and associated equipment. Through its FMC CBV Subsea business unit, FMC Technologies has supplied 227 subsea trees to the Brazilian oil industry since 1961. With facilities in Rio de Janeiro and Macaé, FMC Technologies’ capabilities in Brazil include local engineering, project management, manufacturing, integra- tion testing, installation and customer support. FMC Technologies Inc. Annual Report 2004 26