Download to read offline
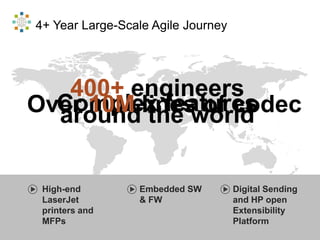
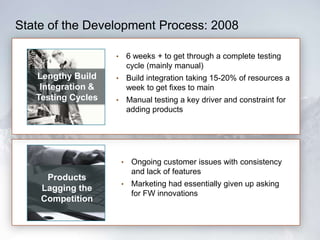
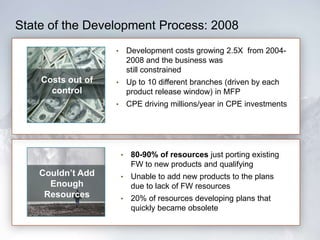
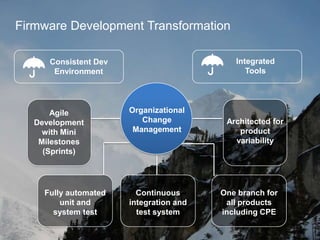
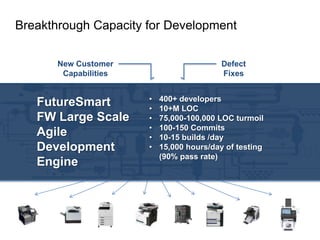
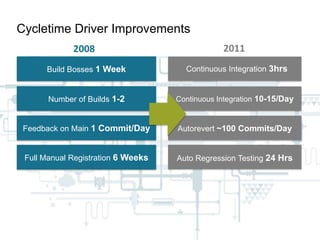
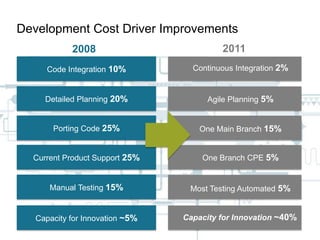
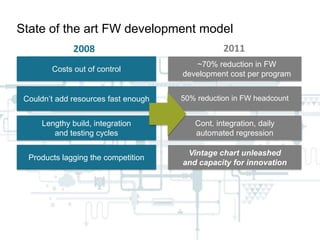


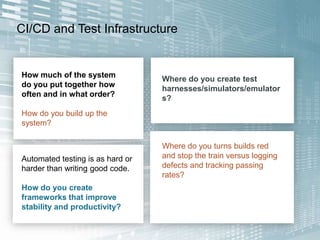
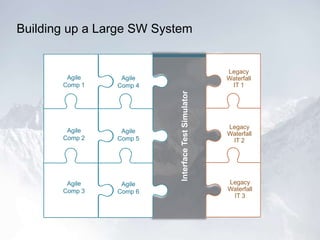
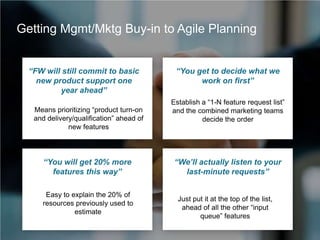


This document discusses the transformation of HP's firmware development process from 2008 to 2011 through adopting agile practices at a large scale. In 2008, the development process was struggling with long build cycles, high costs, an inability to add resources or new products. Through adopting integrated tools, consistent environments, agile development with mini milestones, automated testing, and organizational change management, the development process was transformed. Cycle times were greatly reduced, costs dropped by 70%, capacity for innovation increased from 5% to 40%, and headcount was reduced by 50% while developing more capabilities. The transformation provided a breakthrough in development capacity through establishing a large scale agile development engine.


![Getting Started with Apache Spark: Big Data Made Simple [Free Meetup]](https://cdn.slidesharecdn.com/ss_thumbnails/apachesparkgettingstarted-260203175547-8361bcc3-thumbnail.jpg?width=640&height=640&fit=bounds)


