Download to read offline
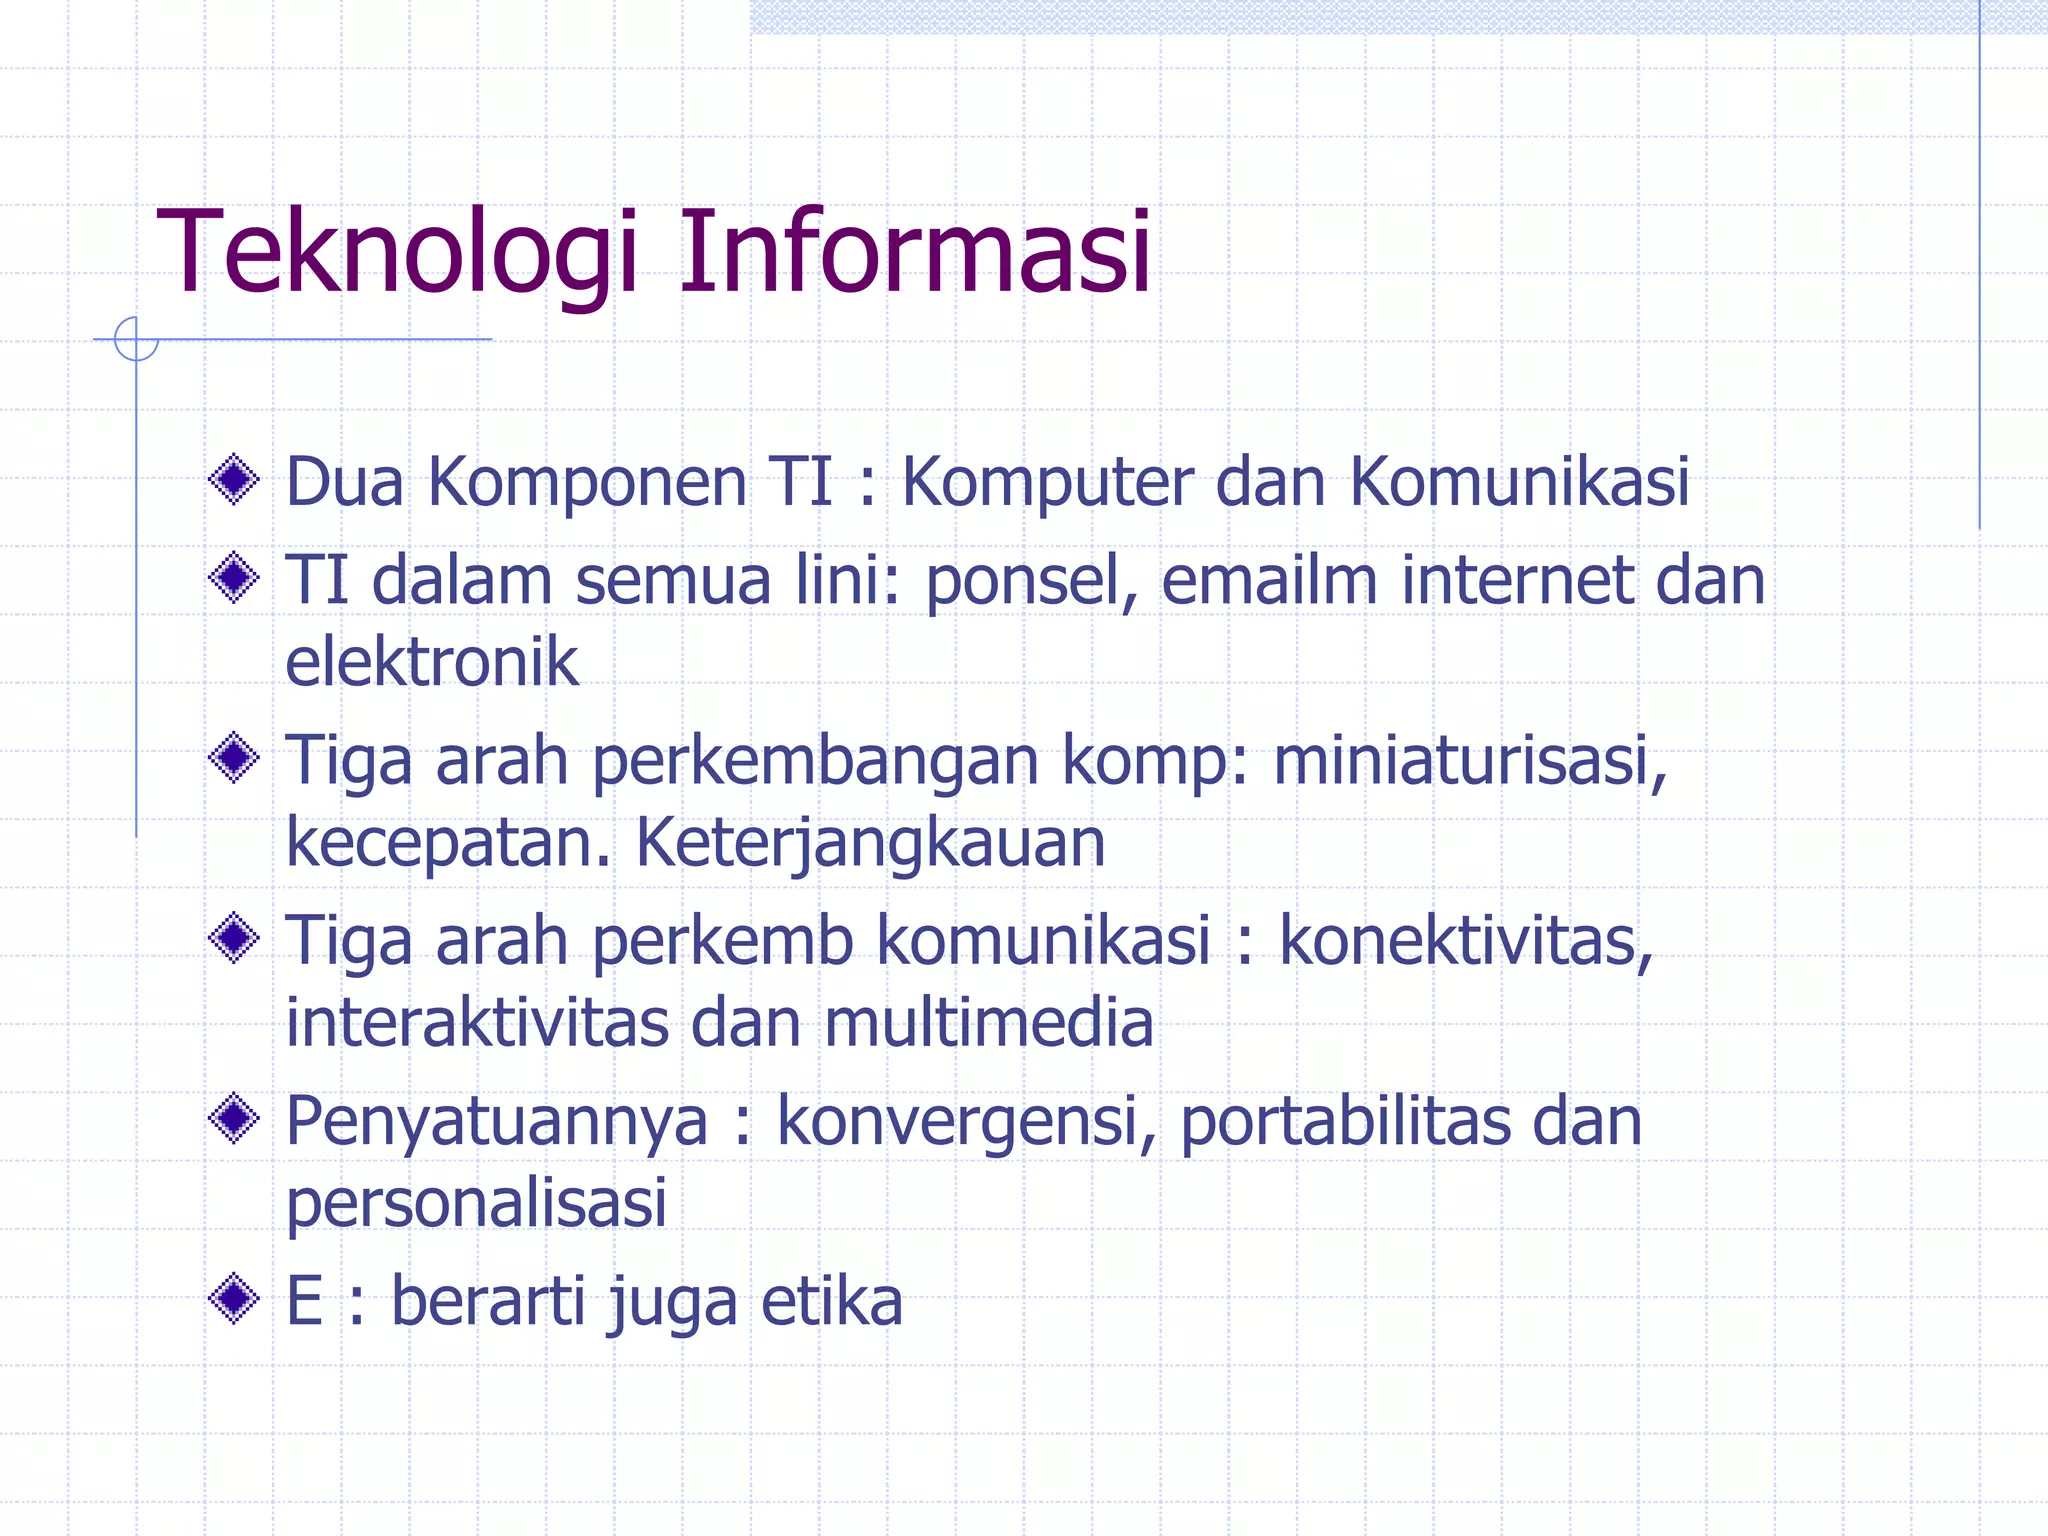
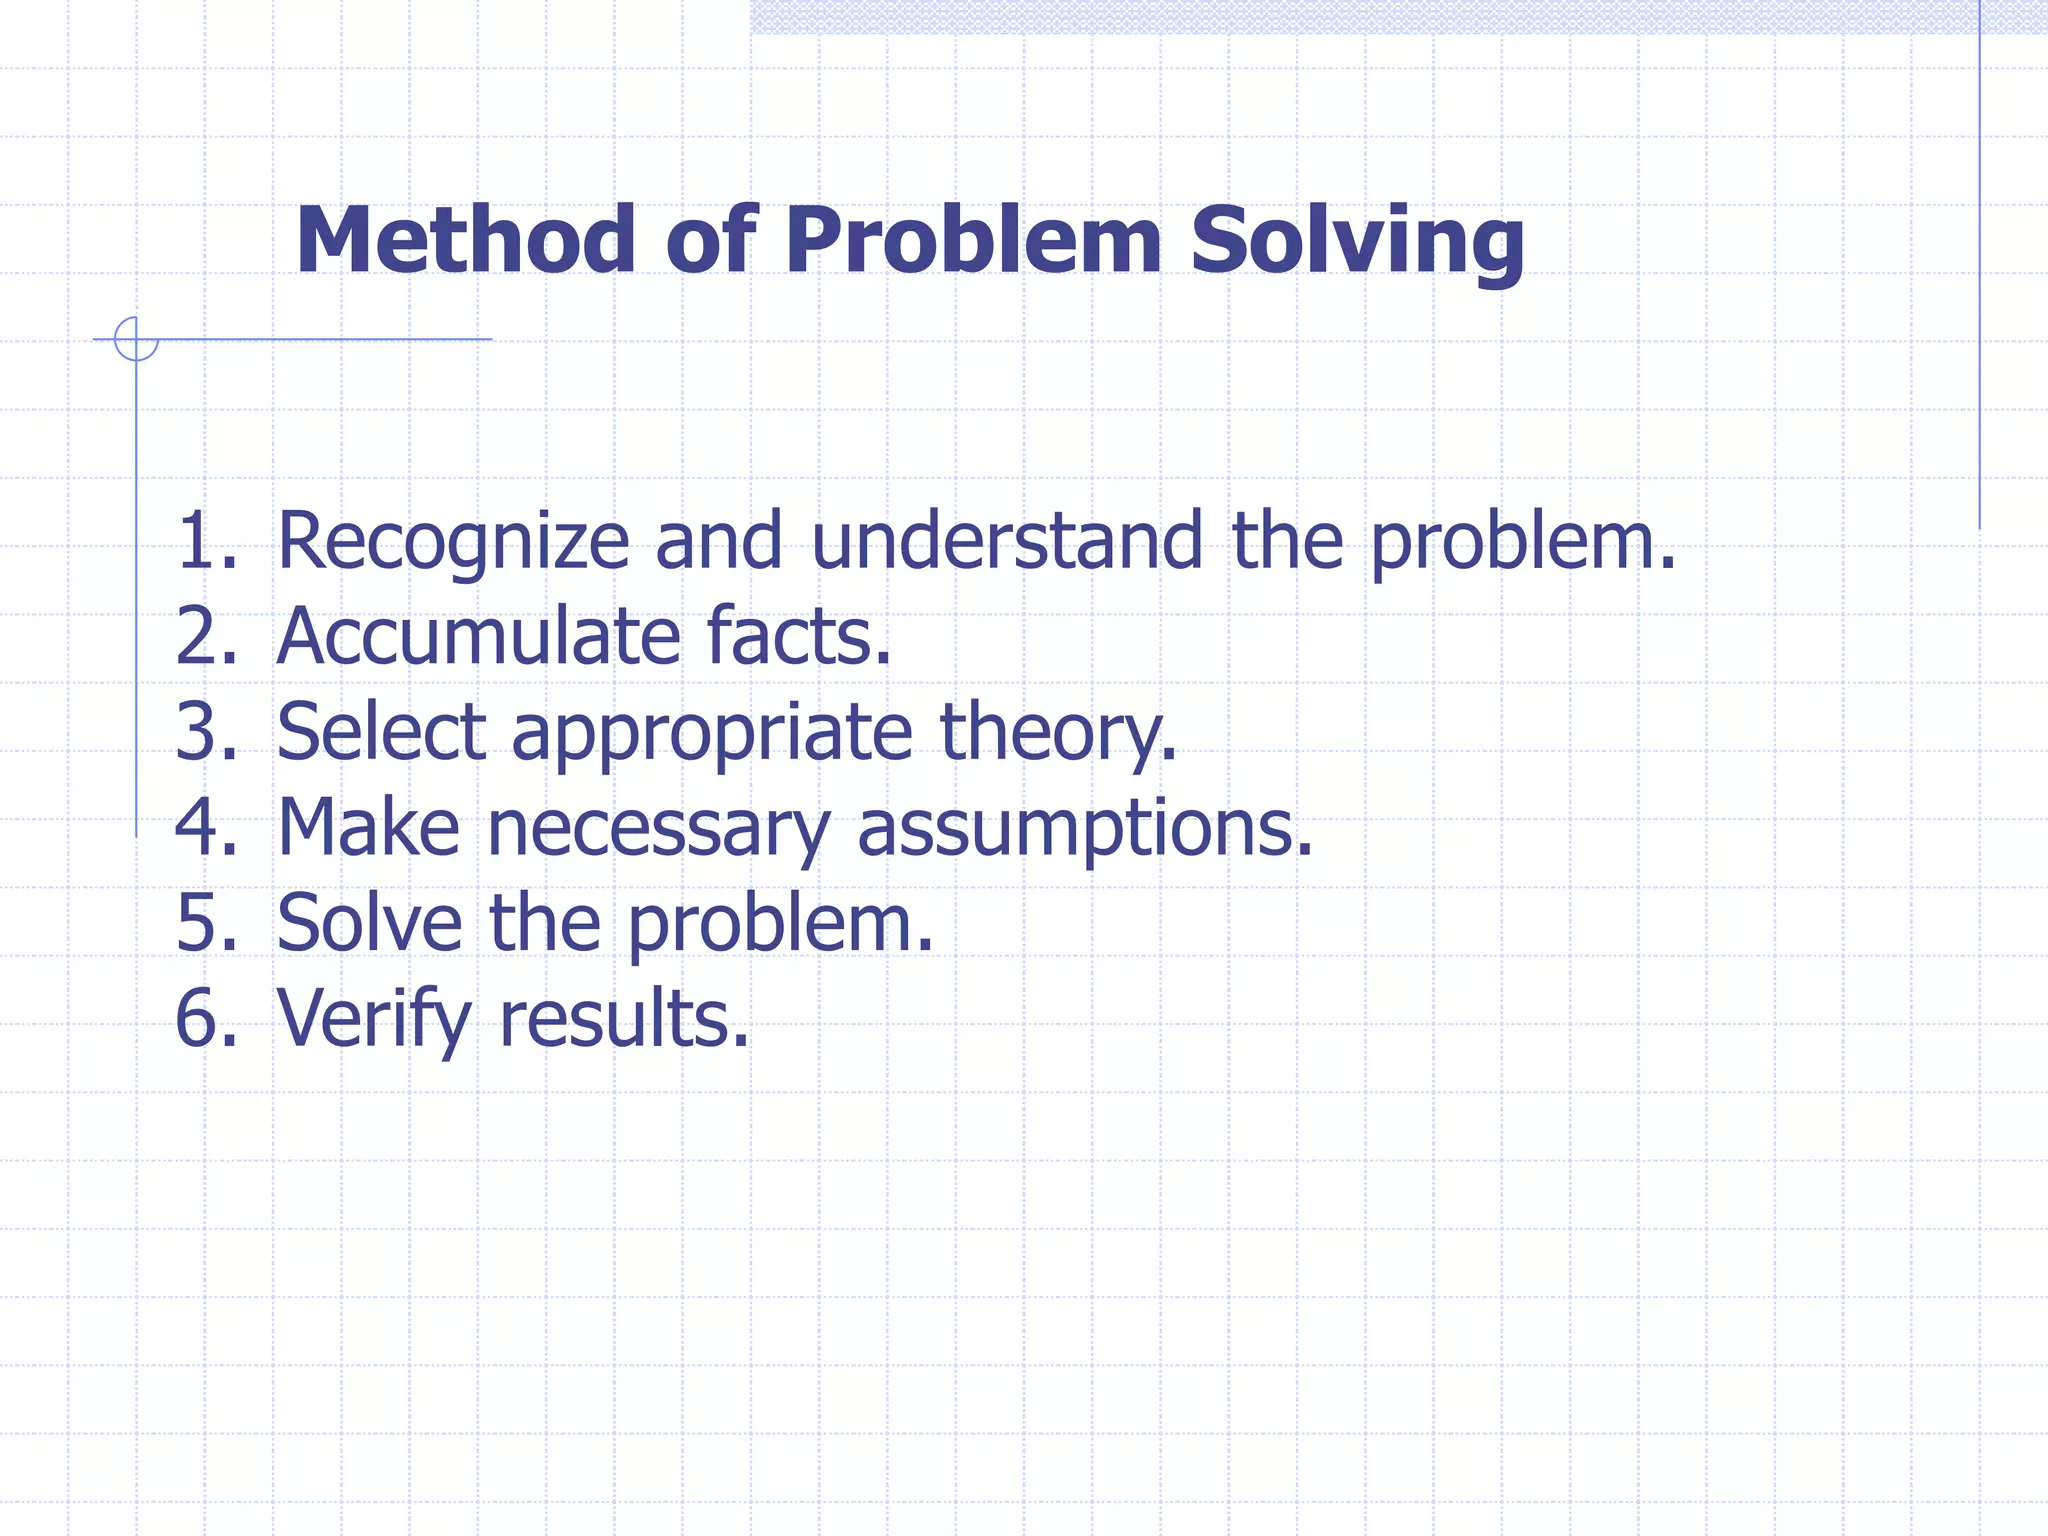
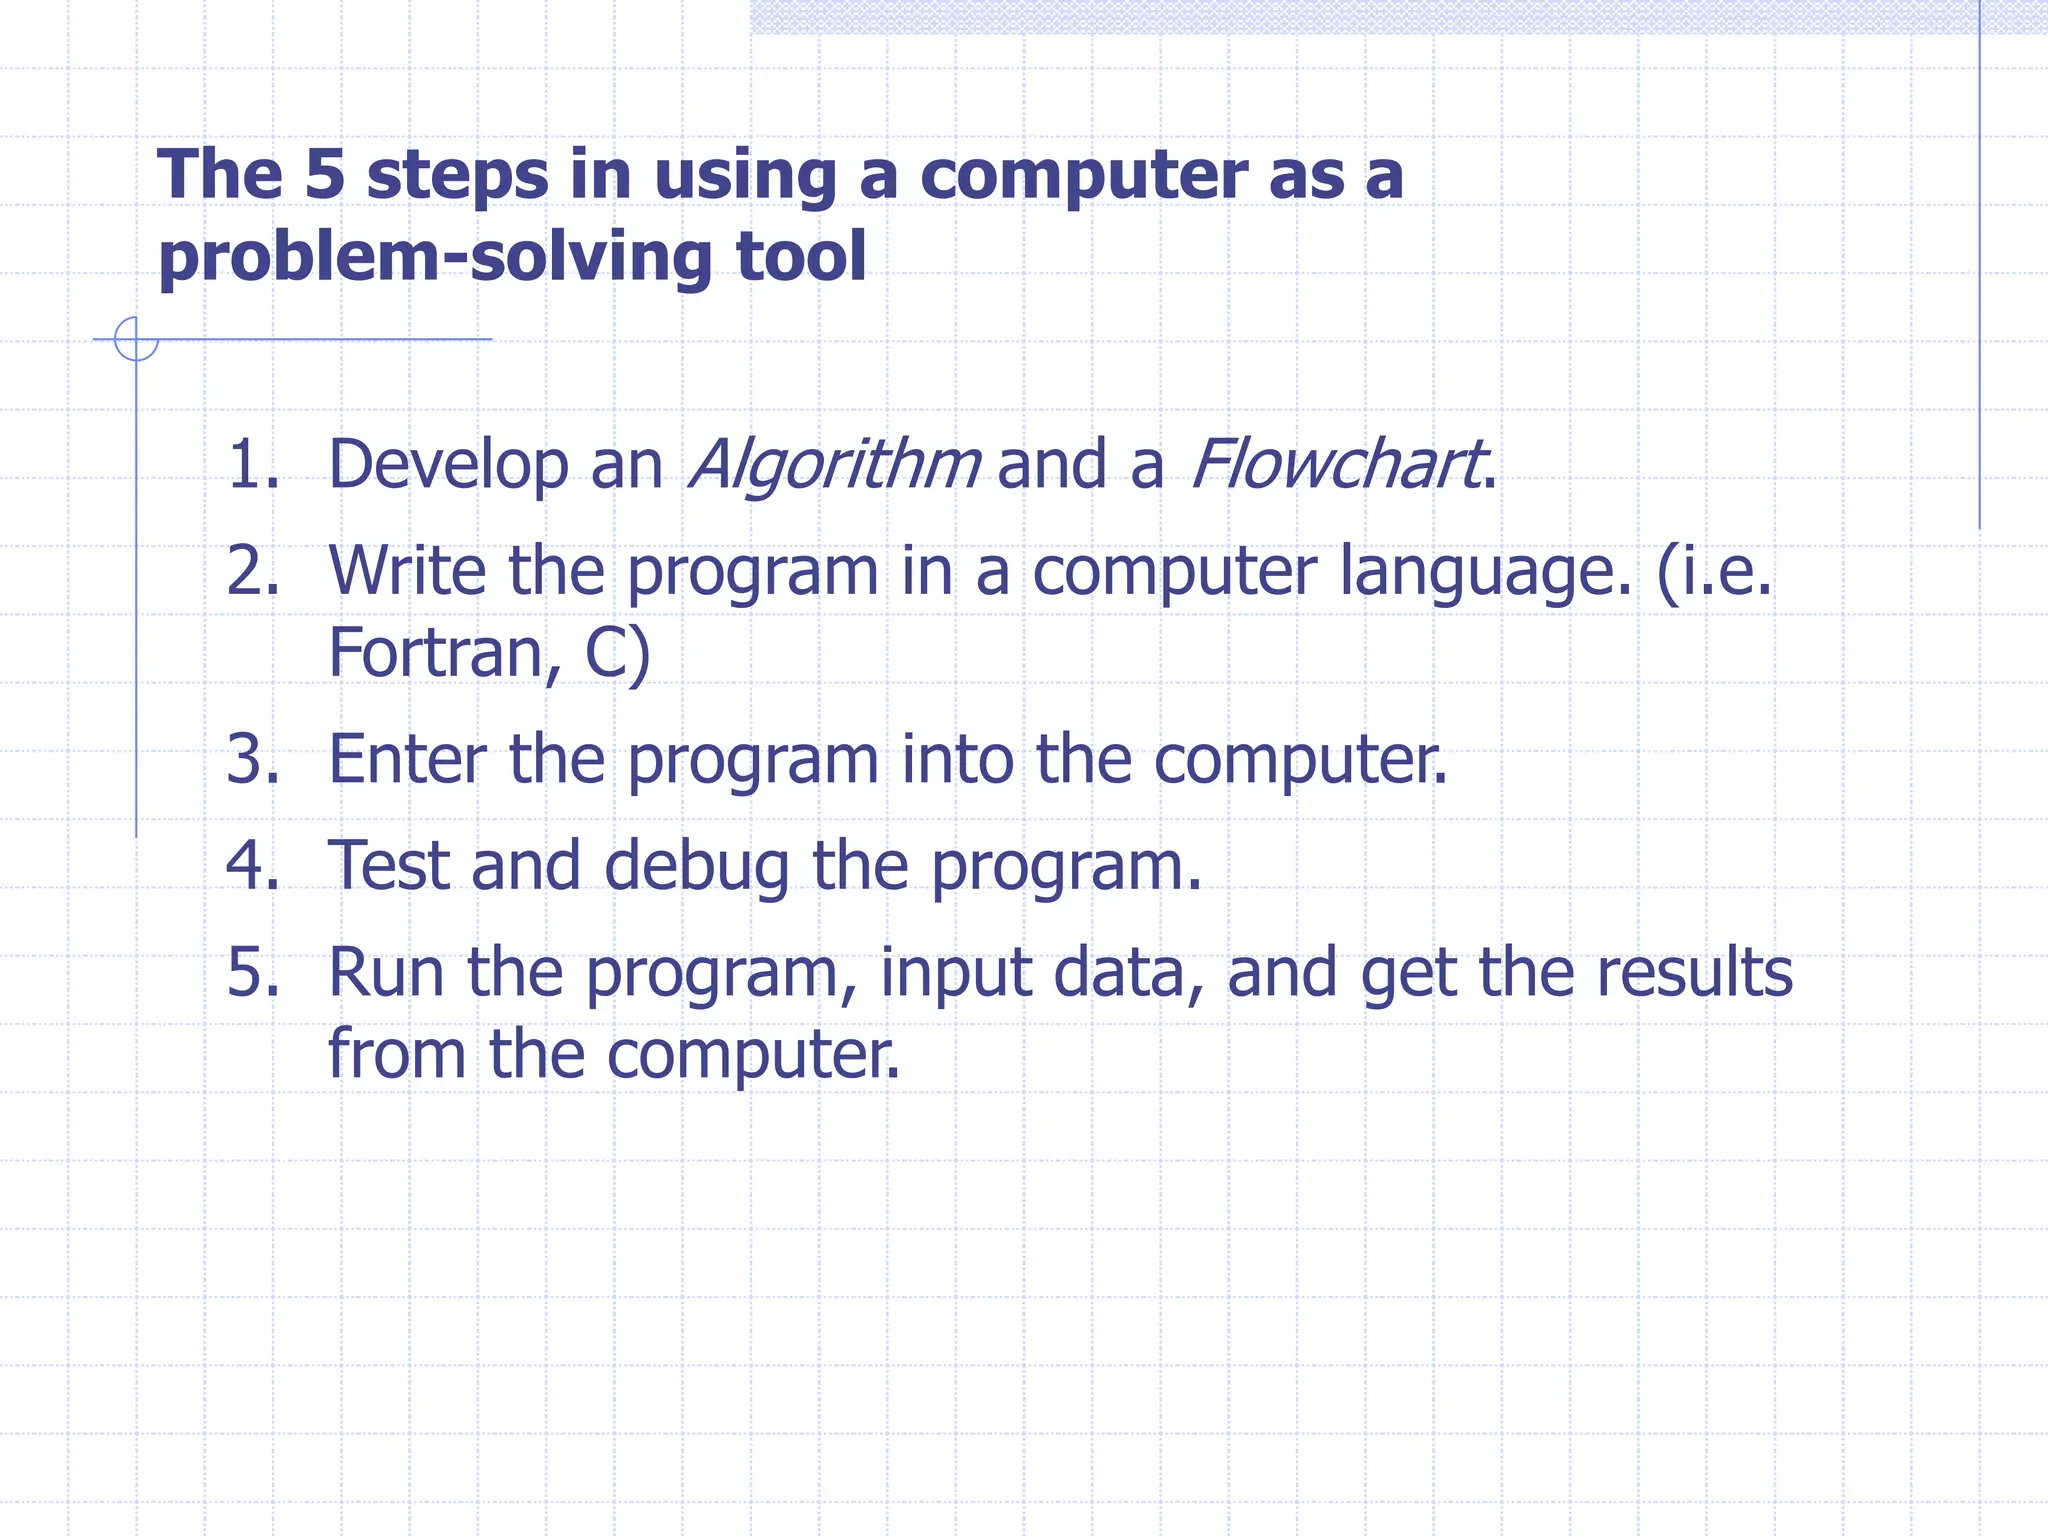
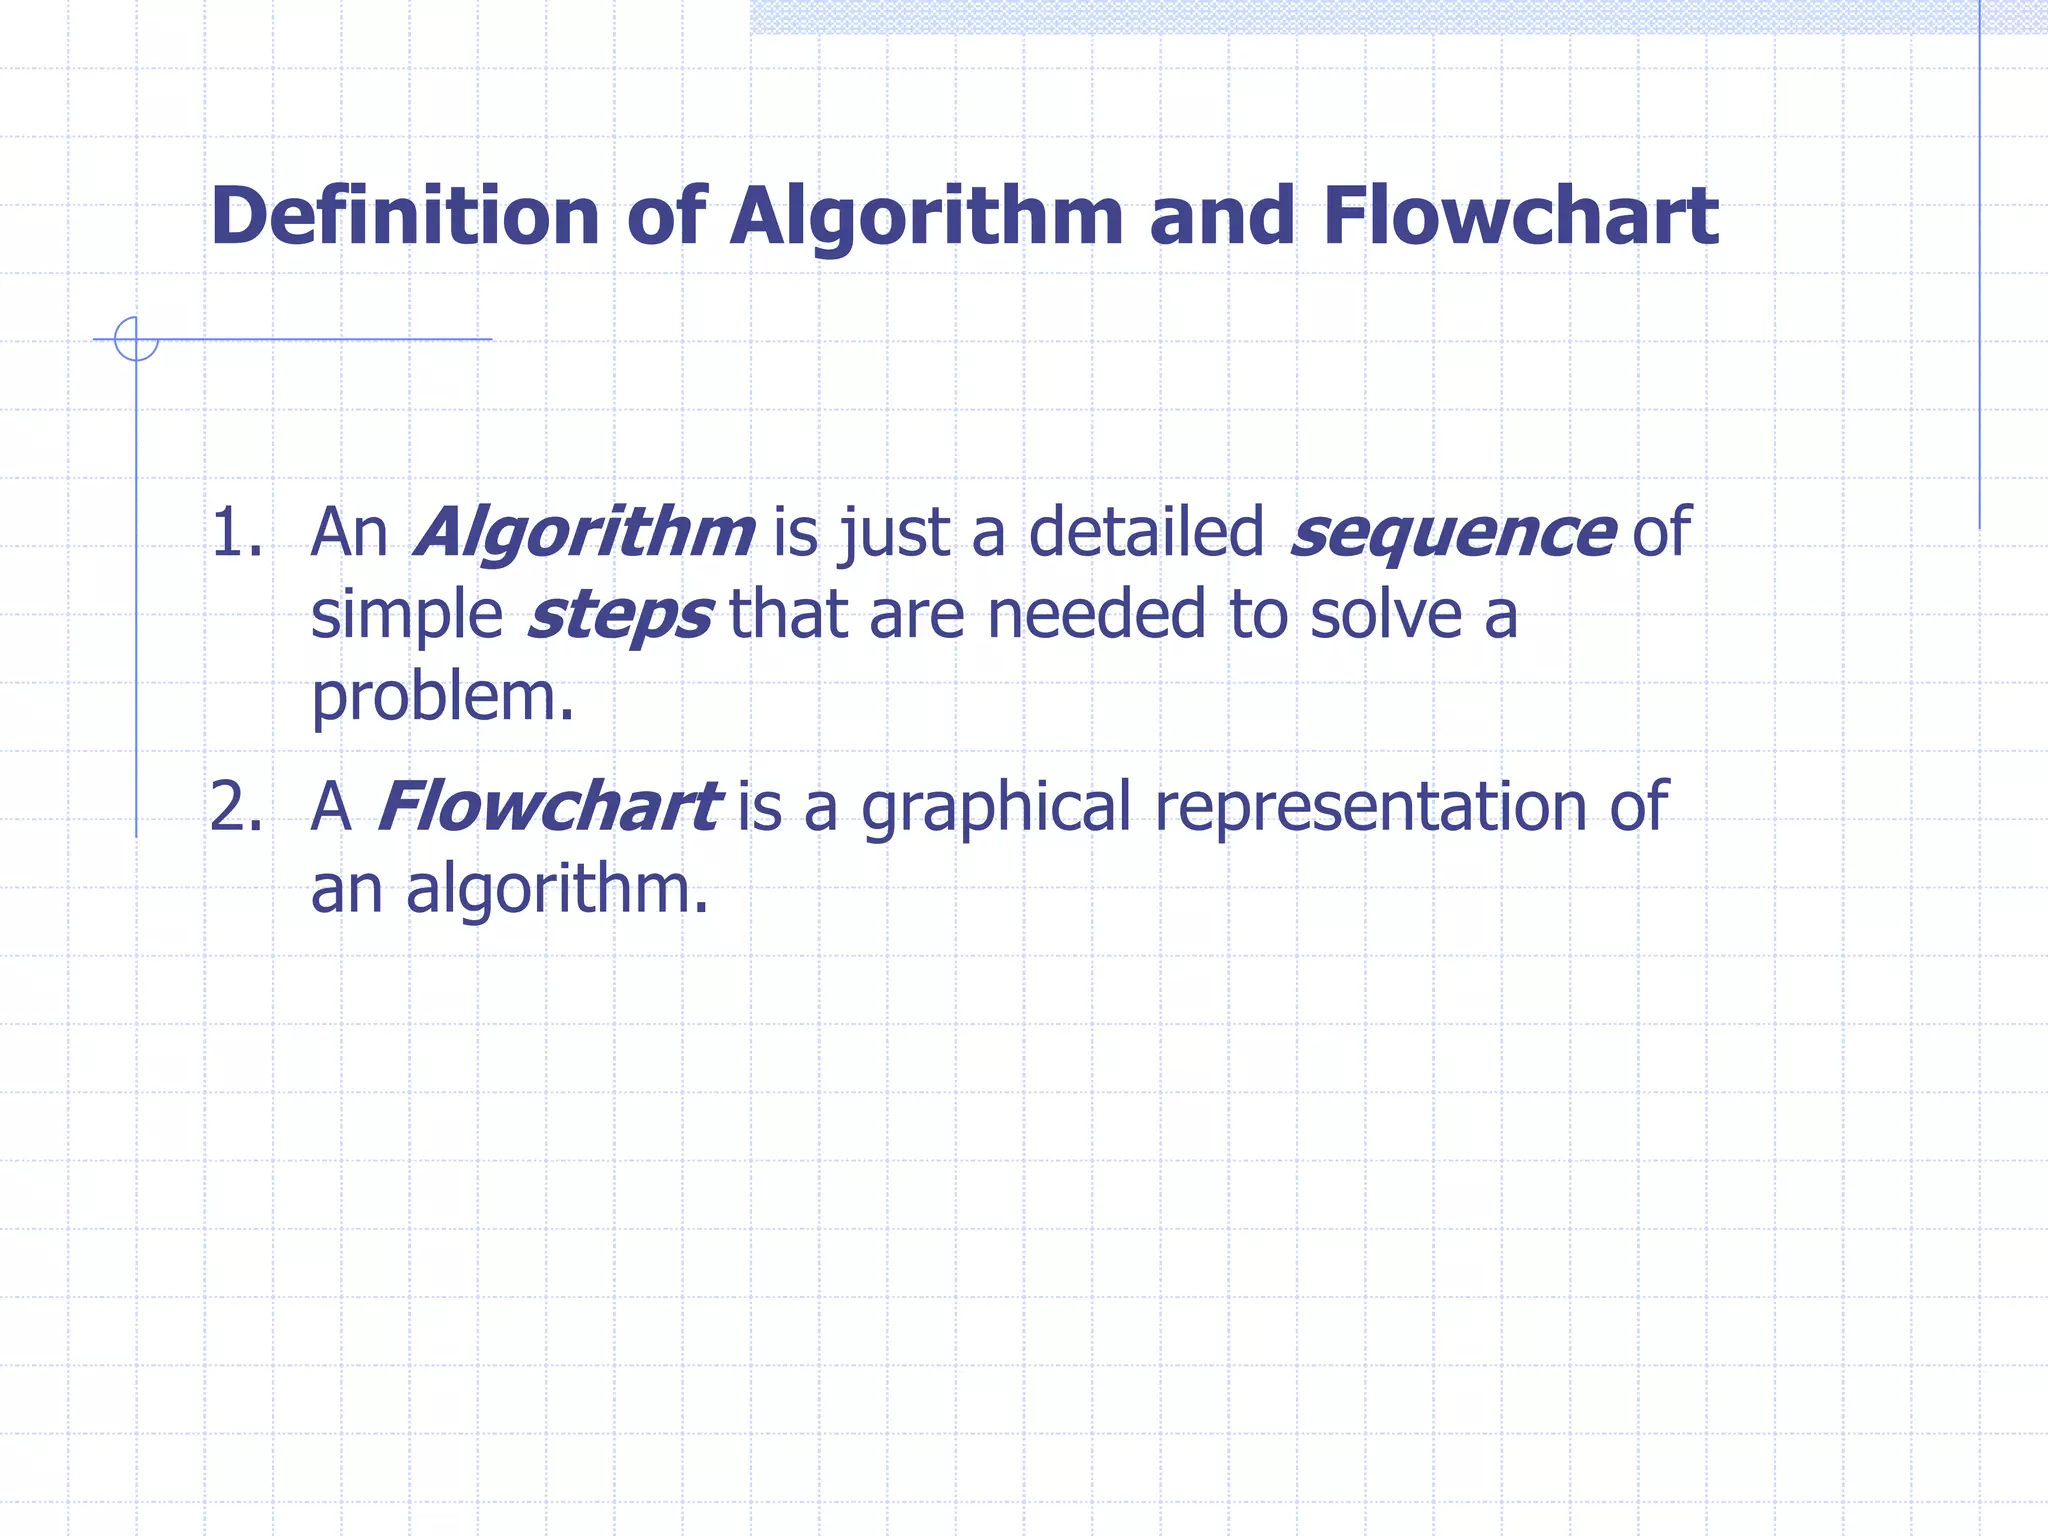
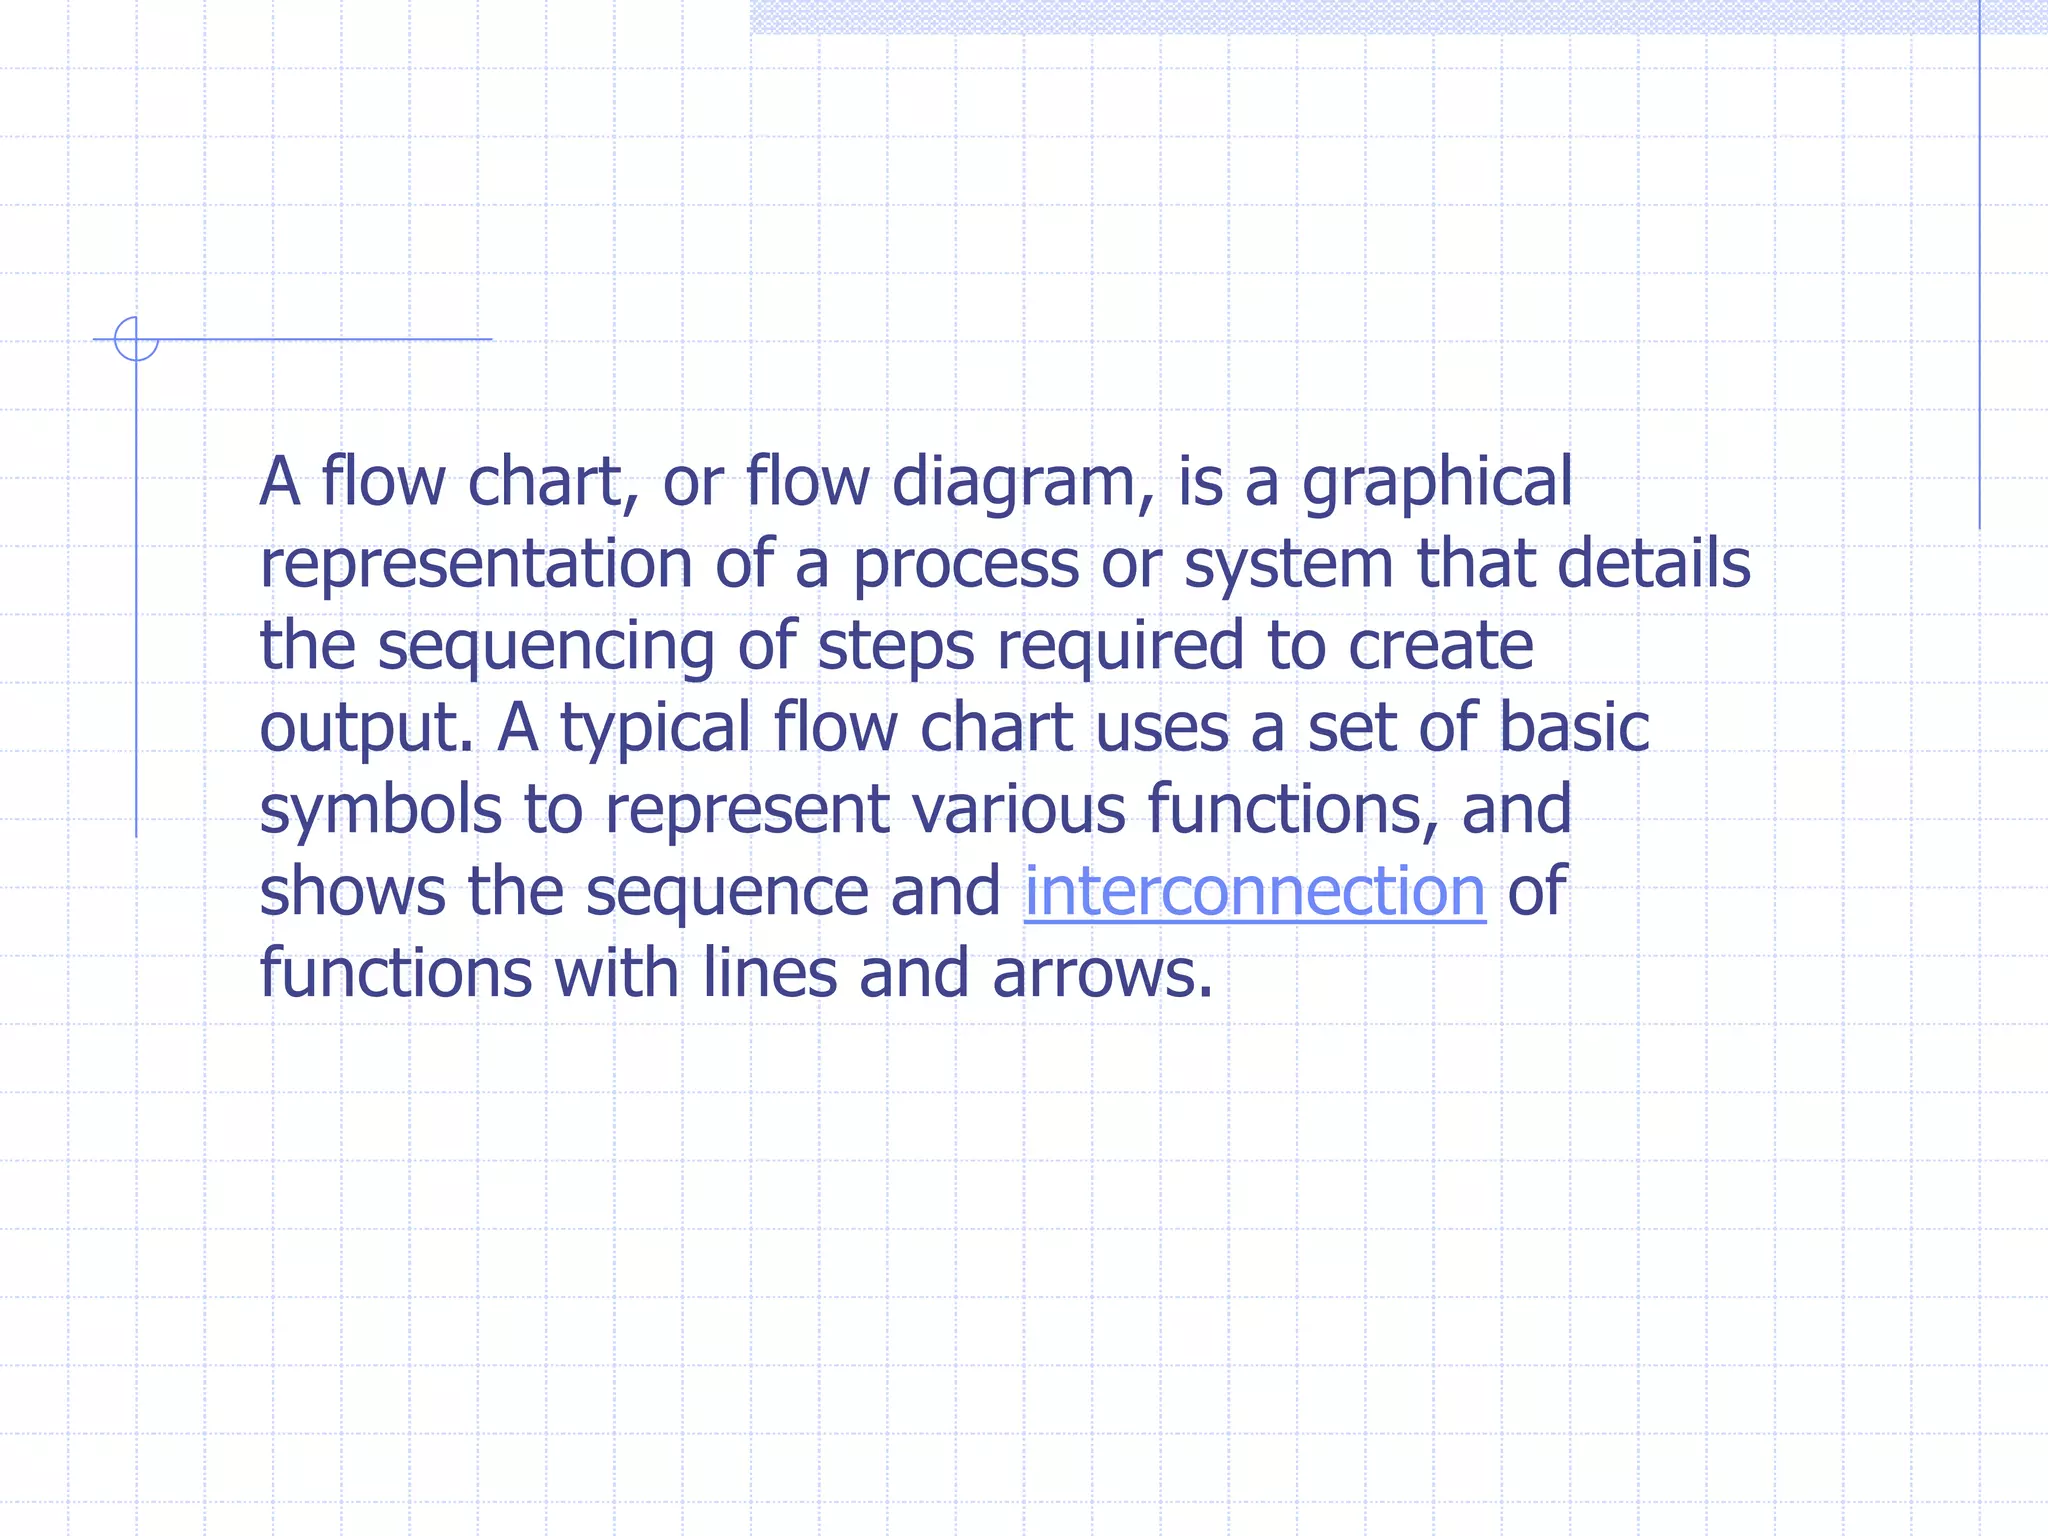
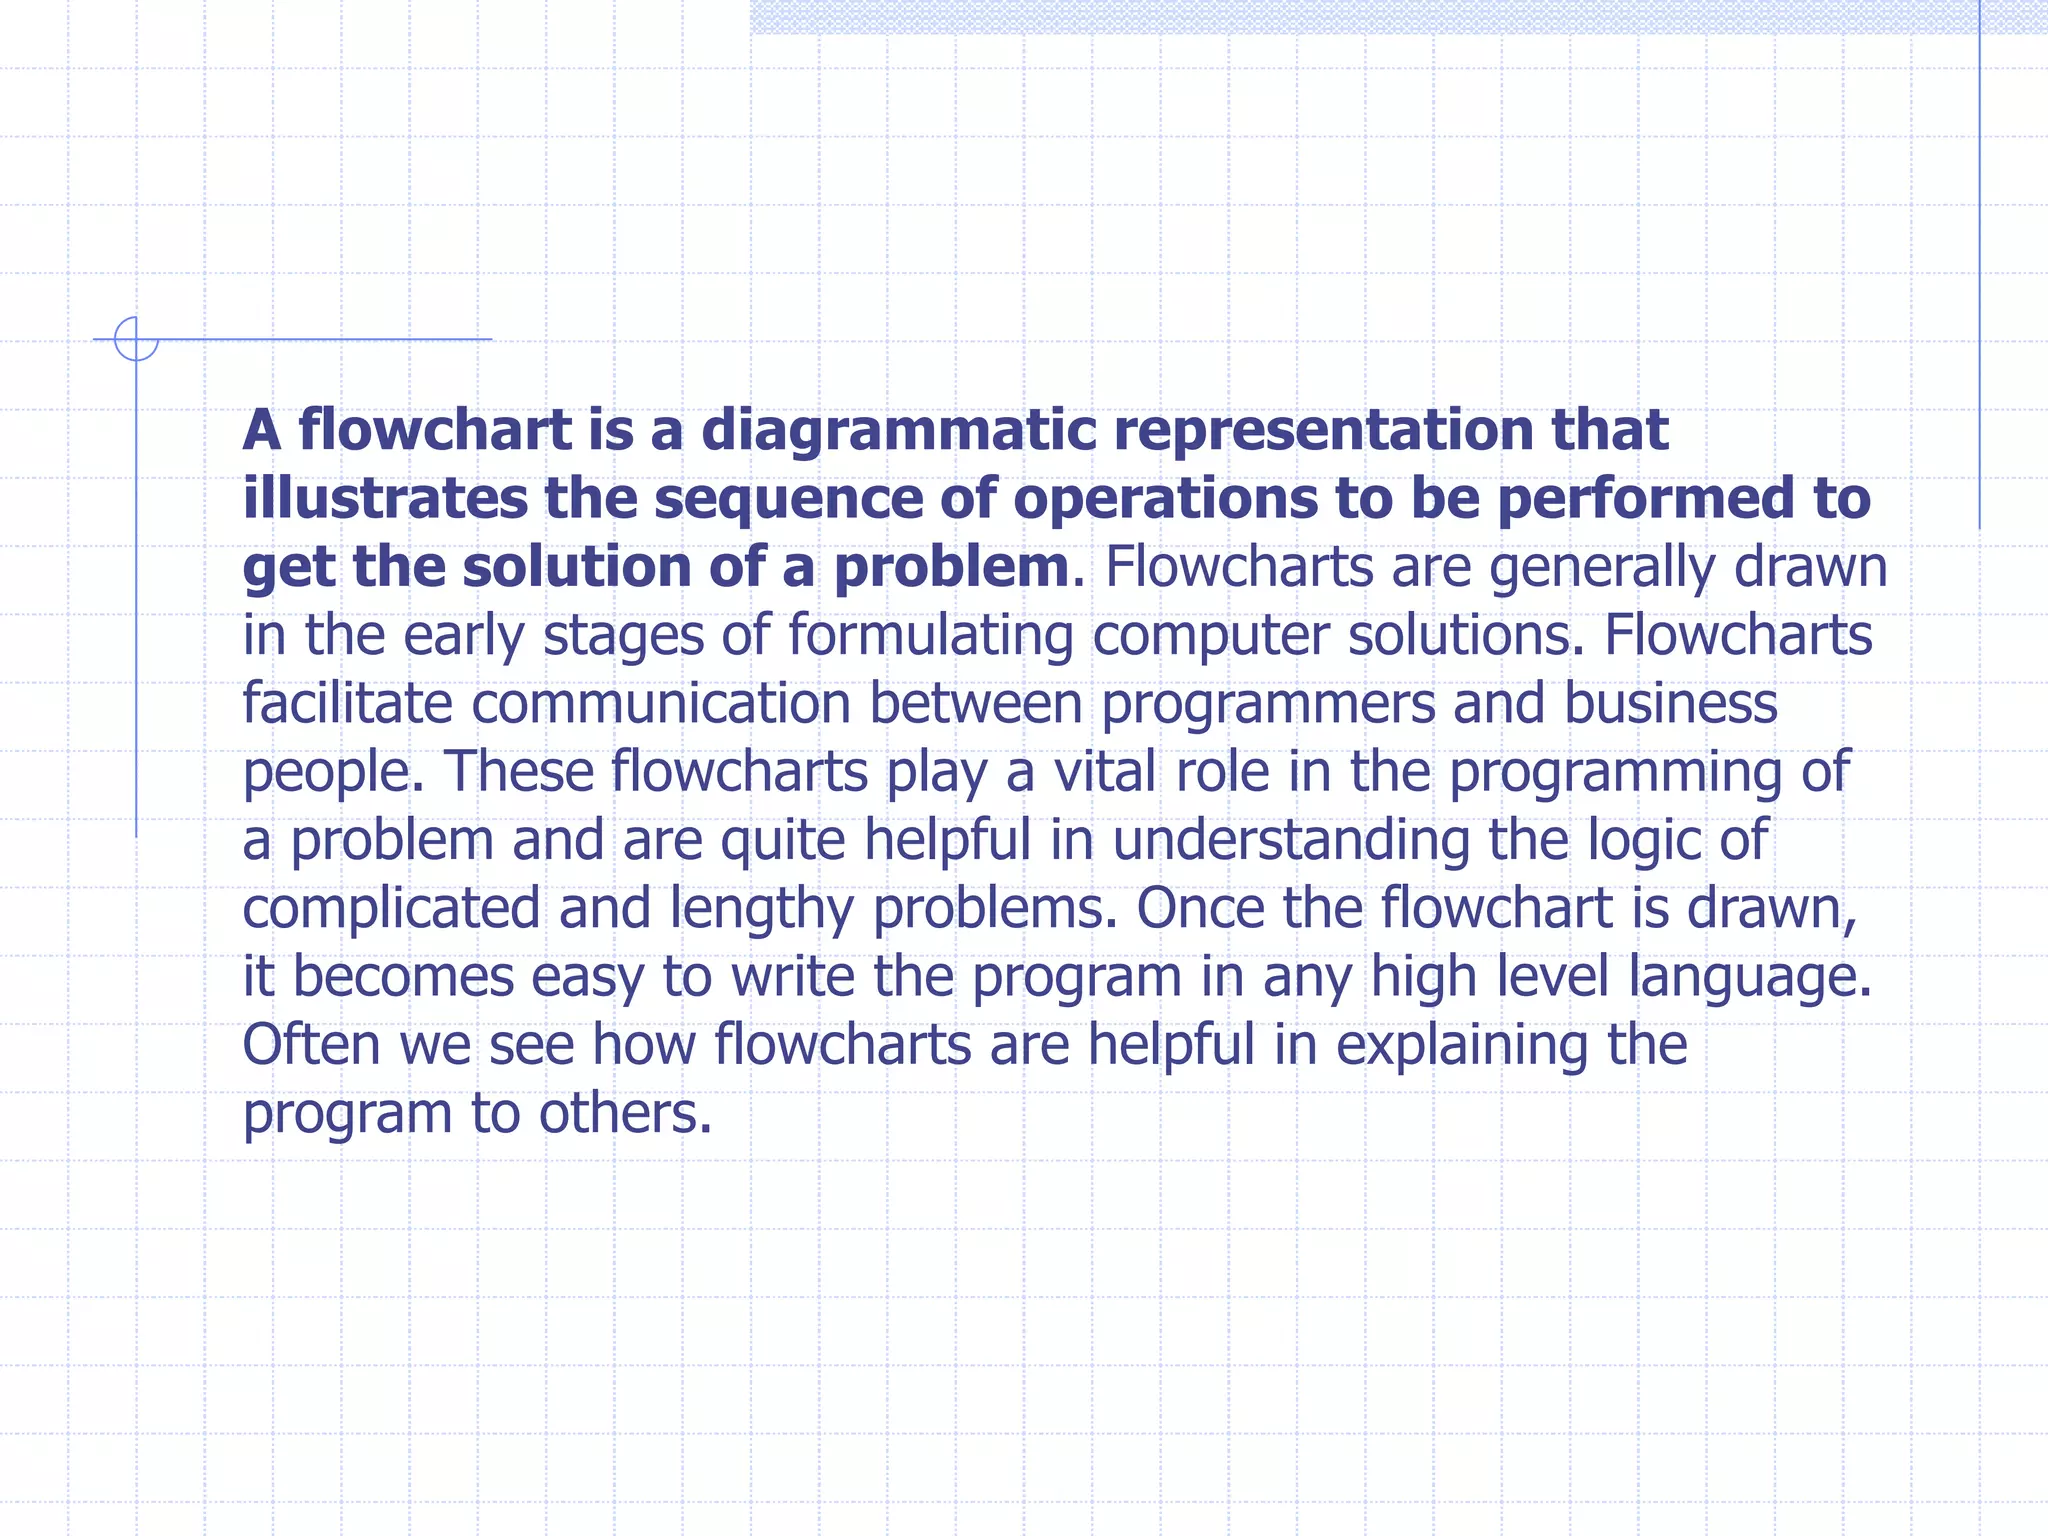
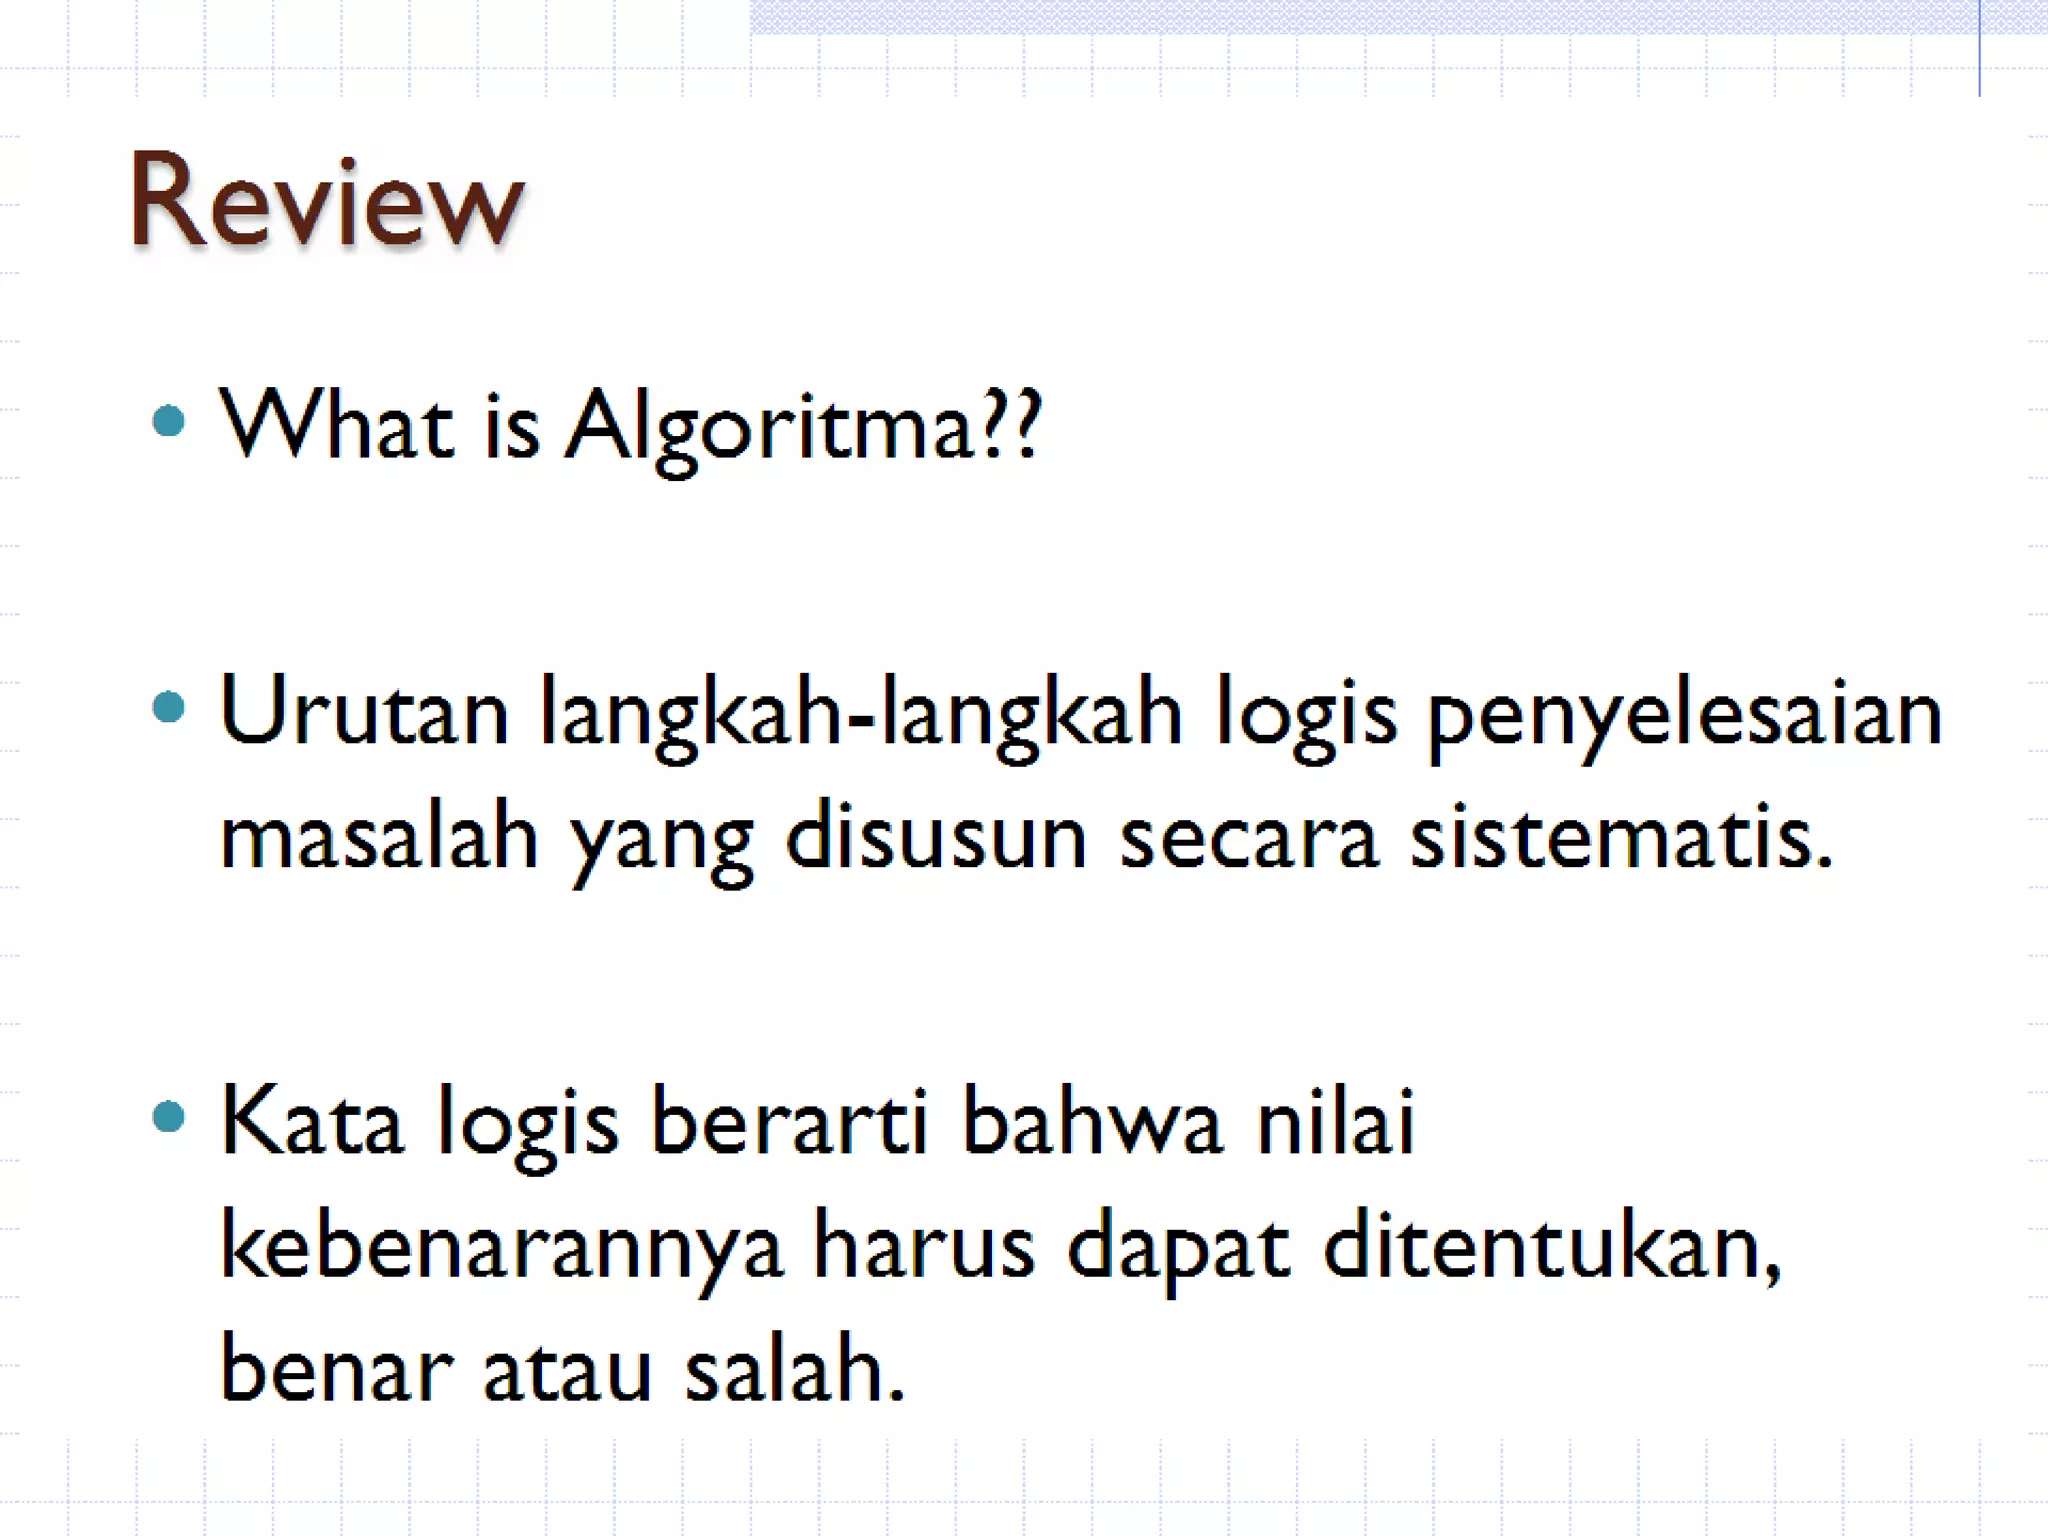
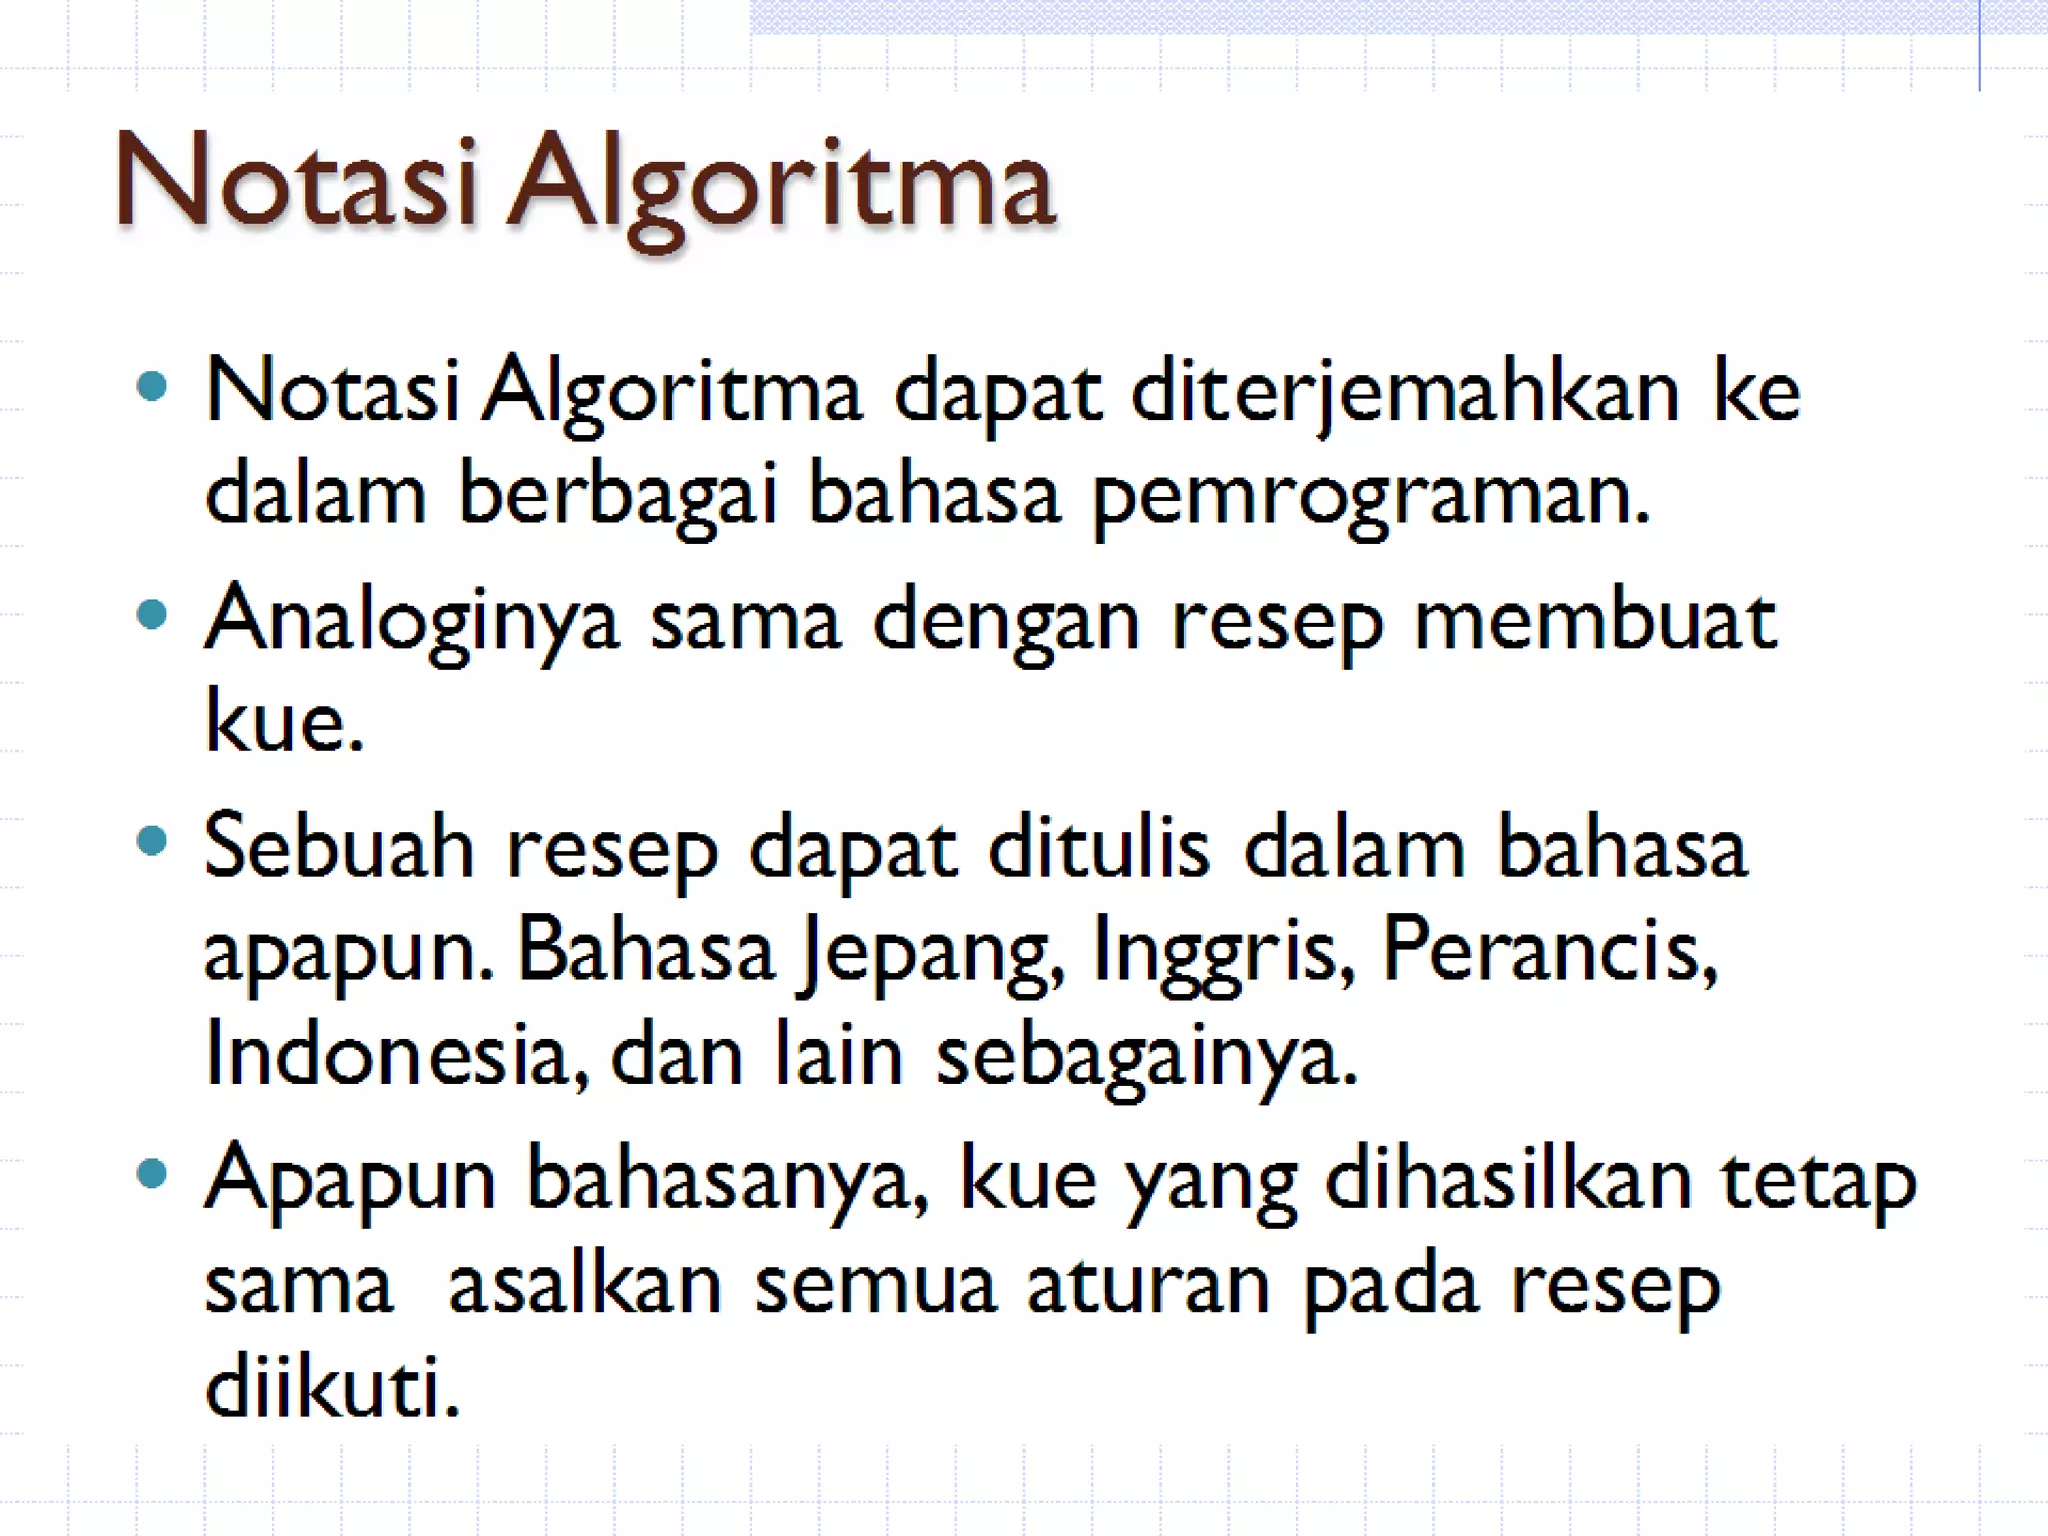
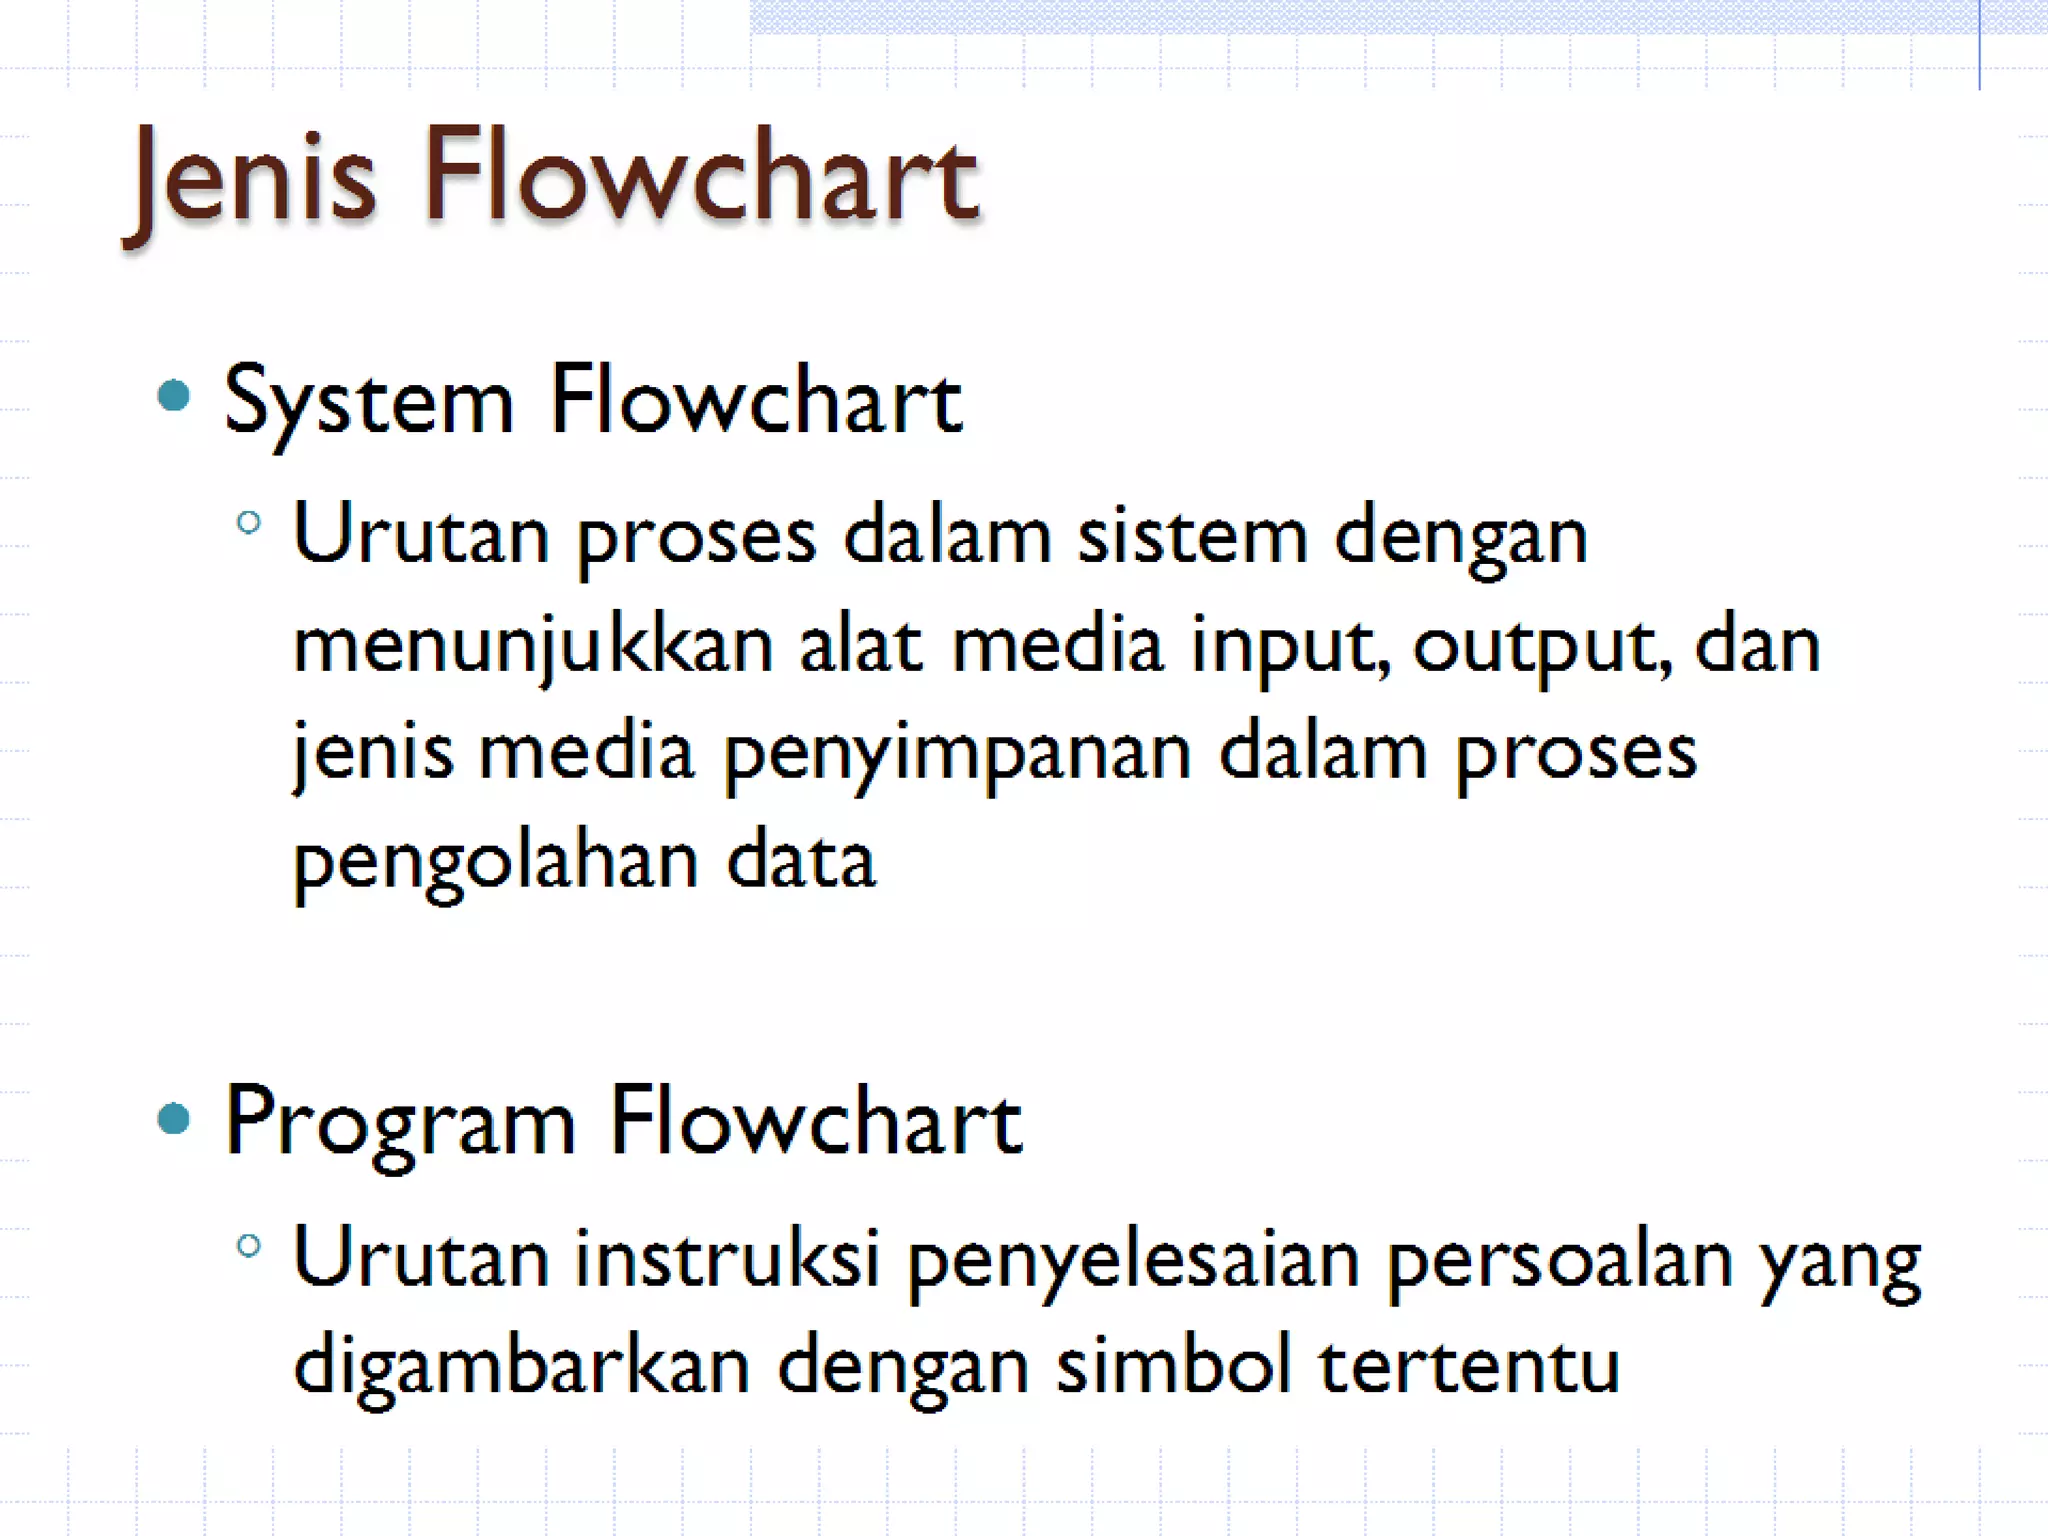
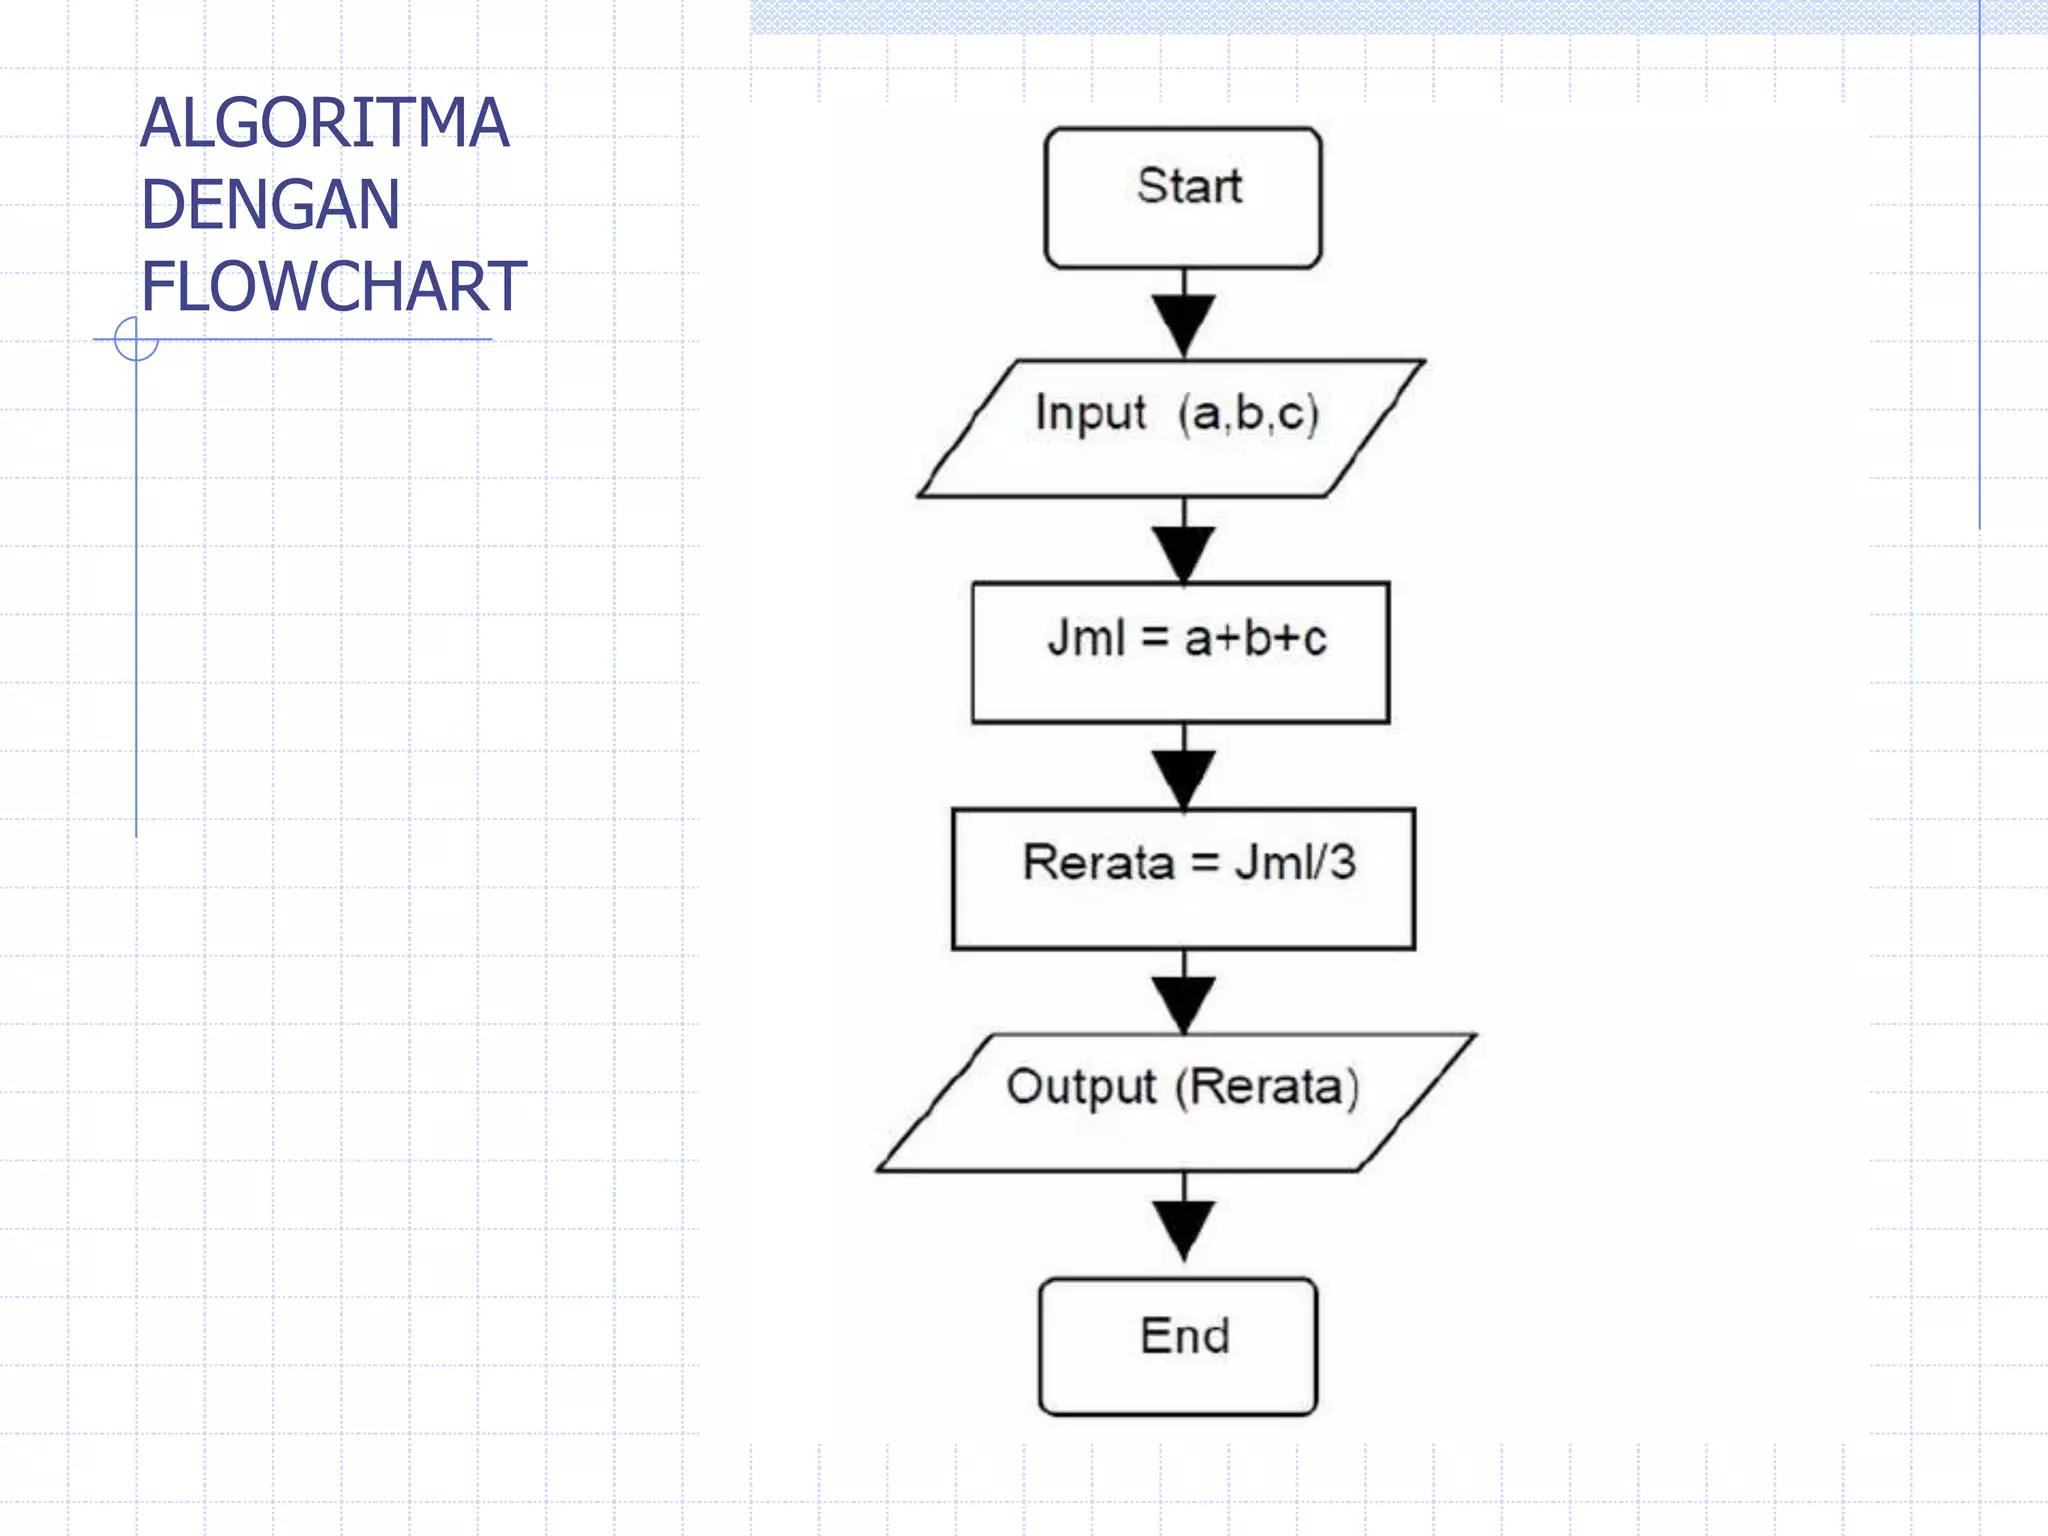
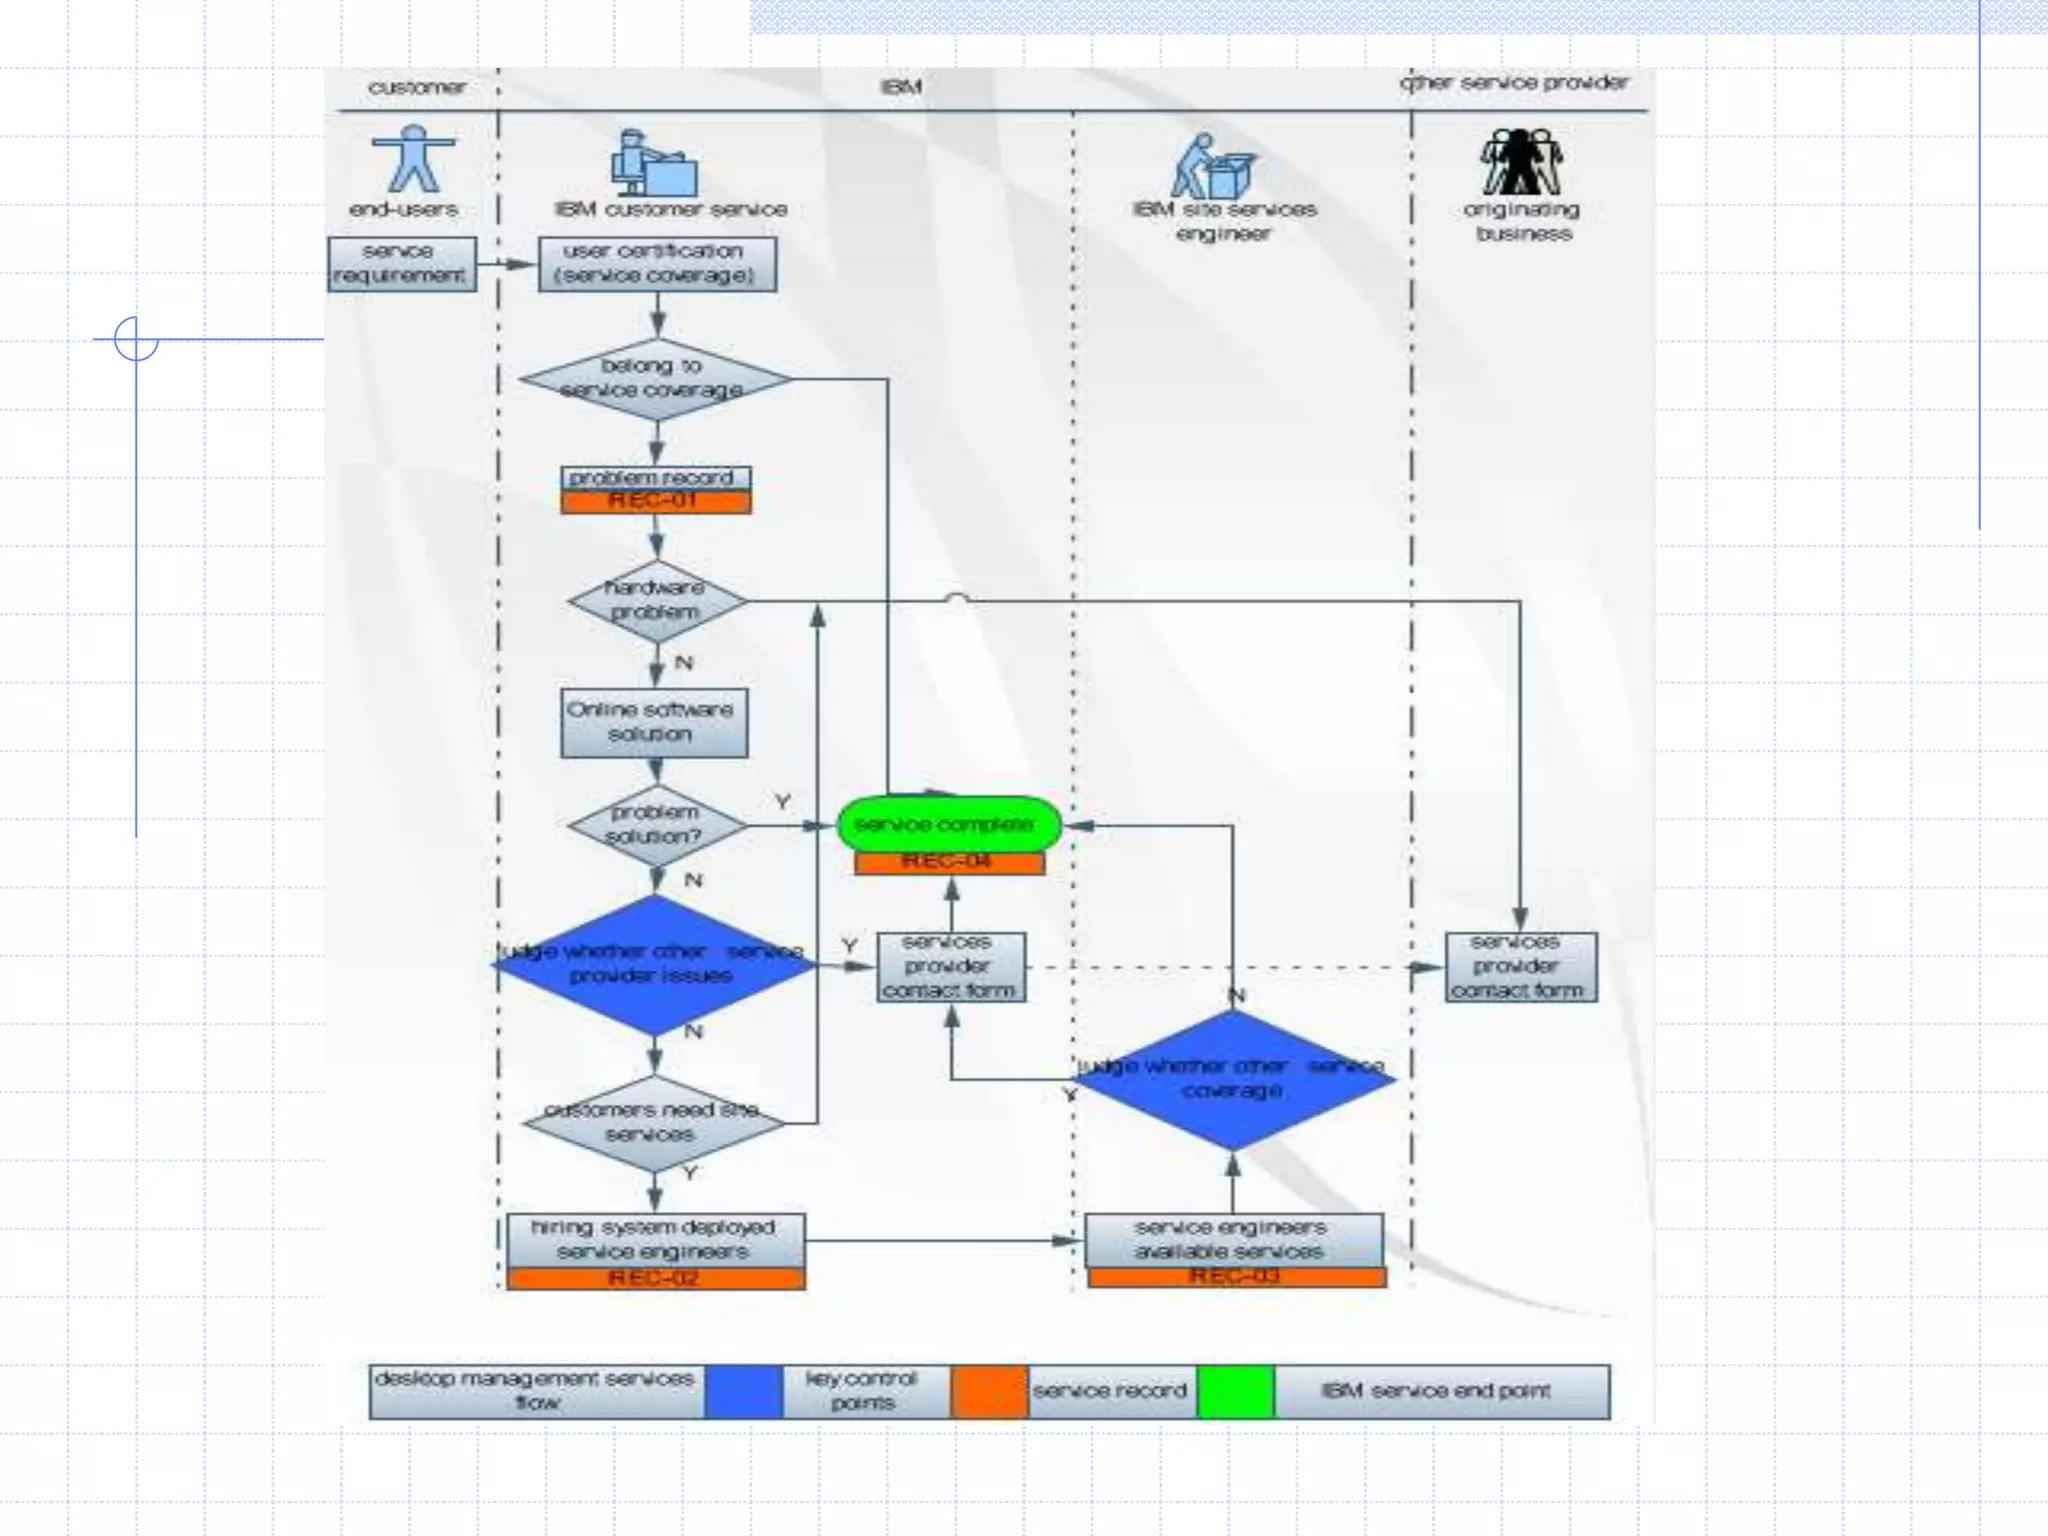
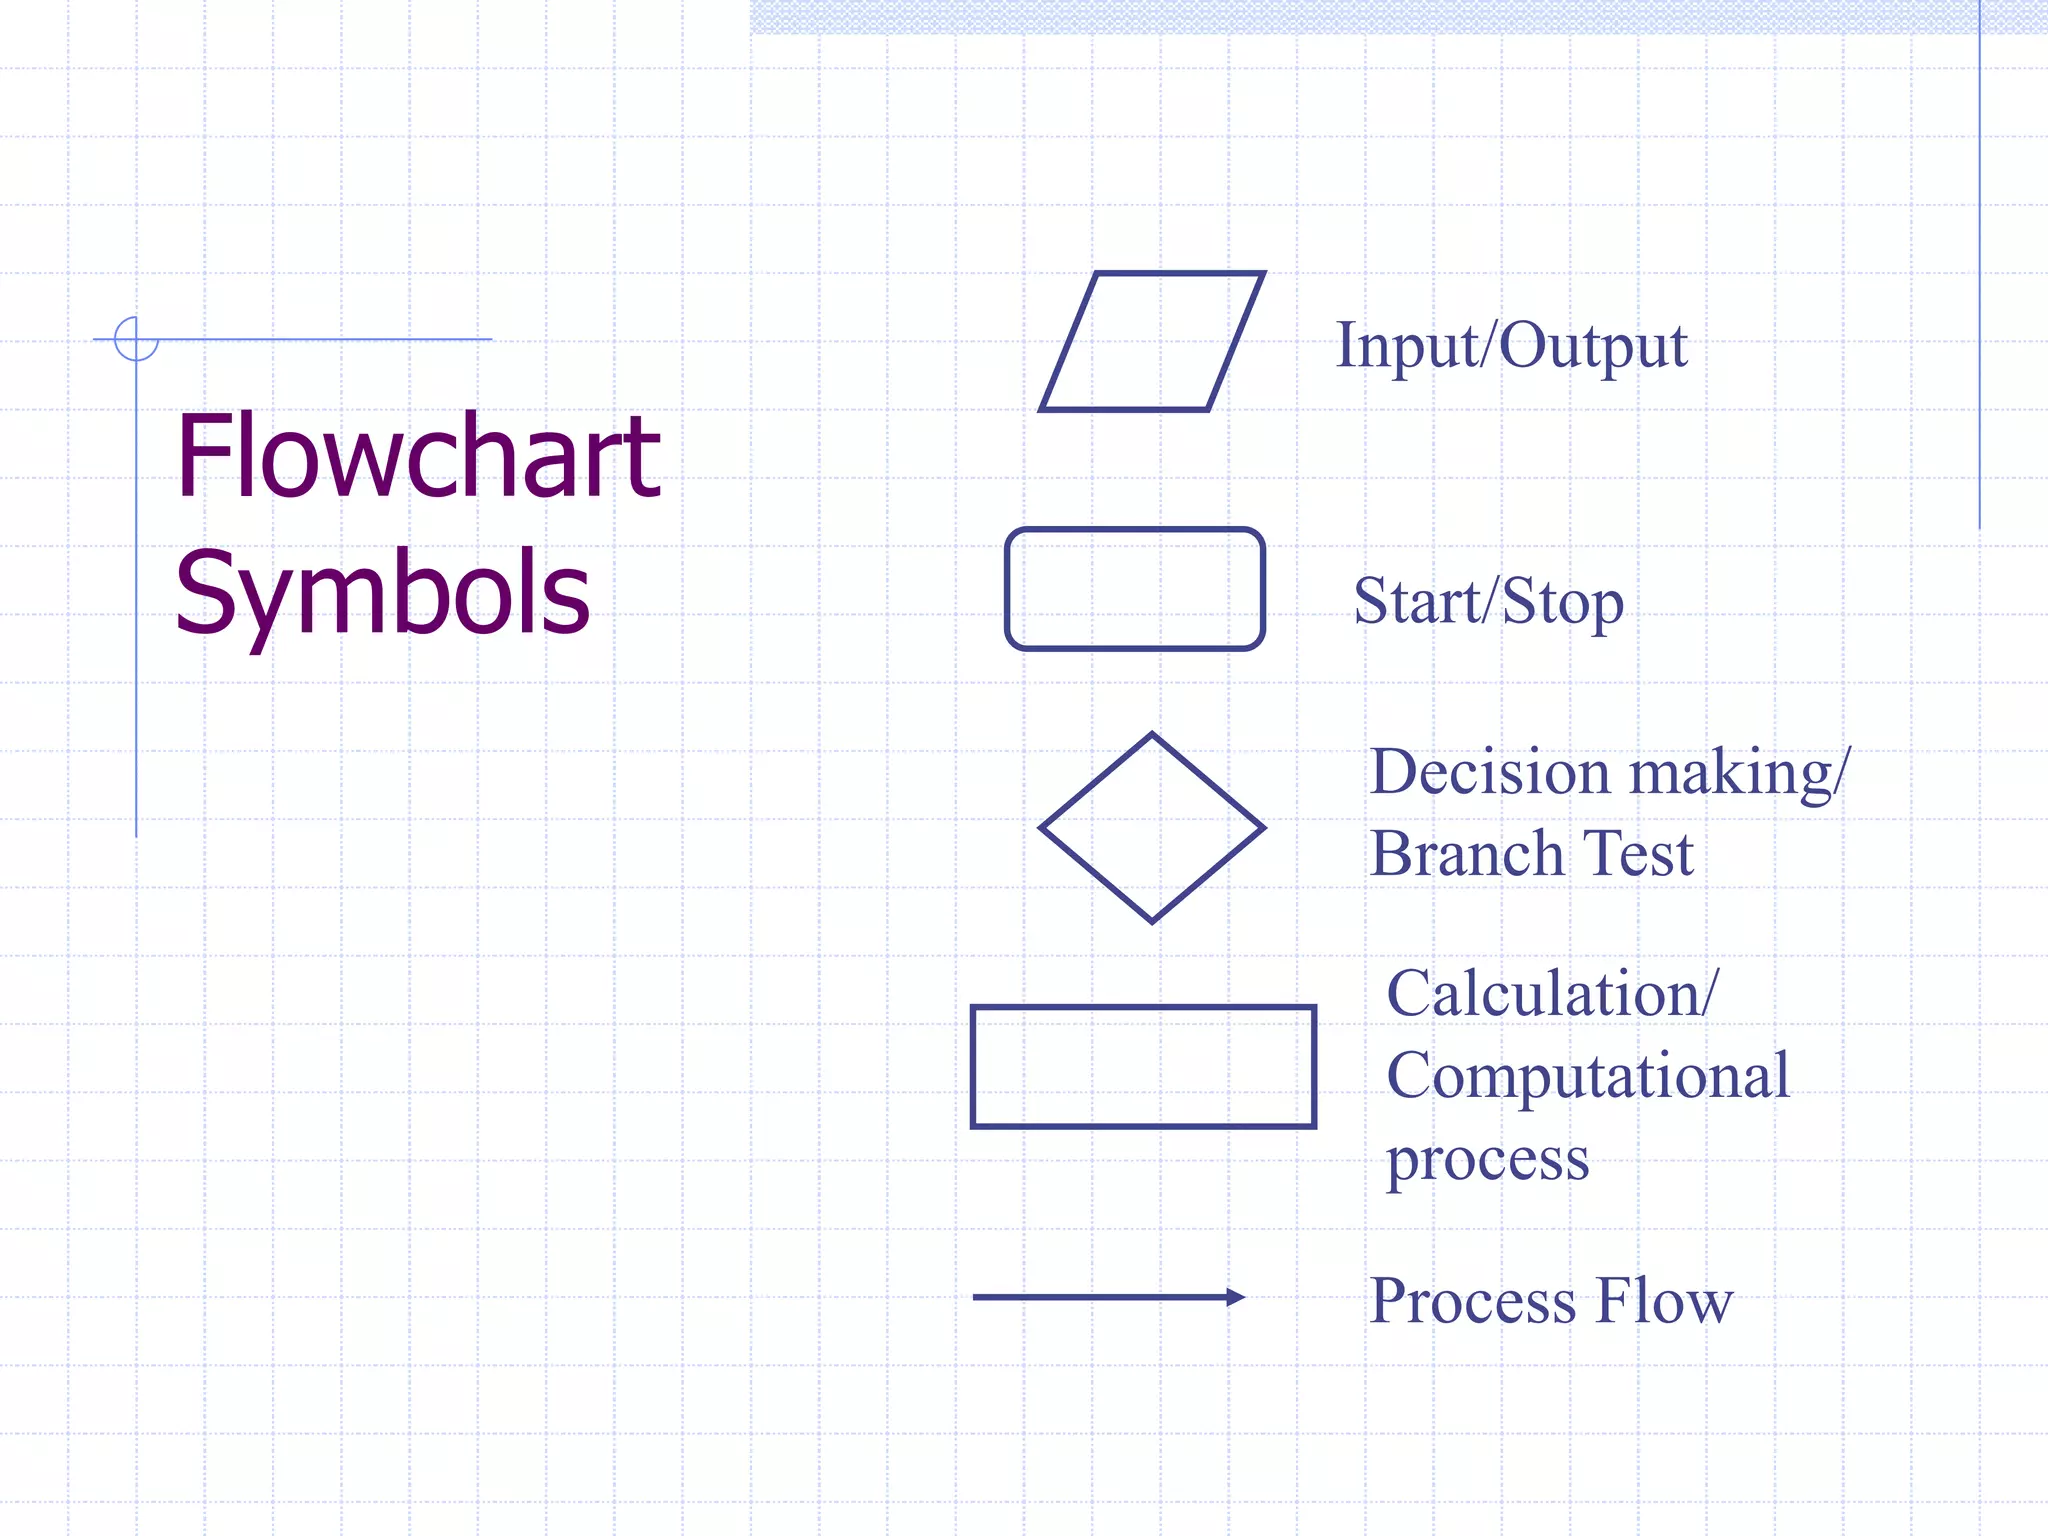
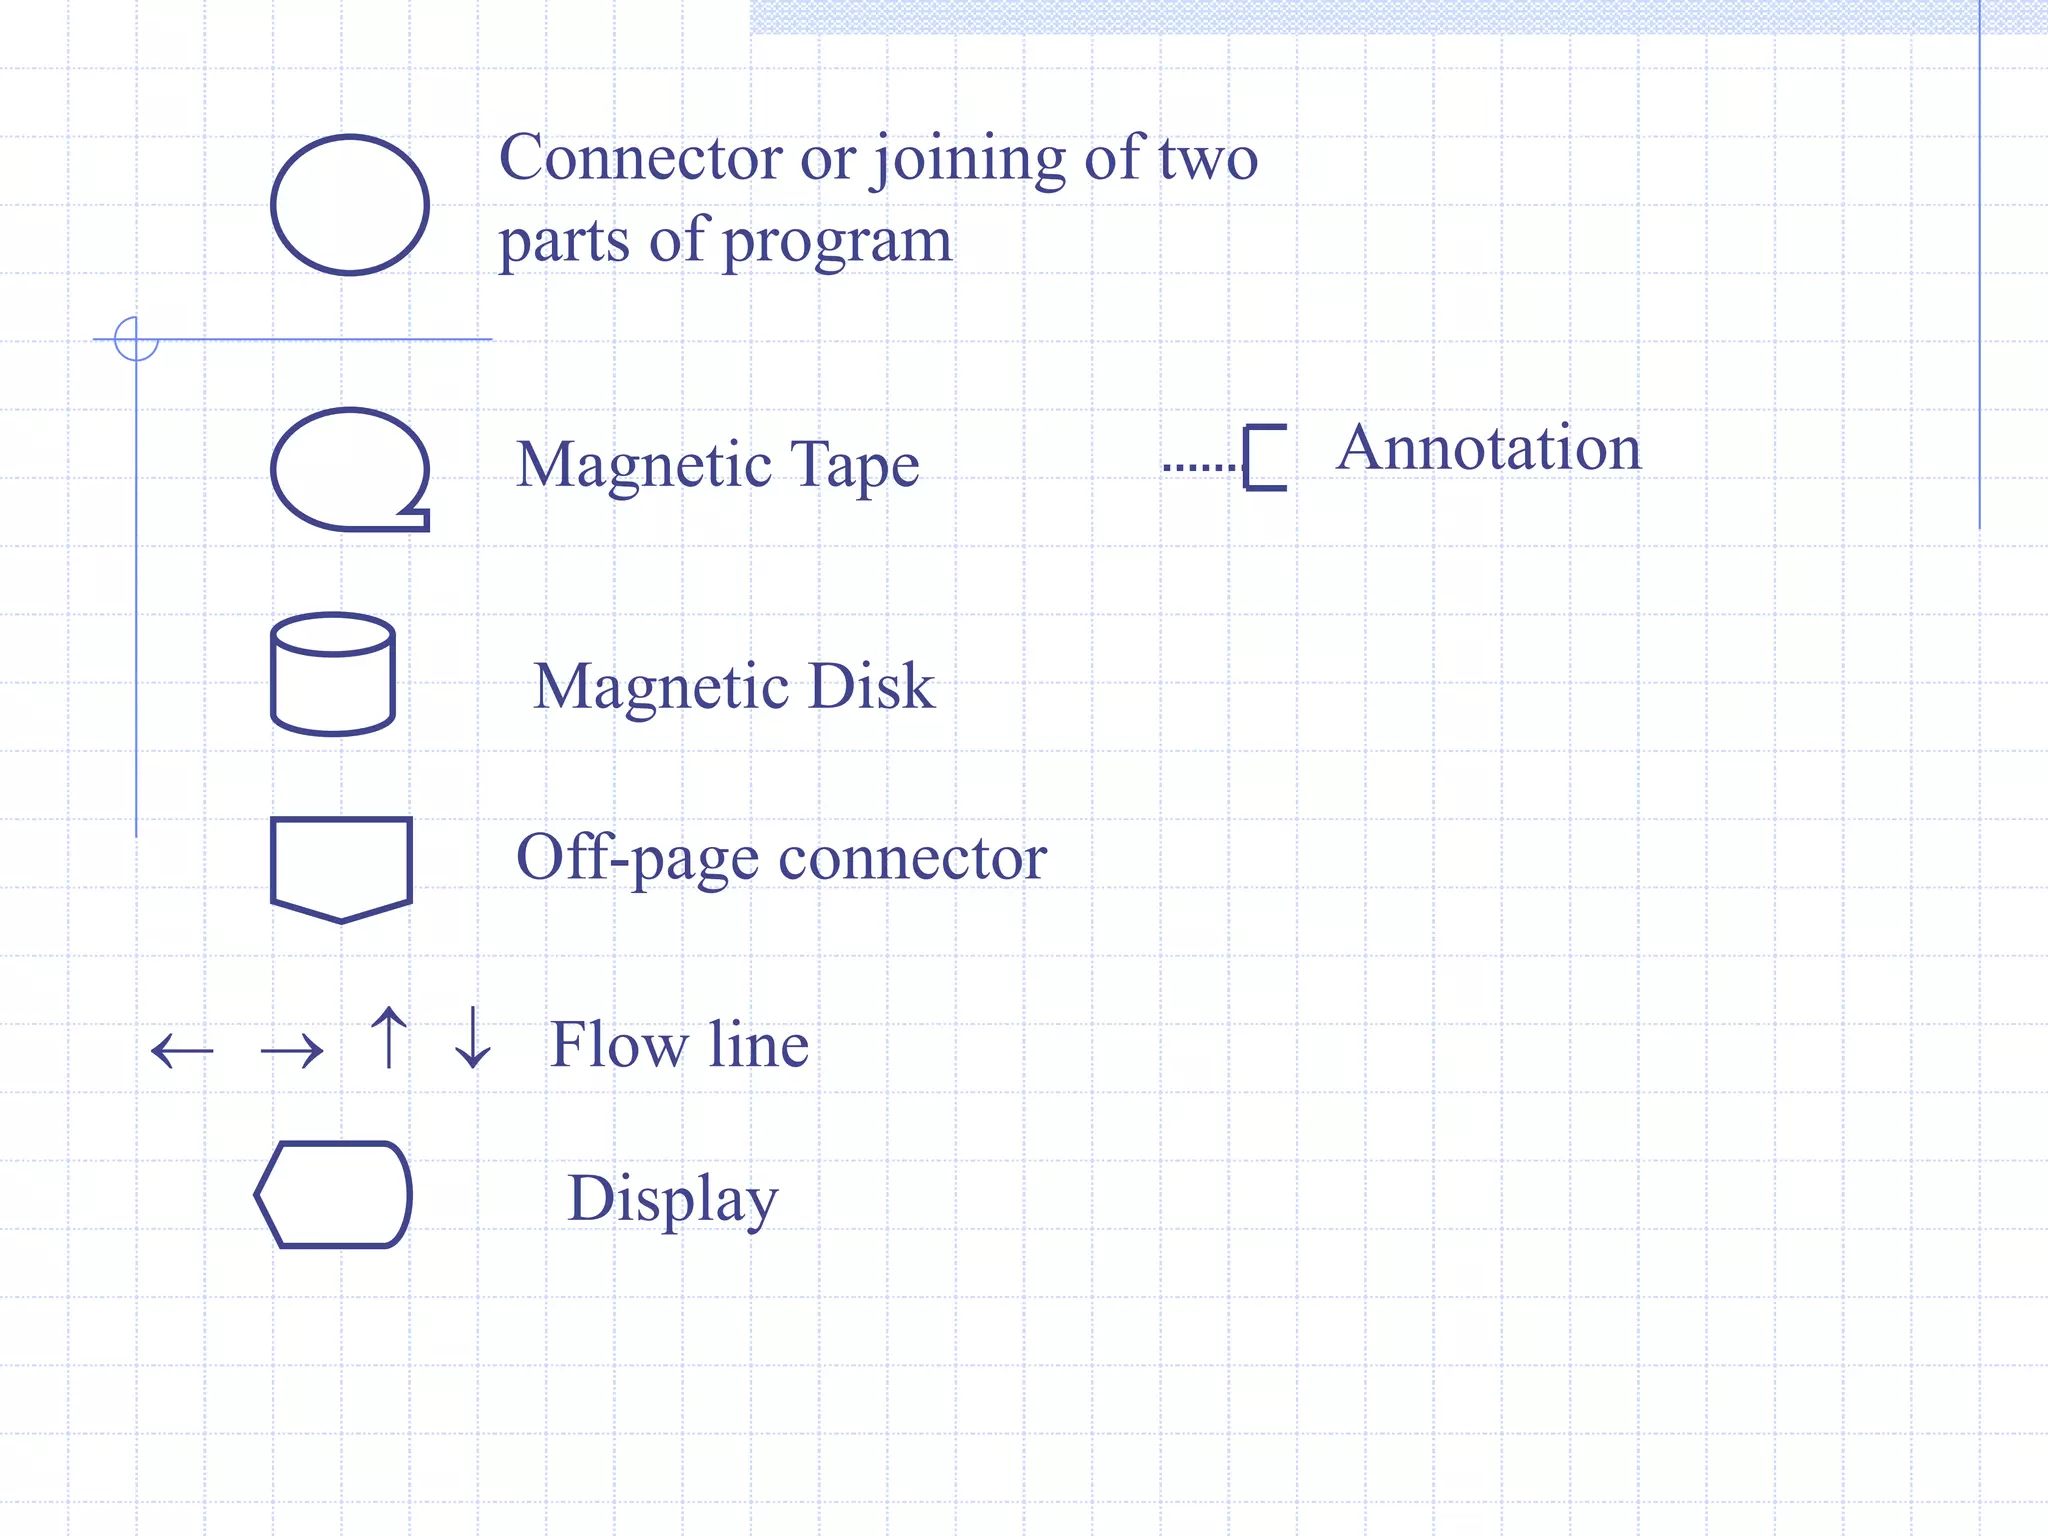
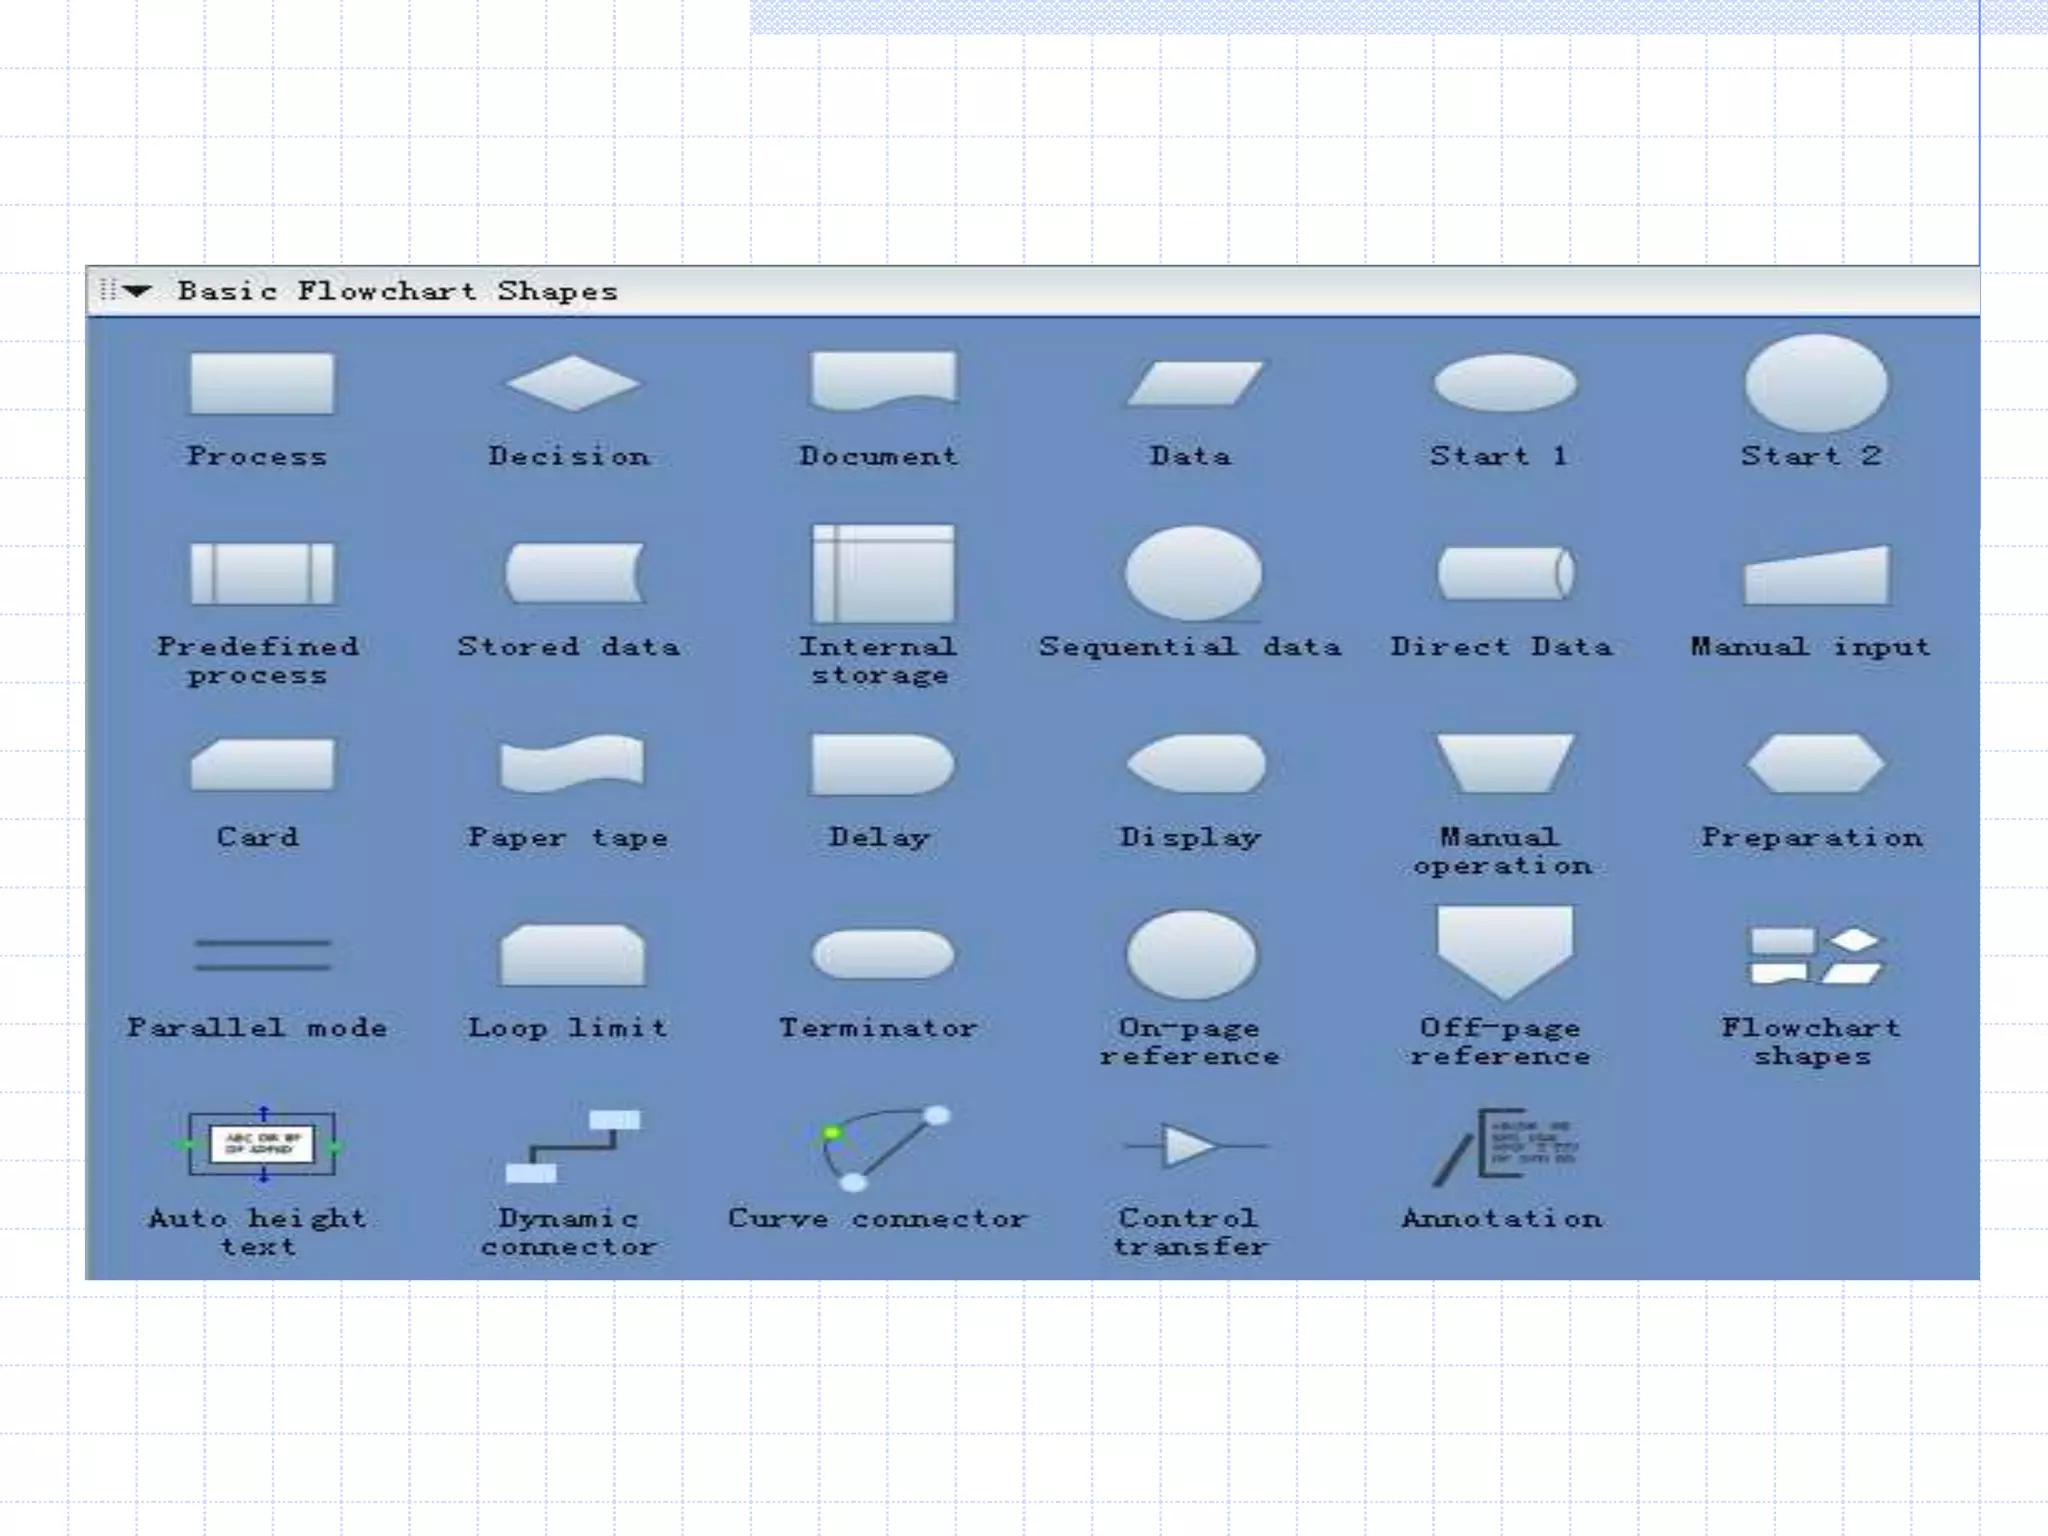
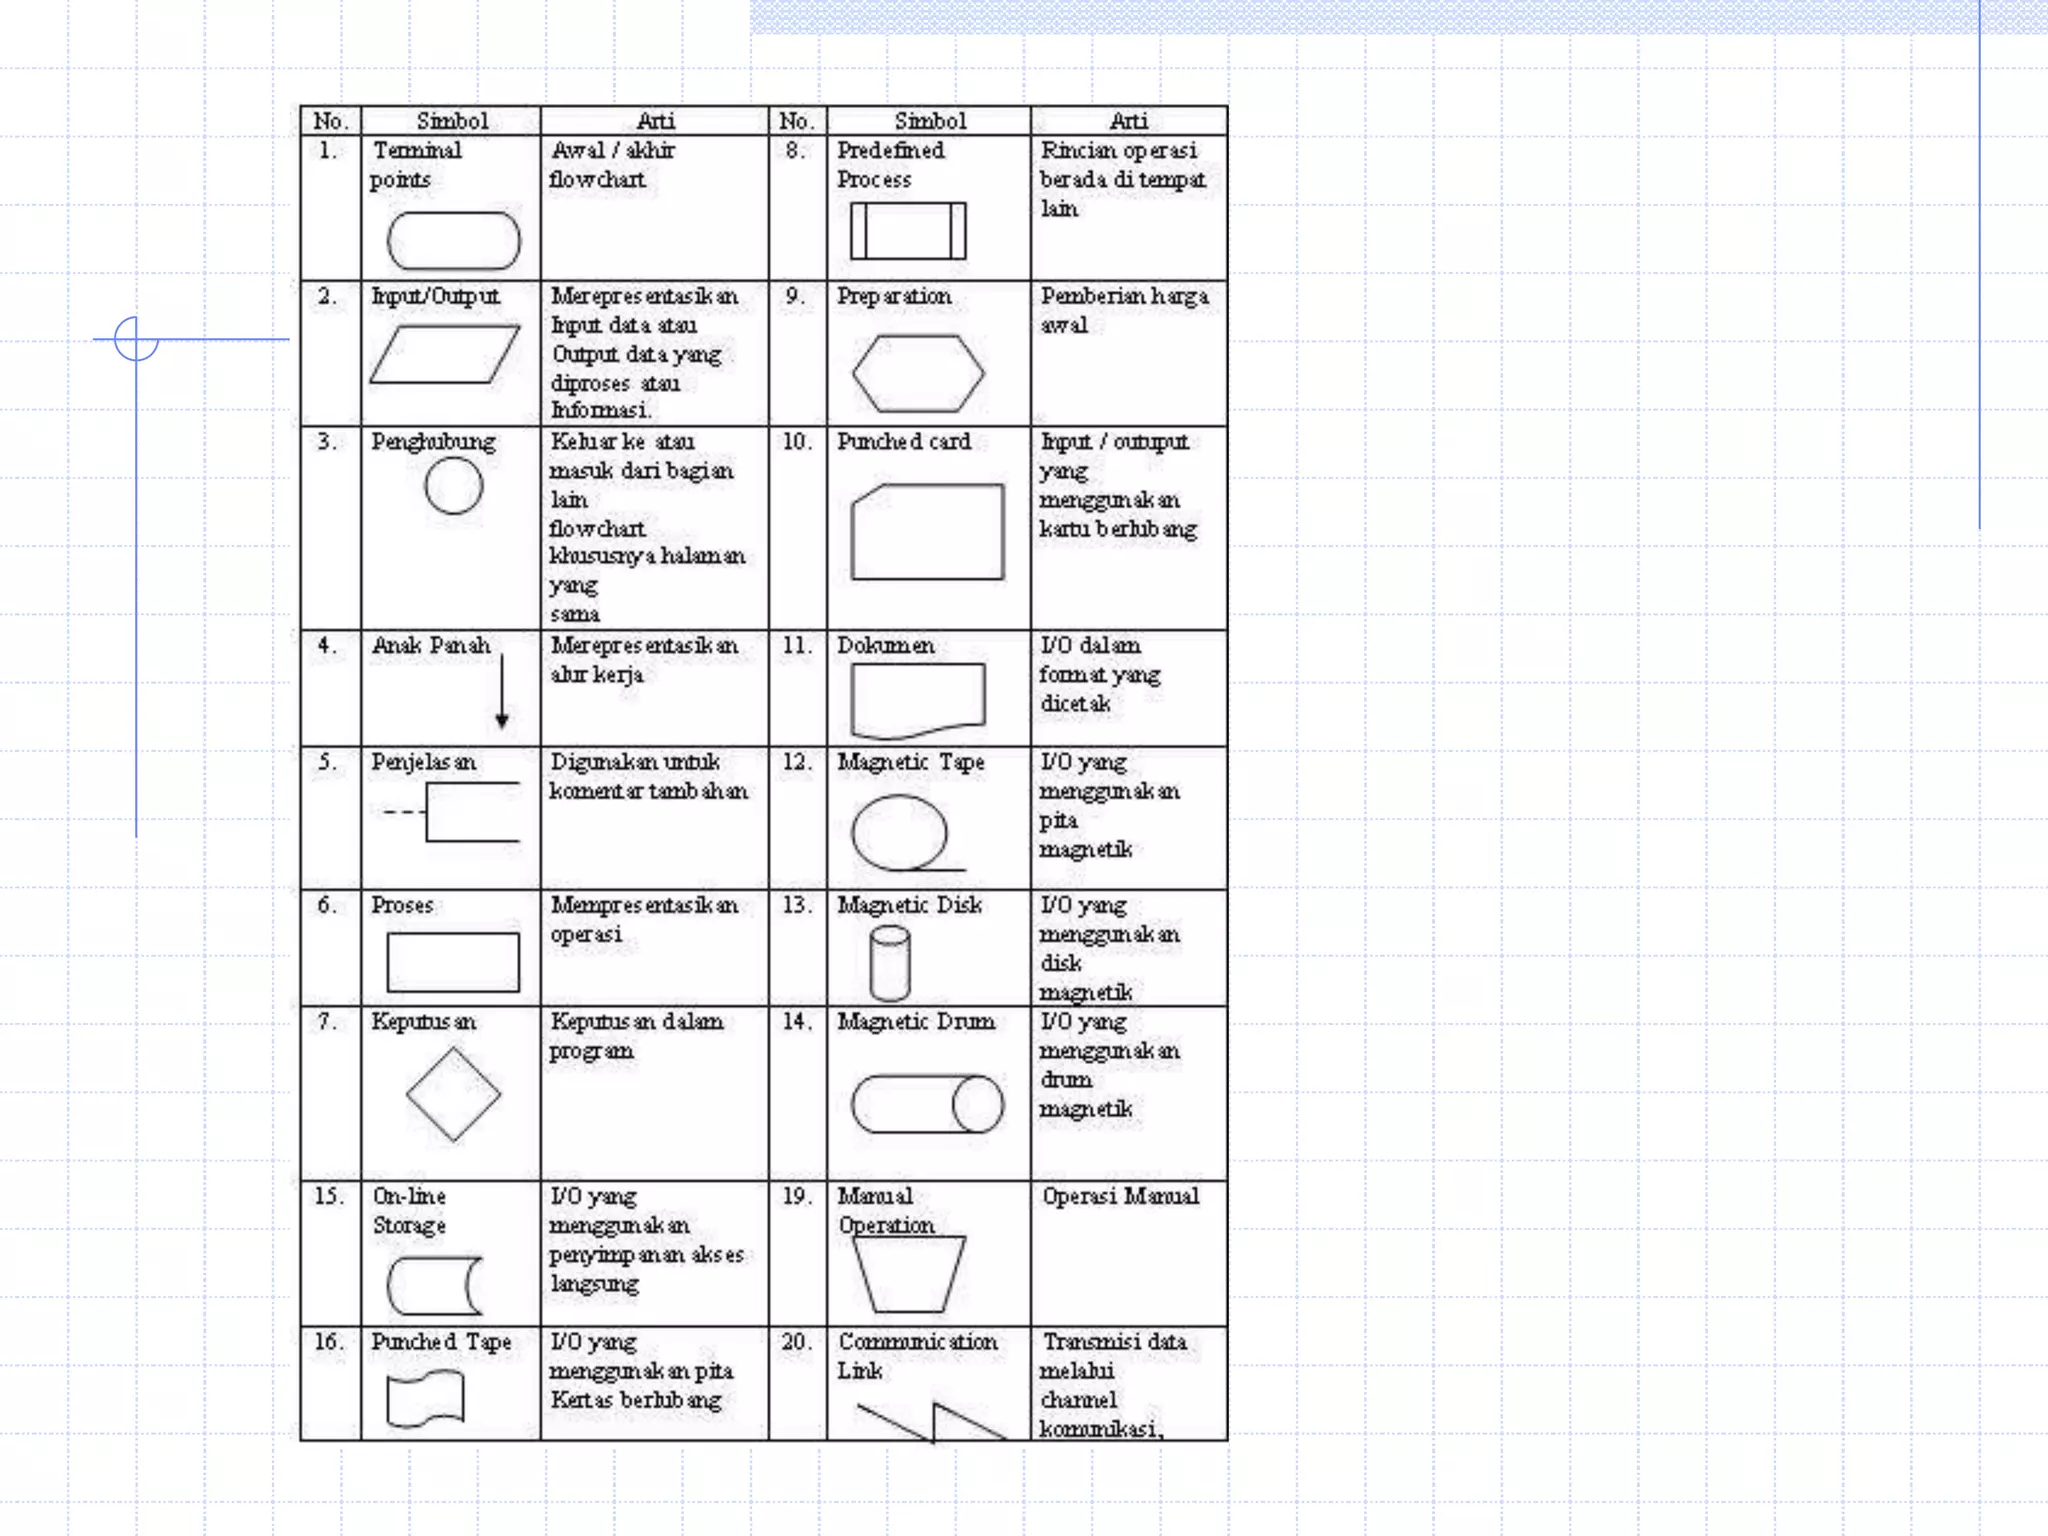
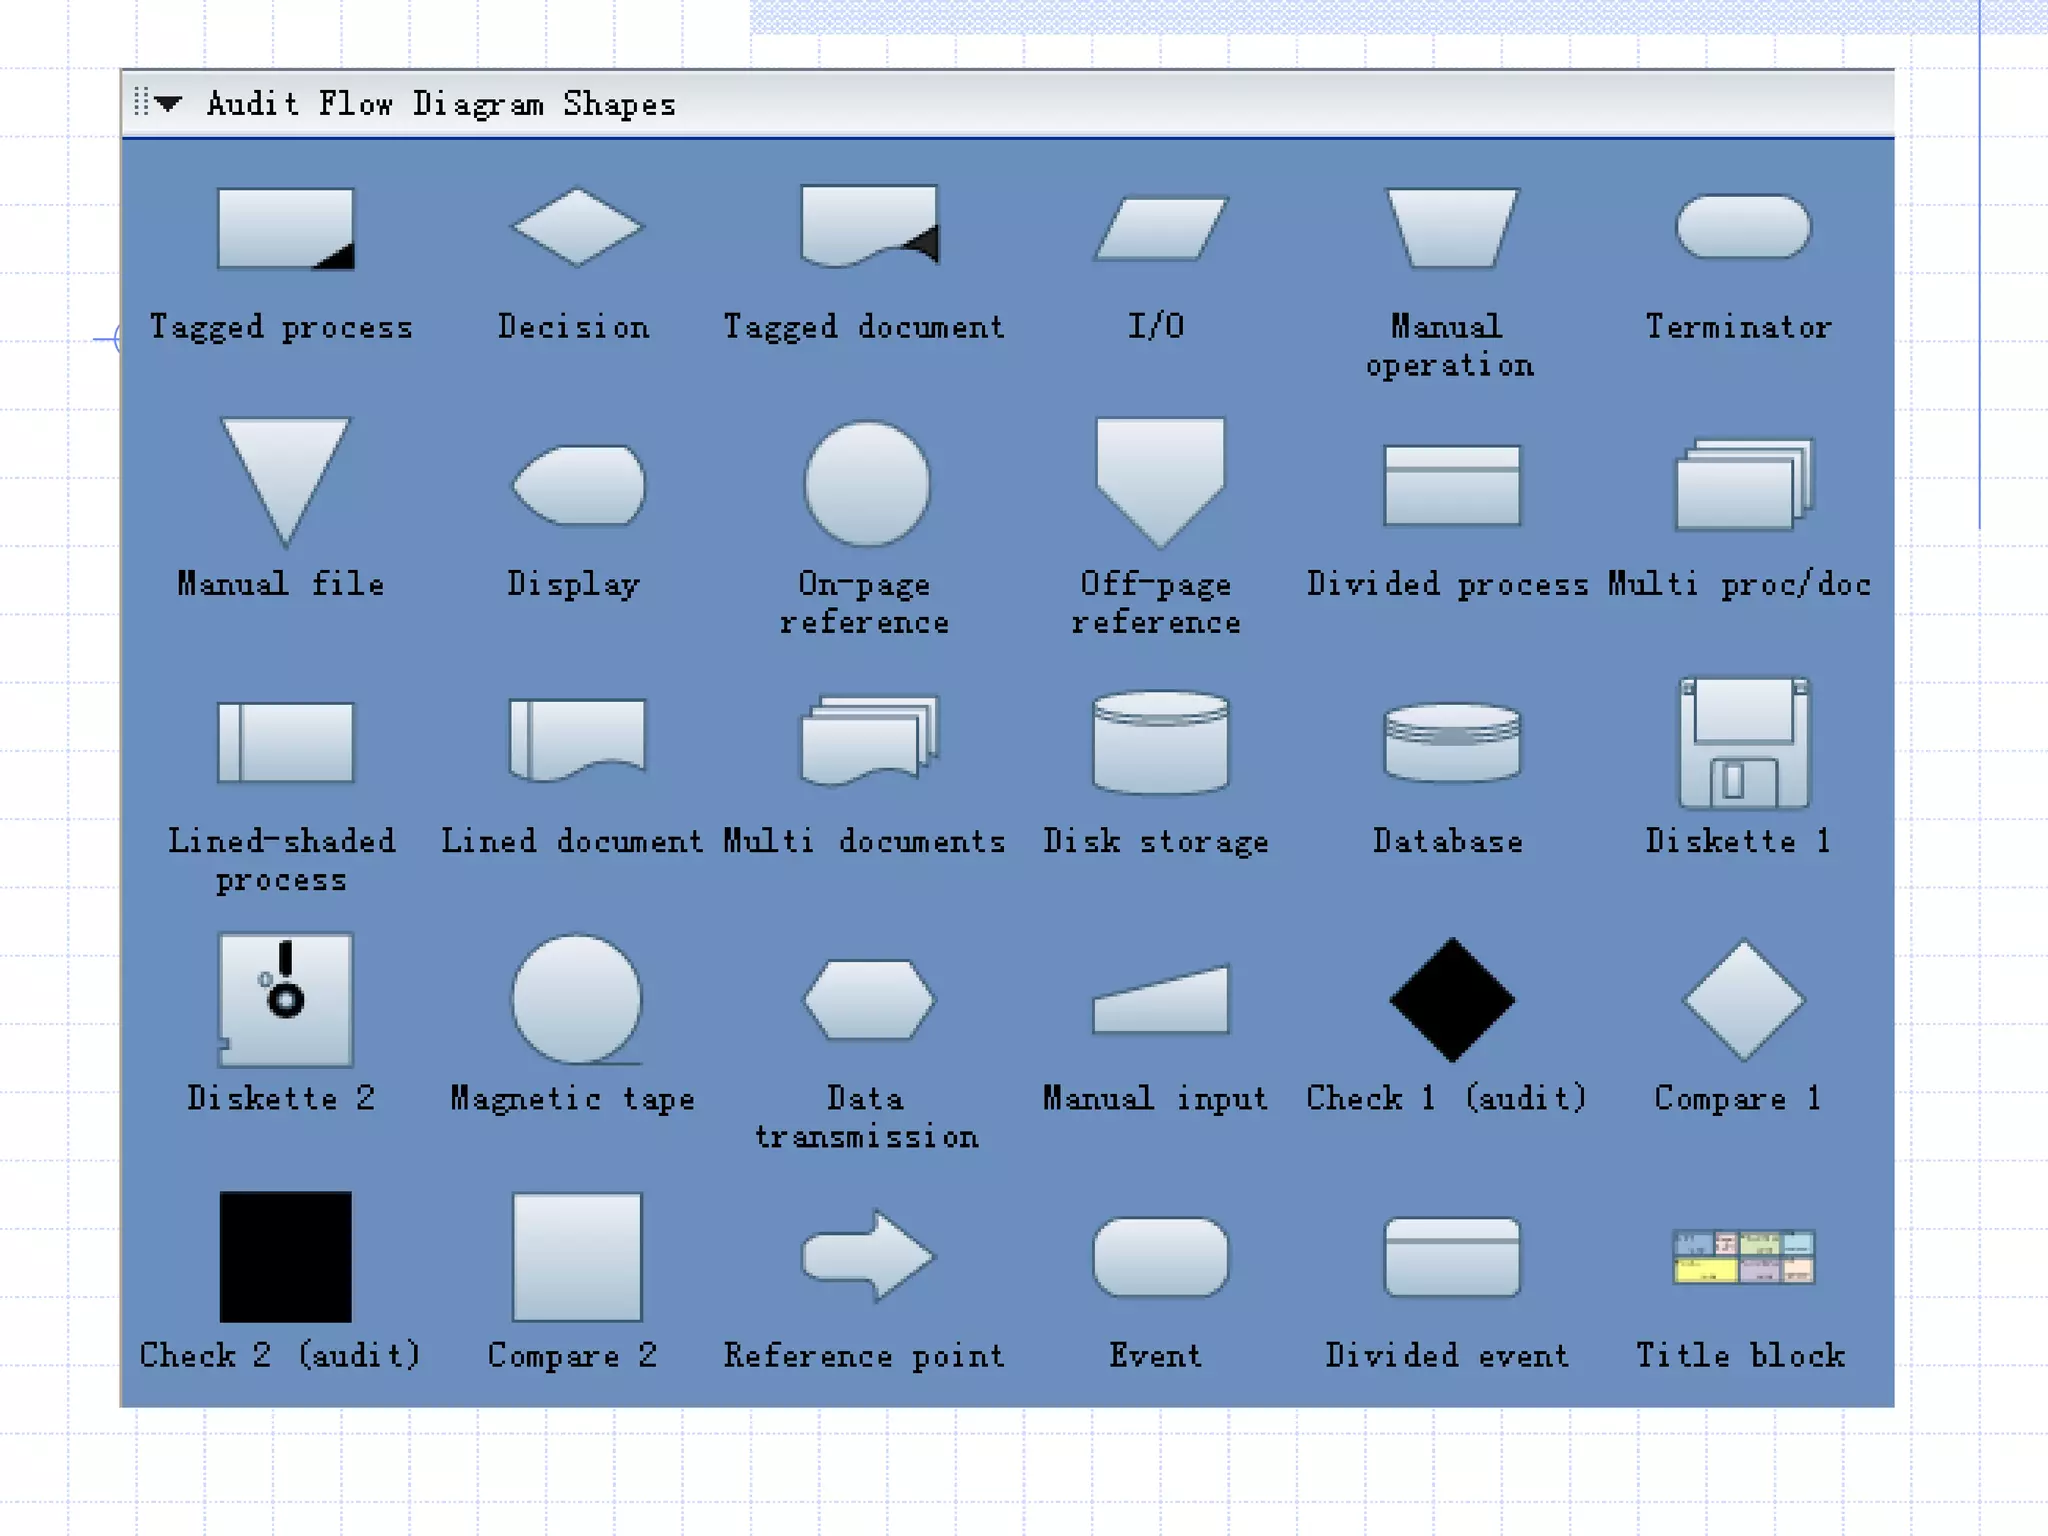
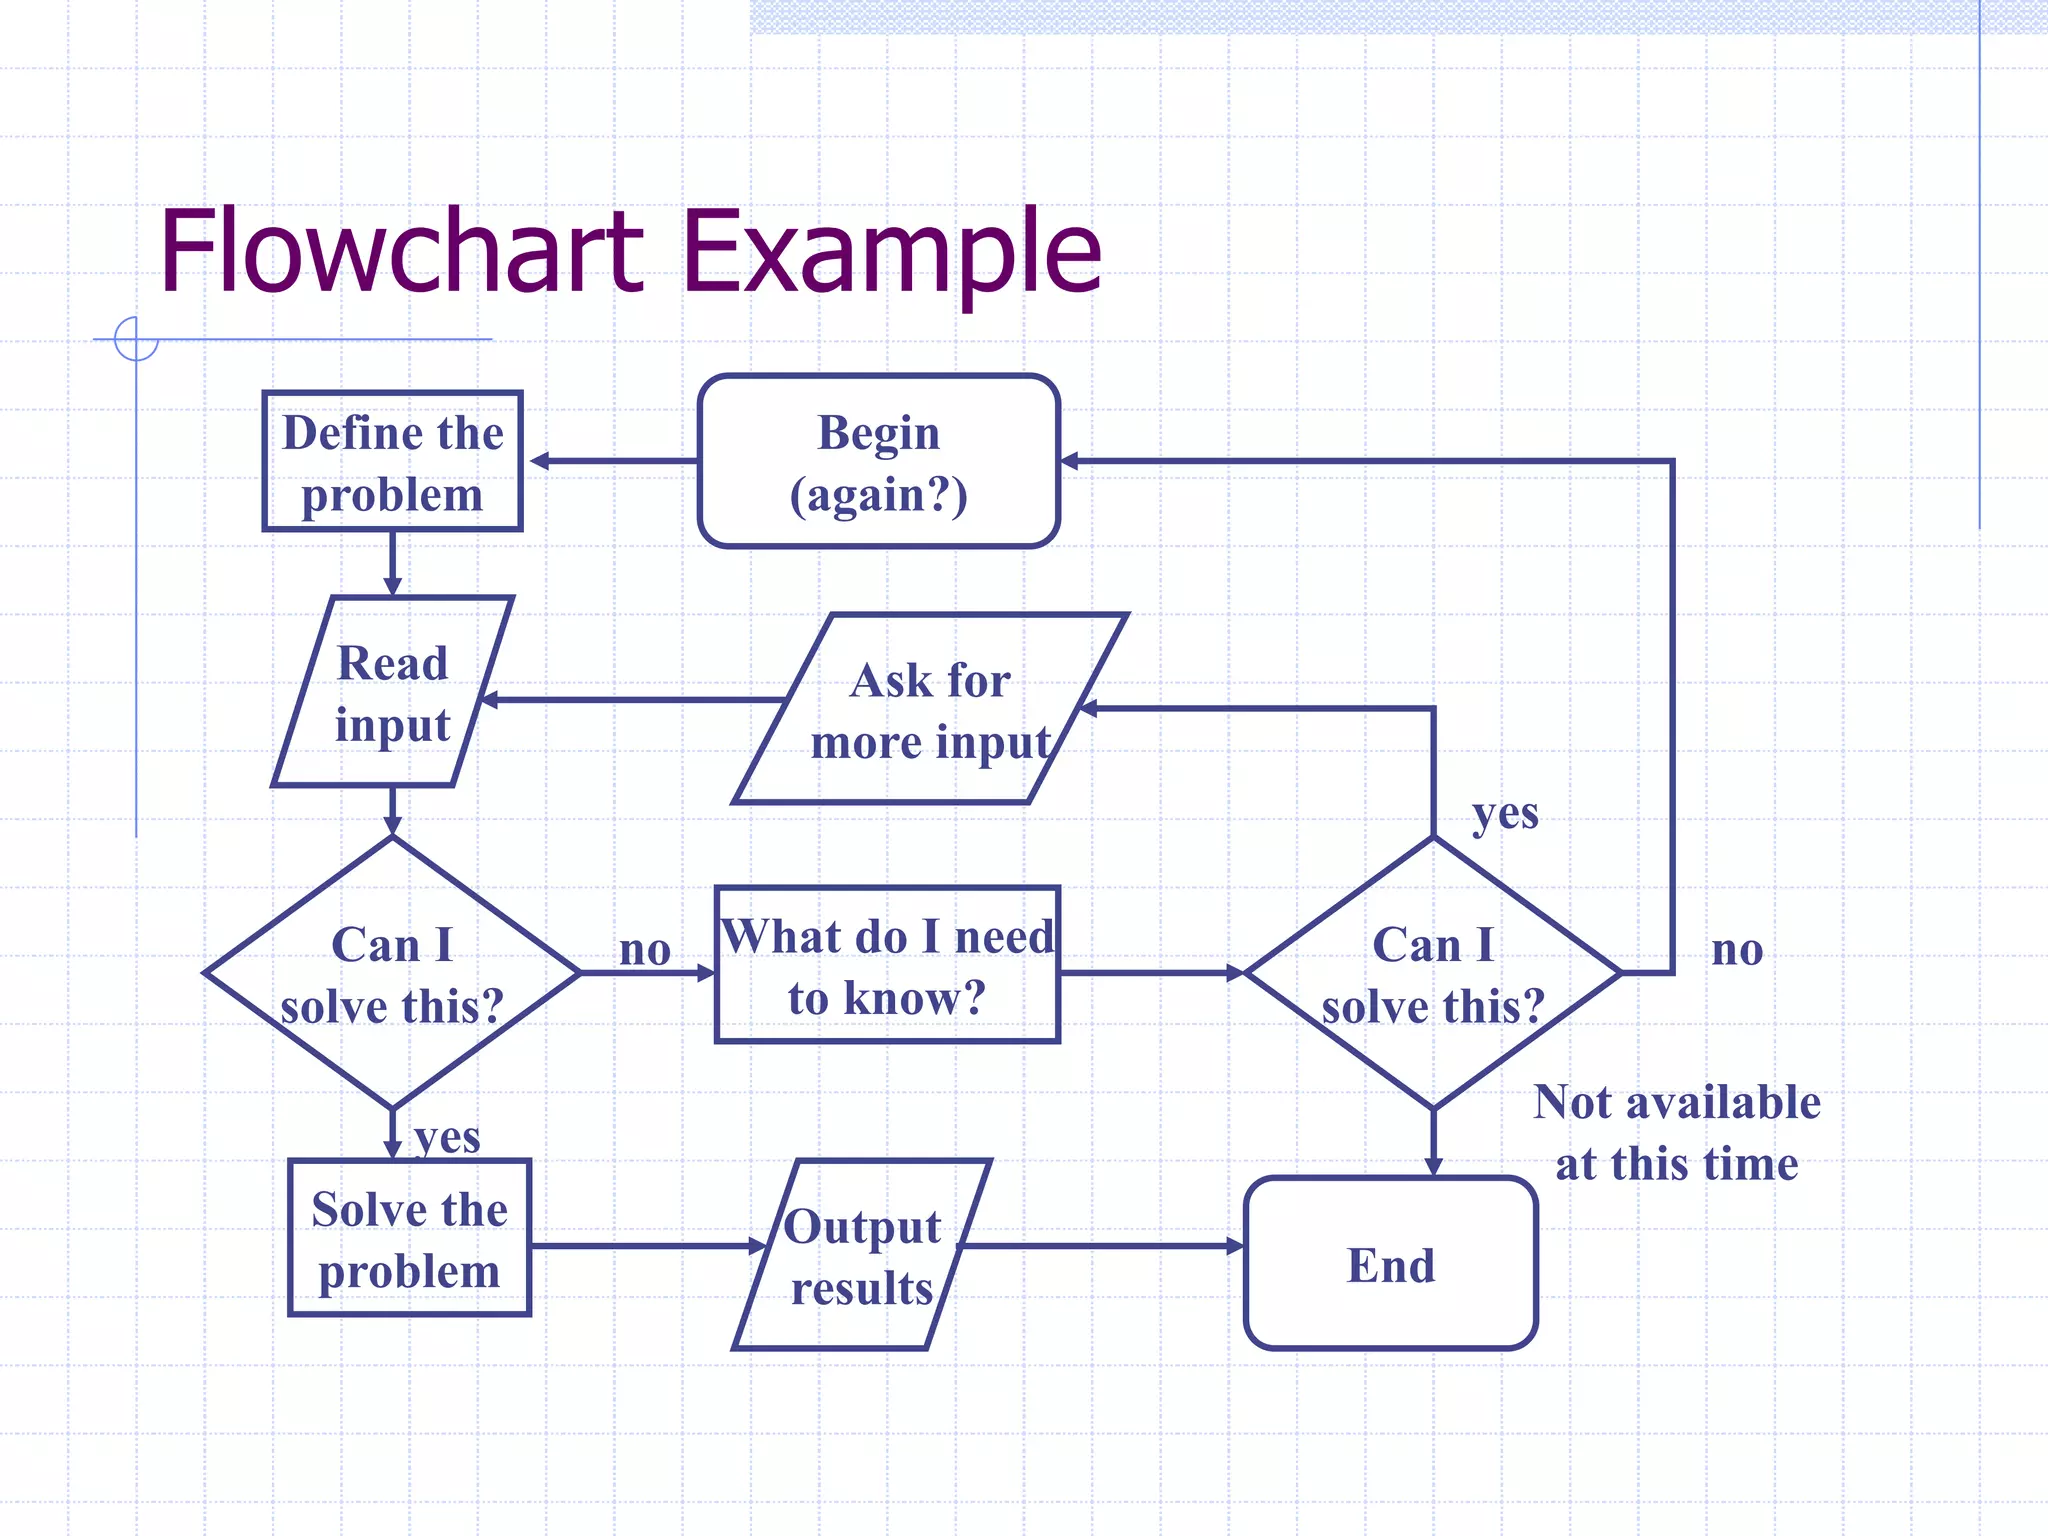
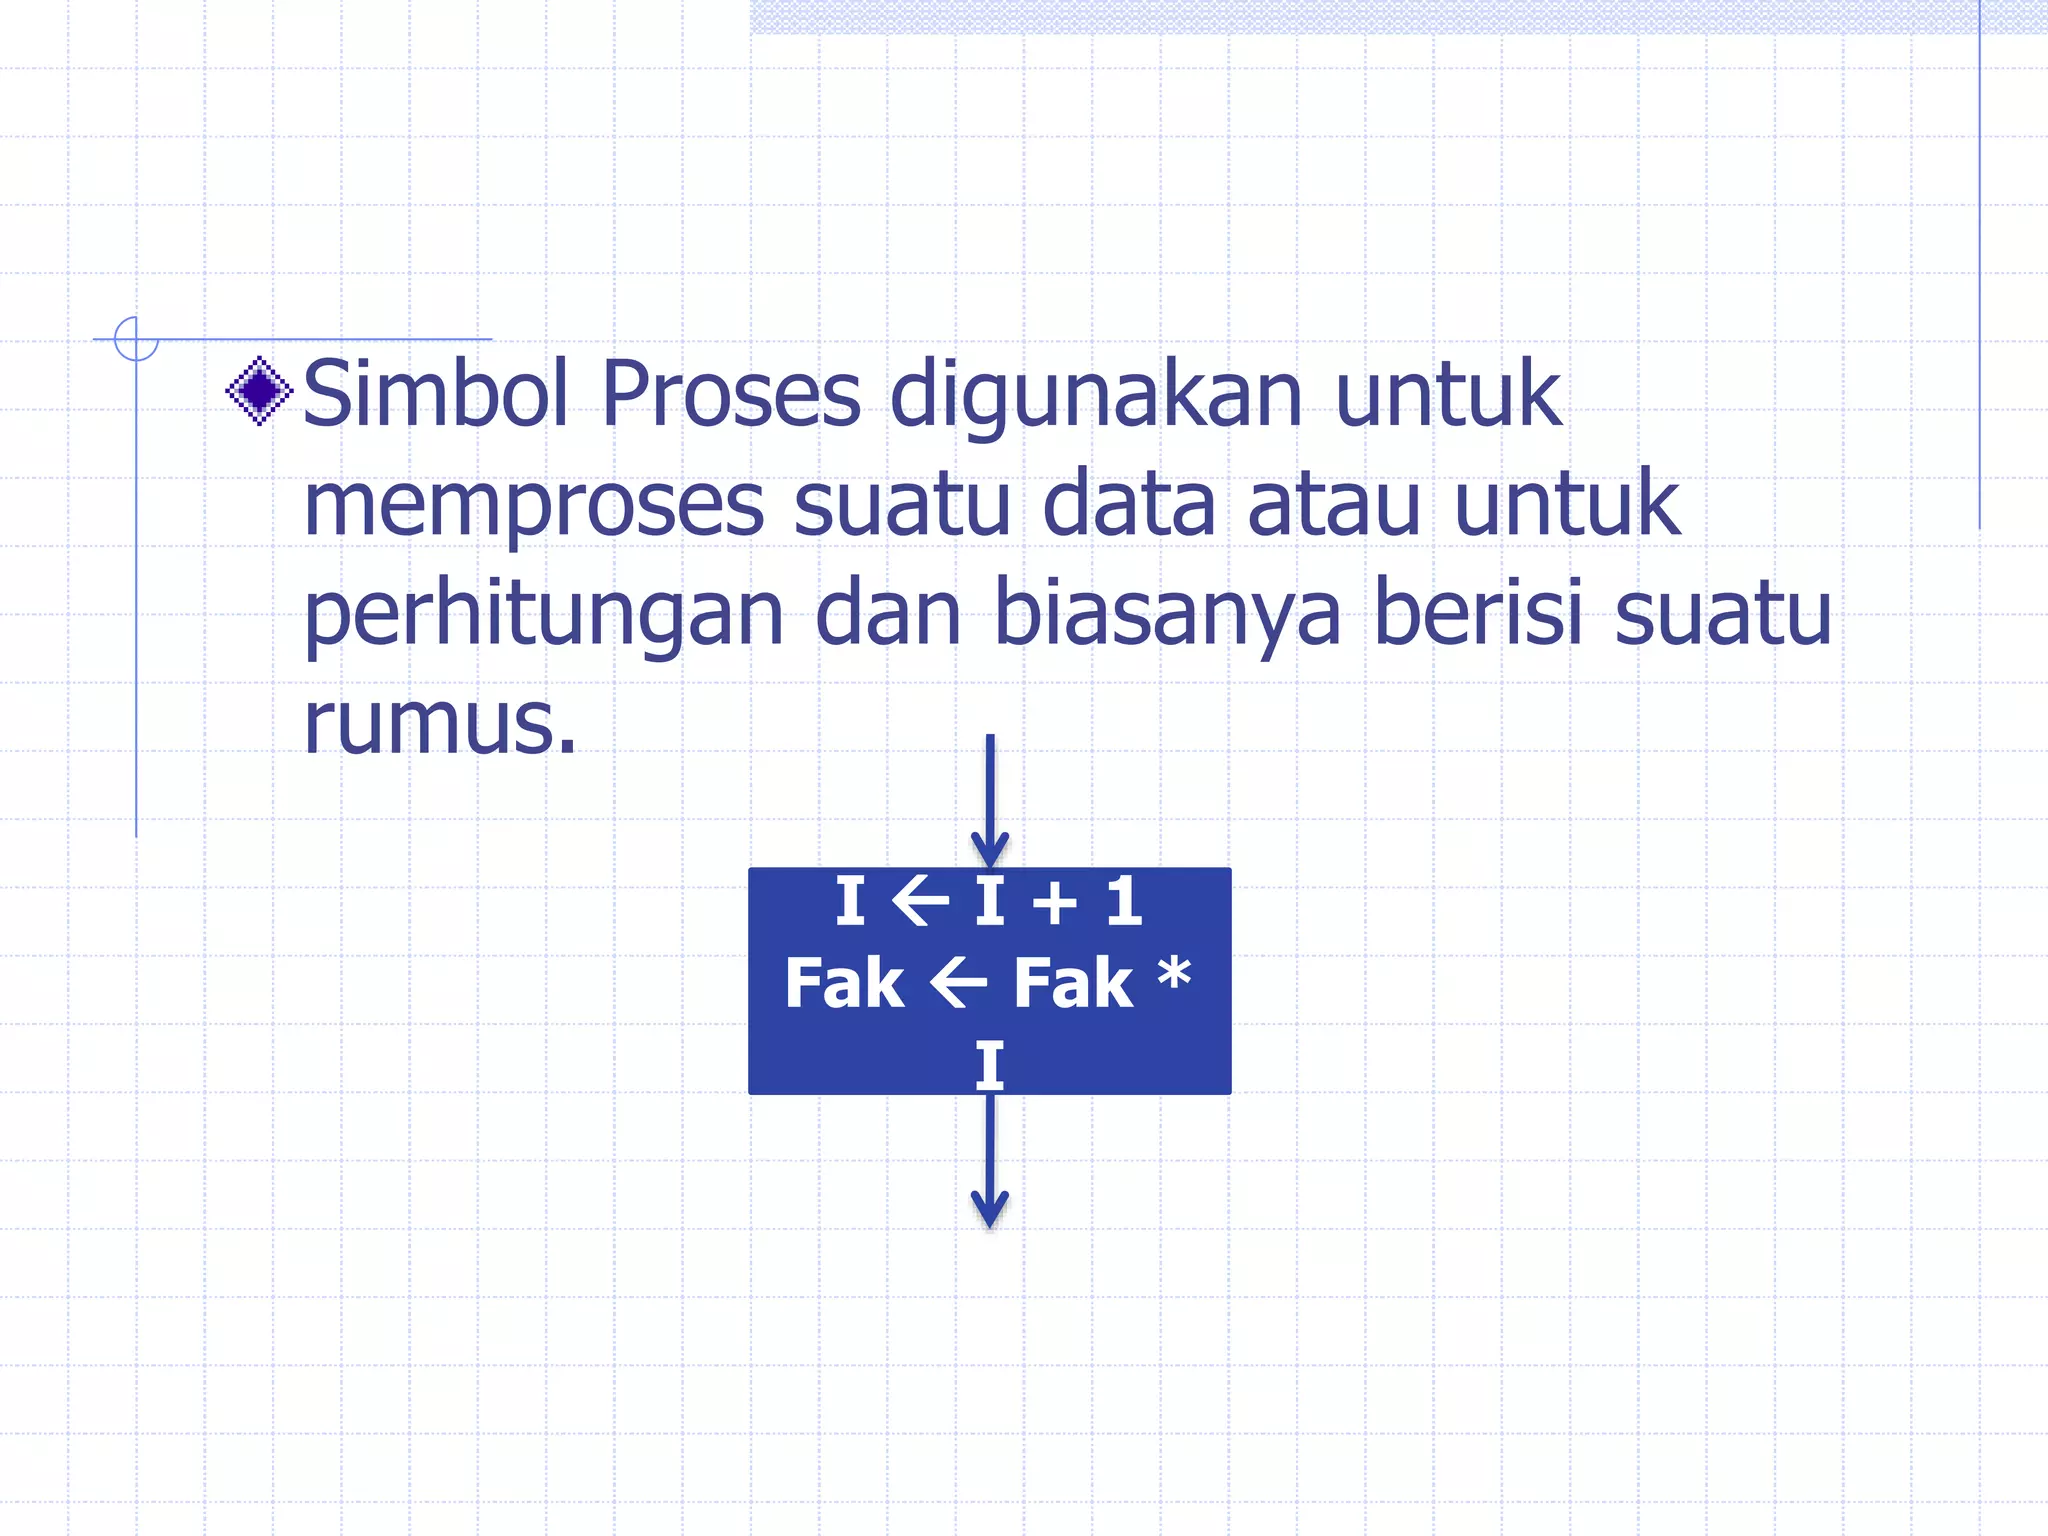
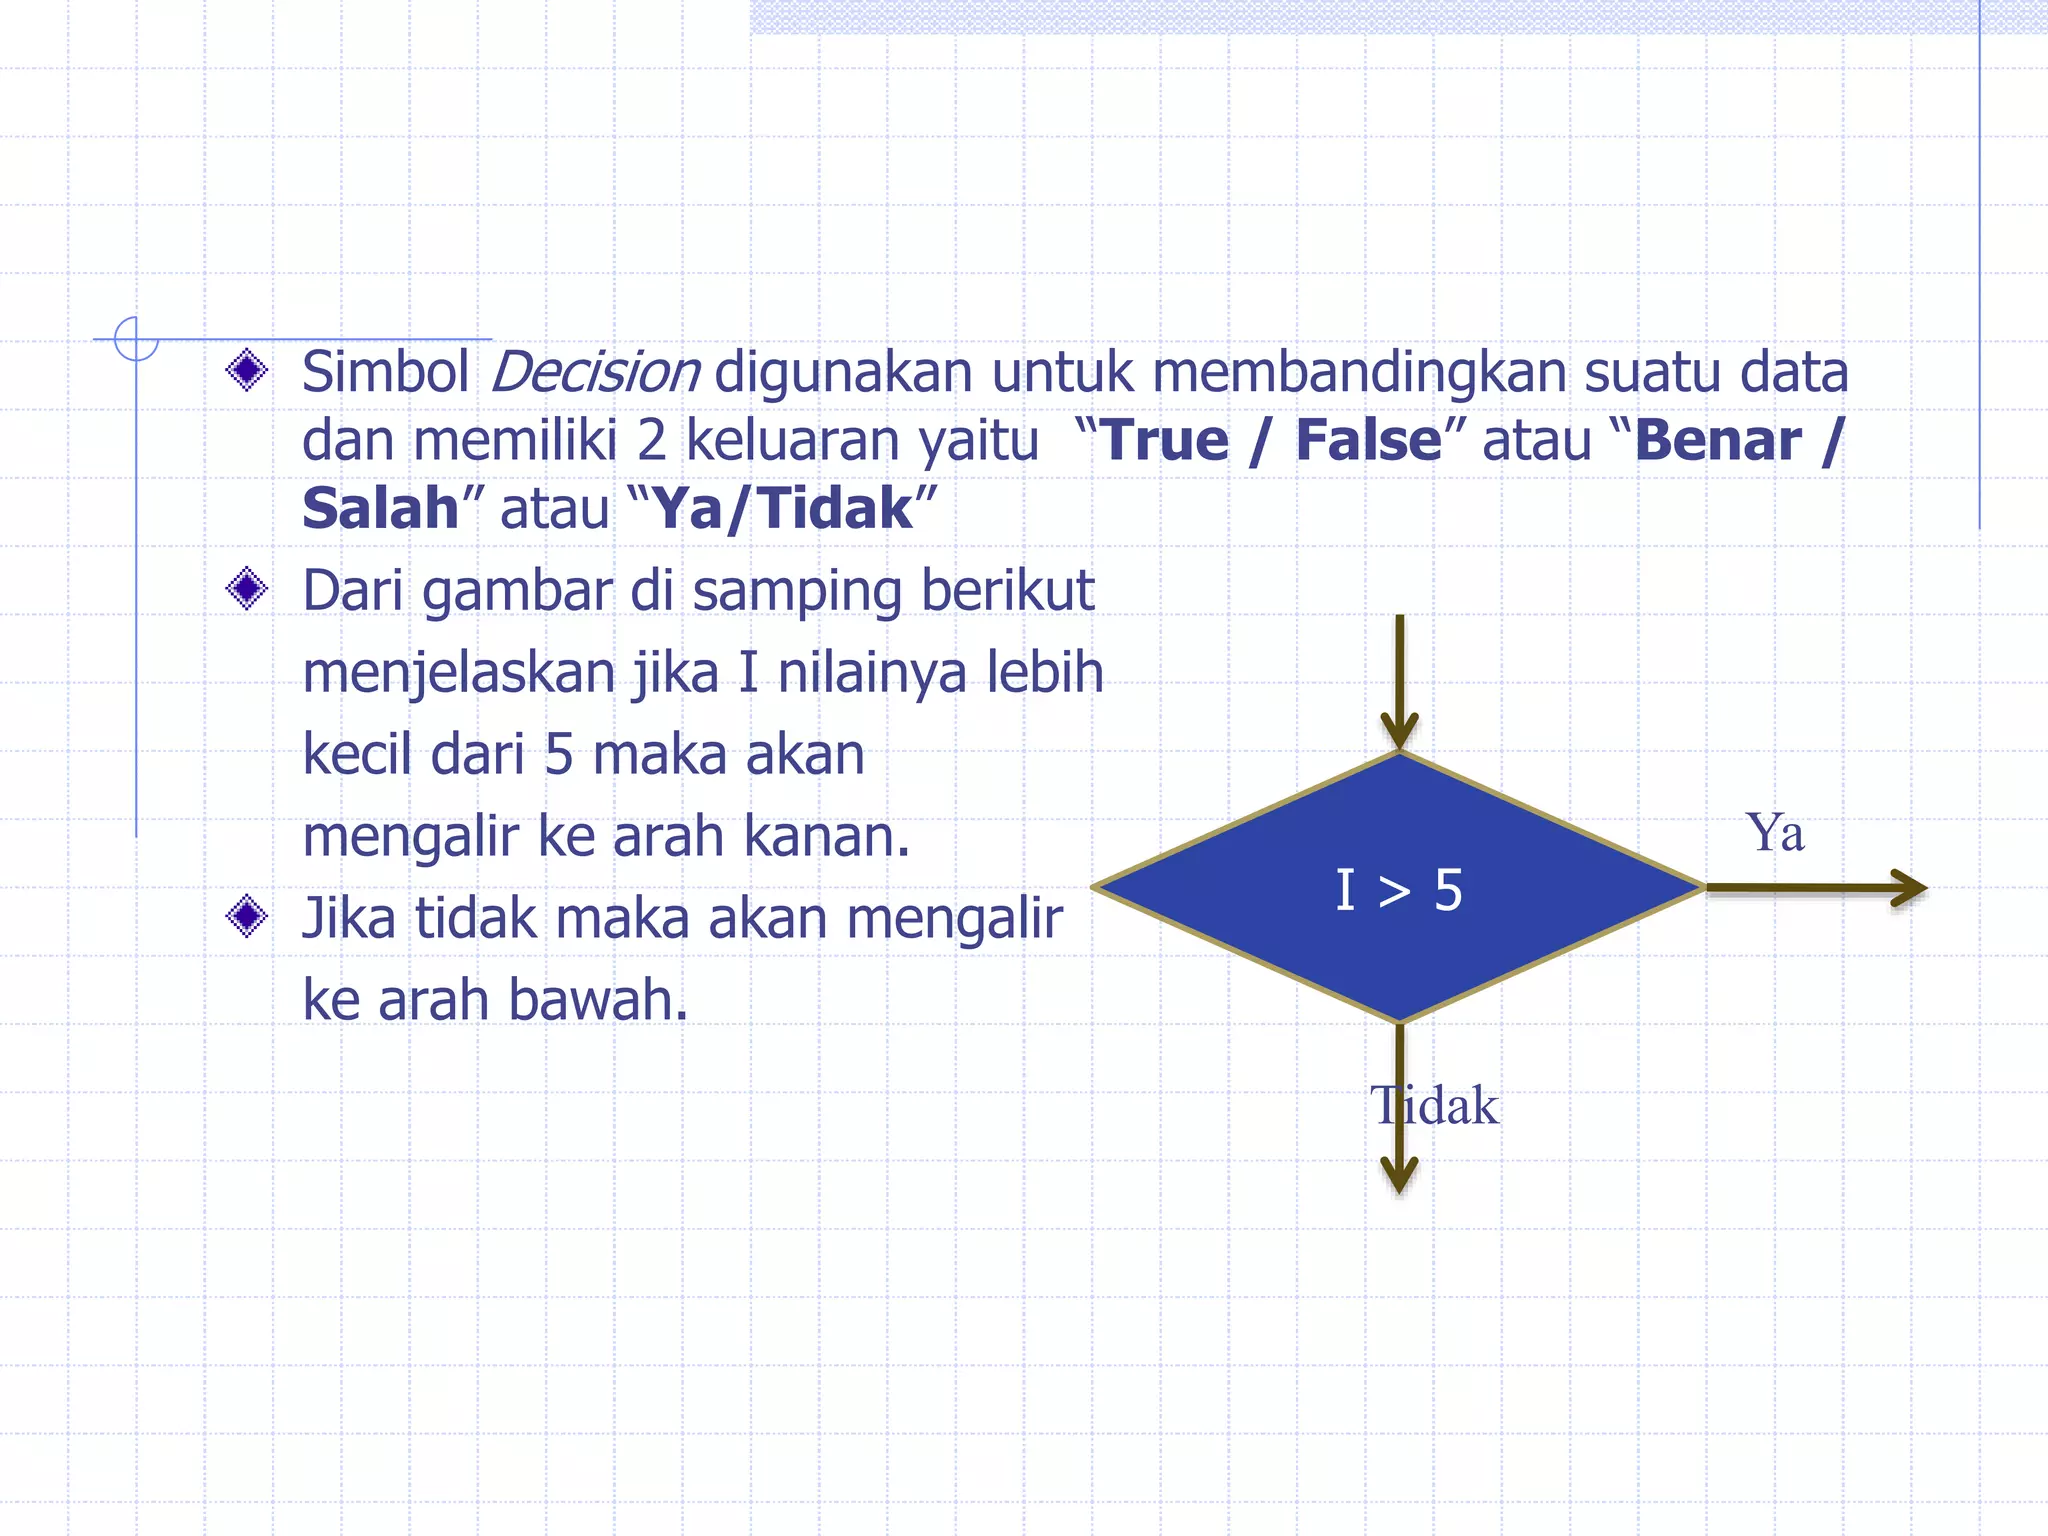
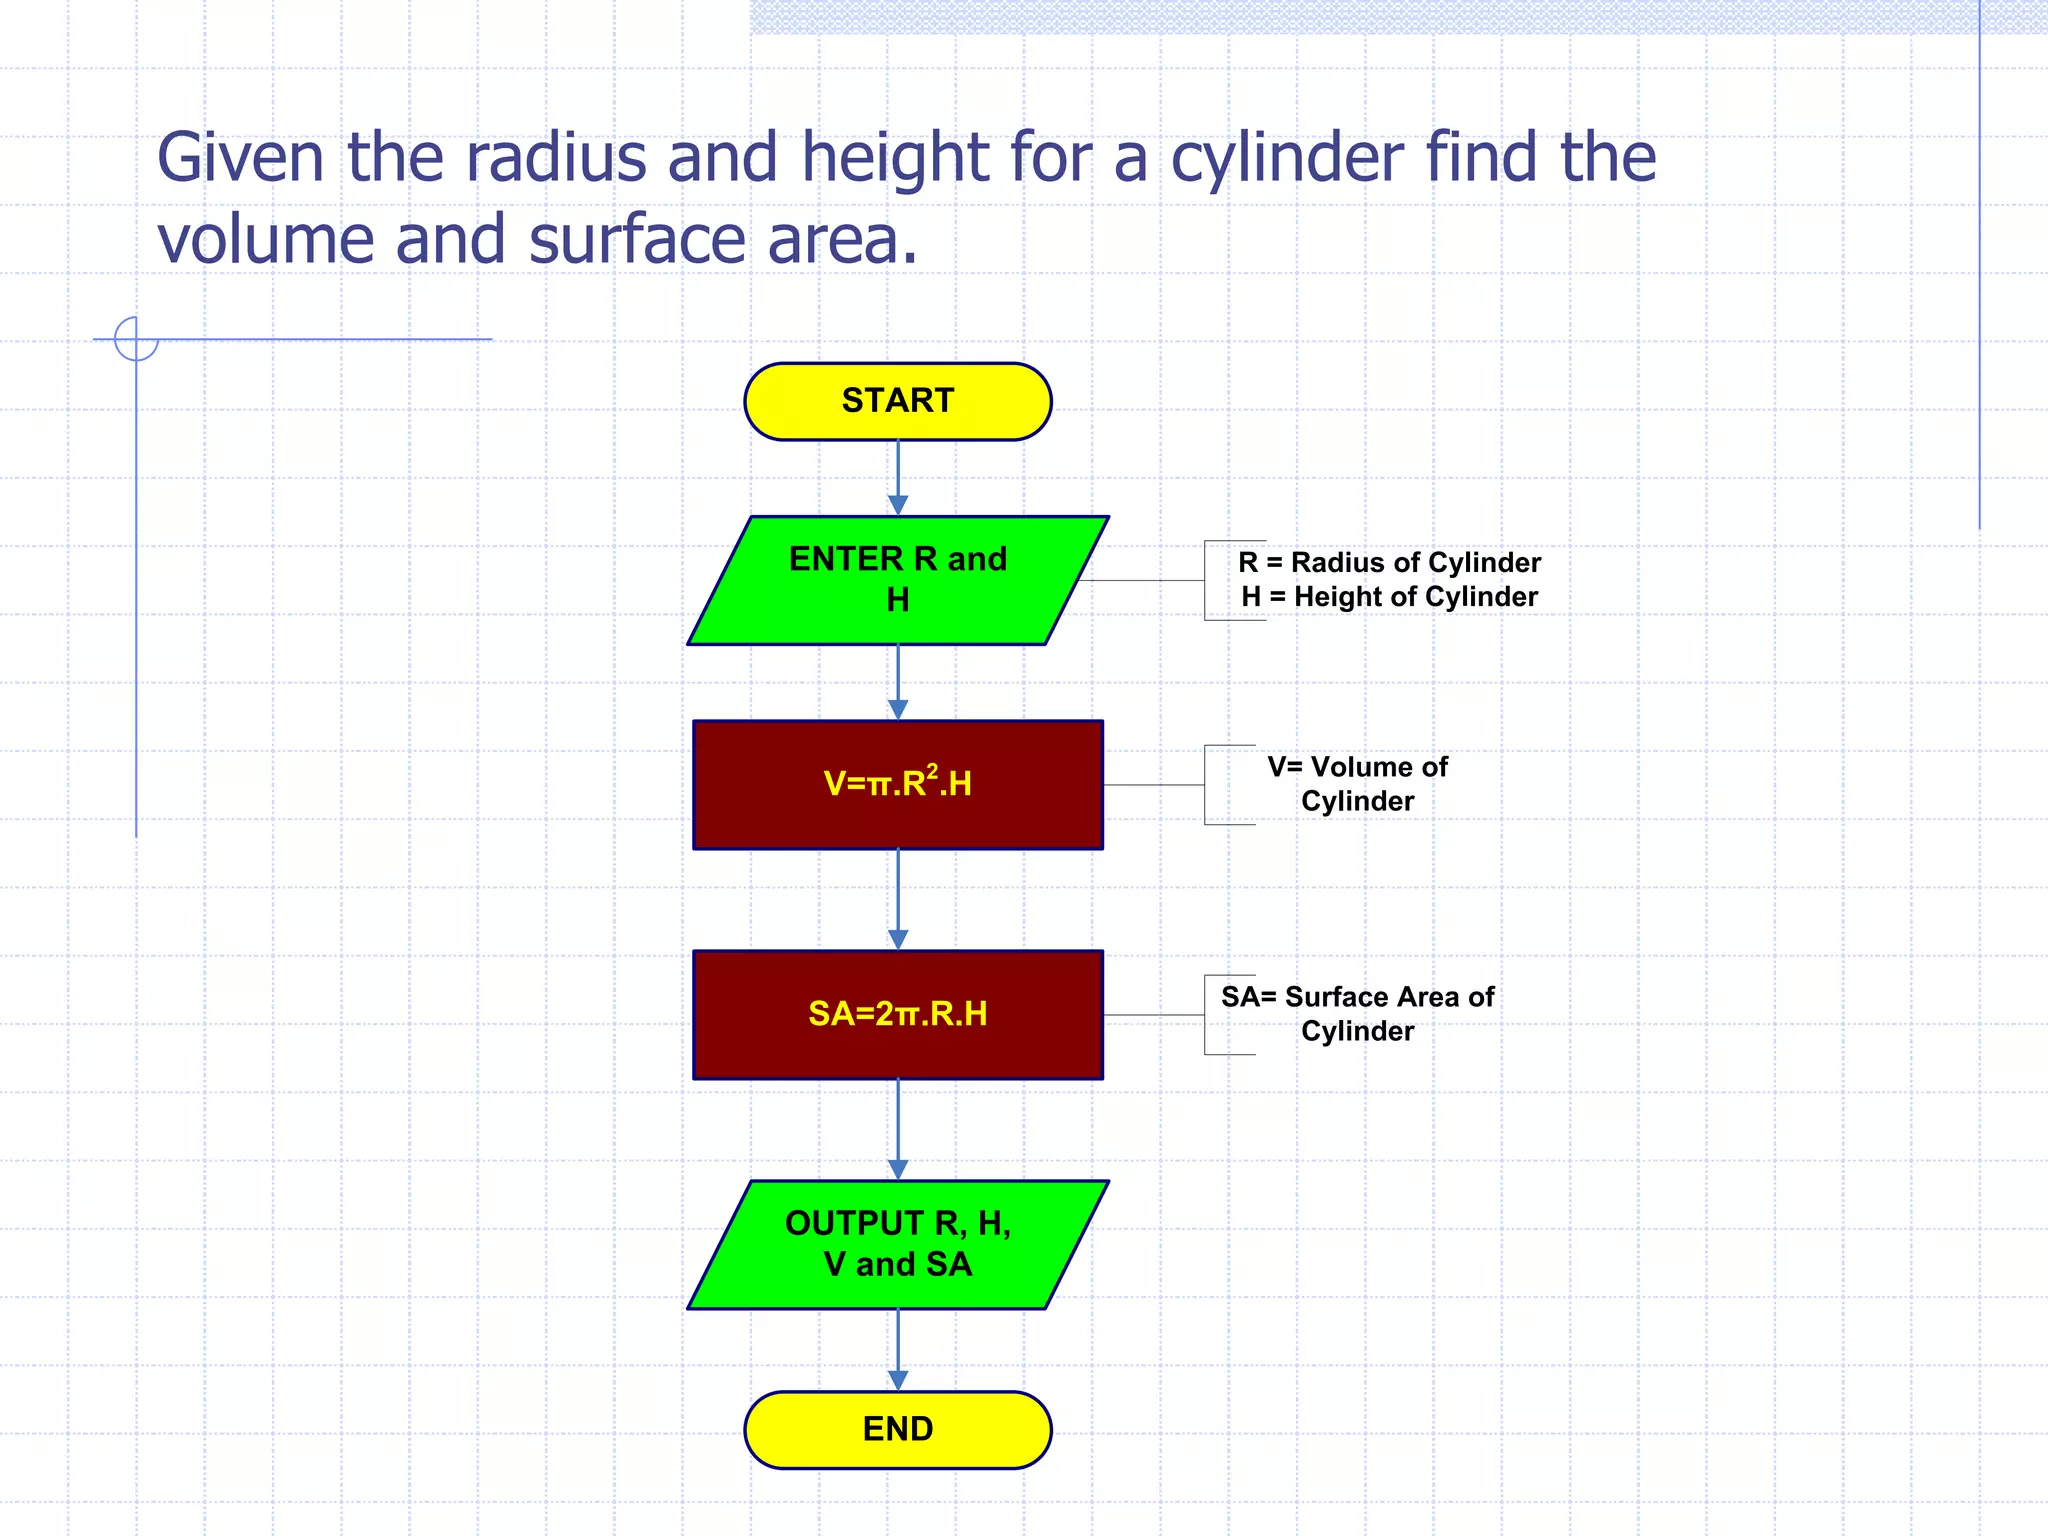
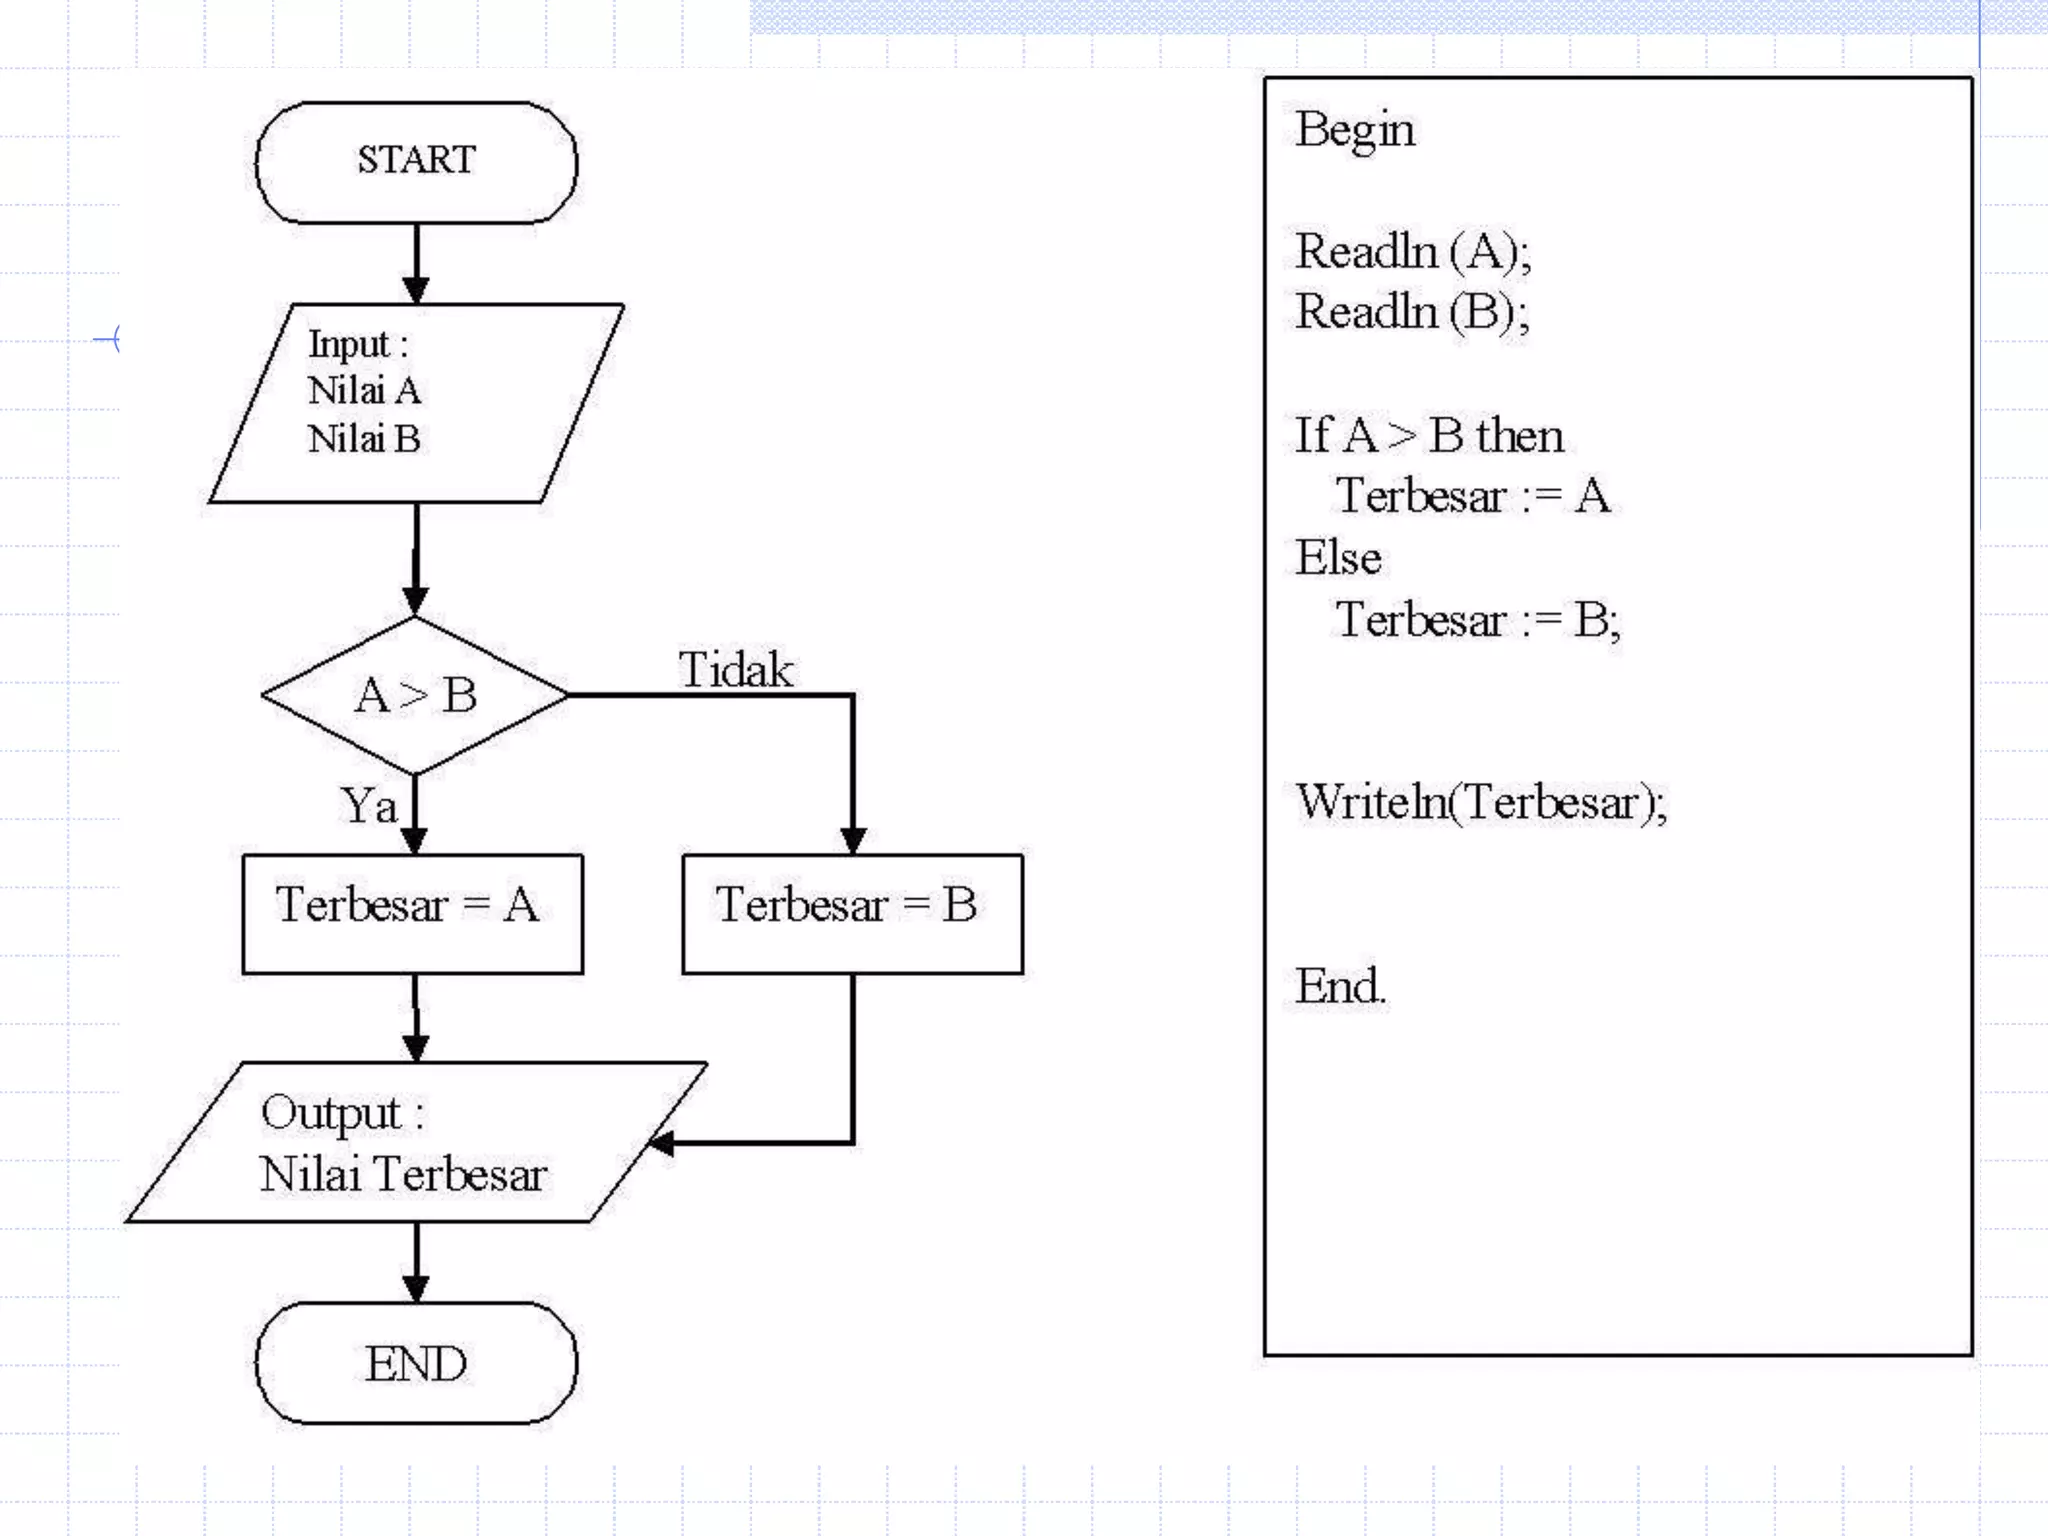


Dokumen ini membahas teknologi informasi, khususnya mengenai alur proses dan penggunaan flowchart dalam pemecahan masalah dengan komputer. Terdapat penjelasan tentang algoritma, flowchart, serta simbol-simbol yang digunakan dalam membuat flowchart, yang berfungsi untuk menggambarkan urutan langkah dalam memecahkan masalah. Flowchart juga dipandang sebagai alat yang efektif untuk memperjelas komunikasi antara programmer dan pengguna bisnis.


![Algoritma pemrograman-a[2]](https://cdn.slidesharecdn.com/ss_thumbnails/algoritma-pemrograman-a2-140219083743-phpapp02-thumbnail.jpg?width=640&height=640&fit=bounds)


