1. August 2012
Market Matters Table 1
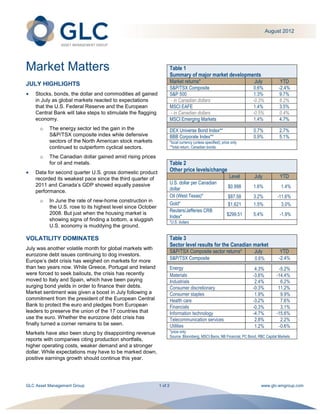
Summary of major market developments
JULY HIGHLIGHTS Market returns* July YTD
S&P/TSX Composite 0.6% -2.4%
Stocks, bonds, the dollar and commodities all gained S&P 500 1.3% 9.7%
in July as global markets reacted to expectations - in Canadian dollars -0.3% 8.2%
that the U.S. Federal Reserve and the European MSCI EAFE 1.4% 3.5%
Central Bank will take steps to stimulate the flagging - in Canadian dollars -0.5% 0.4%
economy. MSCI Emerging Markets 1.4% 4.7%
o The energy sector led the gain in the DEX Universe Bond Index** 0.7% 2.7%
S&P/TSX composite index while defensive BBB Corporate Index** 0.9% 5.1%
sectors of the North American stock markets *local currency (unless specified); price only
continued to outperform cyclical sectors. **total return, Canadian bonds
o The Canadian dollar gained amid rising prices
for oil and metals. Table 2
Data for second quarter U.S. gross domestic product Other price levels/change
recorded its weakest pace since the third quarter of Level July YTD
2011 and Canada’s GDP showed equally passive U.S. dollar per Canadian
dollar $0.998 1.6% 1.4%
performance.
Oil (West Texas)* $87.58 3.2% -11.6%
o In June the rate of new-home construction in
Gold* $1,621 1.5% 3.0%
the U.S. rose to its highest level since October
Reuters/Jefferies CRB
2008. But just when the housing market is
Index* $299.51 5.4% -1.9%
showing signs of finding a bottom, a sluggish *U.S. dollars
U.S. economy is muddying the ground.
VOLATILITY DOMINATES Table 3
Sector level results for the Canadian market
July was another volatile month for global markets with
S&P/TSX Composite sector returns* July YTD
eurozone debt issues continuing to dog investors.
S&P/TSX Composite 0.6% -2.4%
Europe’s debt crisis has weighed on markets for more
than two years now. While Greece, Portugal and Ireland Energy 4.3% -5.2%
were forced to seek bailouts, the crisis has recently Materials -3.6% -14.4%
moved to Italy and Spain, which have been paying Industrials 2.4% 6.2%
surging bond yields in order to finance their debts. Consumer discretionary -0.3% 11.2%
Market sentiment was given a boost in July following a Consumer staples 1.9% 9.9%
commitment from the president of the European Central Health care -3.2% 7.6%
Bank to protect the euro and pledges from European Financials -0.3% 3.1%
leaders to preserve the union of the 17 countries that Information technology -4.7% -15.6%
use the euro. Whether the eurozone debt crisis has Telecommunication services 2.8% 2.2%
finally turned a corner remains to be seen. Utilities 1.2% -0.6%
Markets have also been stung by disappointing revenue *price only
Source: Bloomberg, MSCI Barra, NB Financial, PC Bond, RBC Capital Markets
reports with companies citing production shortfalls,
higher operating costs, weaker demand and a stronger
dollar. While expectations may have to be marked down,
positive earnings growth should continue this year.
GLC Asset Management Group 1 of 2 www.glc-amgroup.com
2. August 2012
GROWTH SLOWS Encouraging news out of the U.S. includes an increase
in housing starts in June to its highest level in four years
Weak retail sales resulting from high unemployment held and a second quarter rise in exports of 5.3 per cent.
U.S. growth to an annual rate of only 1.5 per cent in the Housing starts in Canada remain solid although Canada
second quarter, down from 2.0 per cent in the first Mortgage and Housing Corporation tightened its
quarter. Growth for the second half of the year comes mortgage insurance rules in July, which are expected to
into question as a U.S. budget crisis and Europe’s contribute to a slowdown in the housing market.
financial difficulties continue to curtail business
investment and consumer spending despite historically
BEARS REPEATING
low interest rates.
Global equity markets did not respond bearishly to
United States Real GDP Growth bearish news in July. The bull market remains intact with
Quarterly Annualized (%) all markets gaining in the month and the S&P 500 index
up a healthy 9.7 per cent year-to-date. Most other major
4.5 4.1 global indices have also gained this year. Lagging its
4.0
3.5
global peers due to a greater leverage to resource
3.0 stocks, the S&P/TSX composite index has declined 2.4
2.5
2.5
2.0 per cent year-to-date.
2.0
1.5
1.5 1.3
1.0 REMAIN FOCUSED
0.5 0.1
0.0 The Canadian Olympic Committee has a strategy. They
Q1/11 2 3 4 Q1/12 2 are focused on ensuring that high-priority sports develop
Source: U.S. Bureau of Economic Analysis depth, so that every hope for a medal doesn’t come
down to one athlete. A well-diversified investment
Canada too seems headed along a path of sub-par
portfolio builds depth, so that every expectation for
growth with the economy growing at only 0.1 per cent in
growth doesn’t rest on one asset class. By including
May and forecast to grow at perhaps an optimistic 1.8
equities (with greater long-term upside potential) and
per cent in the second quarter. On the upside,
fixed income (with a tendency to take the edge off
Canadians are still willing to spend—retail sales
volatility and outperform when equity markets don’t), you
increased for the third straight month in May—and
can feel confident that you hold offsetting asset classes
employment is still trending higher.
to smooth out volatility as you aim to achieve your
financial goals.
Canada Real GDP Growth
Quarterly Annualized (%)
GROSS NATIONAL HAPPINESS INDEX
5.0 4.5
4.0 3.6
The tiny, remote Himalayan kingdom of Bhutan has a
Est.
GNH index that measures gross national happiness.
3.0
1.9 1.9 1.8 Instead of relying on GDP (gross domestic product),
2.0
which is based on a nation’s economic activity, Bhutan
1.0
considers GNH, a measure of its people’s sense of
0.0
being well-governed, their relationship with the
-1.0
-1.0 environment, satisfaction with the pace of economic
-2.0 development, and a sense of cultural and national
Q1/11 2 3 4 Q1/12 2
belonging.
Source: Statistics Canada
Copyright GLC, You may not reproduce, distribute, or otherwise use any of this article without the prior written consent of GLC Asset Management Group
The views expressed in this commentary are those of GLC Asset Management Group Ltd. (GLC) as at the date of publication and are subject to
change without notice. This commentary is presented only as a general source of information and is not intended as a solicitation to buy or sell
specific investments, nor is it intended to provide tax or legal advice. Prospective investors should review the offering documents relating to any
investment carefully before making an investment decision and should ask their advisor for advice based on their specific circumstances.
GLC Asset Management Group 2 of 2 www.glc-amgroup.com