1. Volvo Truck Operations Asia Sales, Malaysia Region
Business Development
1 May 18, 2012
The Business Case for Fleet Renewal
By Manish Bhatnagar
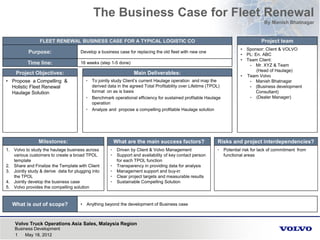
FLEET RENEWAL BUSINESS CASE FOR A TYPICAL LOGISTIC CO
Purpose:
What is out of scope?
Project Objectives: Main Deliverables:
Project team
Risks and project interdependencies?
• Propose a Compelling &
Holistic Fleet Renewal
Haulage Solution
• To jointly study Client’s current Haulage operation and map the
derived data in the agreed Total Profitability over Lifetime (TPOL)
format on as is basis
• Benchmark operational efficiency for sustained profitable Haulage
operation
• Analyze and propose a compelling profitable Haulage solution
• Sponsor: Client & VOLVO
• PL: En. ABC
• Team Client:
- Mr. XYZ & Team
(Head of Haulage)
• Team Volvo
- Manish Bhatnagar
- (Business development
Consultant)
- (Dealer Manager)
Develop a business case for replacing the old fleet with new one
• Anything beyond the development of Business case
Time line: 16 weeks (step 1-5 done)
• Potential risk for lack of commitment from
functional areas
What are the main success factors?
• Driven by Client & Volvo Management
• Support and availability of key contact person
for each TPOL function
• Transparency in providing data for analysis
• Management support and buy-in
• Clear project targets and measurable results
• Sustainable Compelling Solution
Milestones:
1. Volvo to study the haulage business across
various customers to create a broad TPOL
template
2. Share and Finalize the Template with Client
3. Jointly study & derive data for plugging into
the TPOL
4. Jointly develop the business case
5. Volvo provides the compelling solution
2. Volvo Truck Operations Asia Sales, Malaysia Region
Business Development
Client’s Current Business
Total Profitability over lifetime (TPOL) – using old fleet
– As is situation analysis
o Profitability evolution
o Revenue and cost summary 6th year
o Fuel a major cost contributor
o Key findings and improvement areas
Total Profitability over lifetime (TPOL) – using new fleet
– Profitability evolution compounded over 10 years
o Categorized – Long / Medium / Short haul
Renewal with Zero investment
2 May 18, 2012
Presentation Outline
3. Volvo Truck Operations Asia Sales, Malaysia Region
Business Development
3 May 18, 2012
Client’s Business
Container Haulage
TYPE
TRIPS
/DAY
DISTANCE
TRAVELED
/TRIP
FUEL
CONSUMPTION
Km/L
REVENUE
PER TRIP
MYR
NO OF
TRUCKS
R/KM
MYR
%
BUSINESS
SHORT HAUL 3 52 1.82 235 19 4.52 40
MEDIUM HAUL 2.5 130 2.05 530 18 4.08 40
LONG HAUL 2 270 2.28 700 9 2.59 20
The present study is done based on units operations
located at one location
The container haulage business is subdivided into three
categories:-
The Fuel consumption is symptomatic of the type of Haulage in the current year
4. Volvo Truck Operations Asia Sales, Malaysia Region
Business Development
The no of working days have been taken as 26 with staggered decrease to 18 days from 1st to 6th Year of operation
respectively (Decrease in Uptime over the Timeline)
The Fuel cost has been kept fixed at RM1.8
The Fuel consumption has been increased by 3% every year which is inline with 6th yr Figures
The Tyre cost has been kept as 0.28 RPK (As per earlier outsource agreement)
The driver incentive per trip has been kept current and same over the timeline
Monthly Maintenance cost has been taken at a base value of 16CPK with staggered annual escalation of (7.5, 12.5, 15,
20, 25 %) over 8 Years
For estimating the Finance cost :- Hire Purchase route @ 80% finance has been followed
Tenure 60 months, at 3% Simple Interest Per Annum
The Investment Tax allowance has been taken at 25%
4 May 18, 2012
Client’s Total Profitability over Lifetime (TPOL)
Key Assumptions
5. Volvo Truck Operations Asia Sales, Malaysia Region
Business Development
TPOL business-mapping snapshot for Long-haul category
5 May 18, 2012
Client’s TPOL
Timeline:- 1st Year to current 6th Year operations
6. Volvo Truck Operations Asia Sales, Malaysia Region
Business Development
6 May 18, 2012
TPOL
Profitability evolution over 10 yrs
-35.00
-30.00
-25.00
-20.00
-15.00
-10.00
-5.00
0.00
5.00
10.00
15.00
20.00
1 2 3 4 5 6 7 8 9 10
LONG HAUL
LONG HAUL AS IS
-10.00
-5.00
0.00
5.00
10.00
15.00
20.00
25.00
30.00
35.00
1 2 3 4 5 6 7 8 9 10
MEDIUM HAUL
MEDIUM HAUL AS IS
-35.00
-30.00
-25.00
-20.00
-15.00
-10.00
-5.00
0.00
5.00
10.00
15.00
20.00
1 2 3 4 5 6 7 8 9 10
SHORT HAUL
SHORT HAUL AS IS
• Sharp Fall in profitability from Year 3
• Root cause is low-uptime
• Rise in Fuel Consumption
7. Volvo Truck Operations Asia Sales, Malaysia Region
Business Development
DESCRIPTION LONG HAUL MEDIUM HAUL SHORT HAUL
REVENUE 25200 23850 12690
BUSINESS COST 25468 17434 10815
PROFITABILITY (%) -1.06% 26.9% 14.78%
7 May 18, 2012
6th Year Operation
Revenue & Cost
The uptime has decreased by 30% over 6 years from 26 days to 18 days
MAIN COST DRIVERS
AVAILABLE WORKING DAYS 18 18 18
FUEL COST 7957 (31%) 5310 (22%) 2874 (22%)
DRIVER COST 4073 (16%) 3468 (14%) 2742 (21%)
MAINTENANCE COST 3880 (15%) 2335 (10%) 1121 (9%)
OVER HEADS 8% 8% 8%
8. Volvo Truck Operations Asia Sales, Malaysia Region
Business Development
8 May 18, 2012
Fuel Study (Short Haul)
At One Location
Km/Ltr
Short Haul
Figures are for the Month of
Jan, Feb, March
Figures derived from 13
Prime Movers dedicated for
short haul
The highest Fuel
Consumtion has been 1,02
Km/Ltr
The lowest Fuel
Consumption has been 3,03
Km/Ltr
The Average Fuel
Consumption has been 1.94
Km/Ltr
The Dispersion in Fuel
consumption is too high
-
0.50
1.00
1.50
2.00
2.50
3.00
3.50
0 5 10 15 20 25 30 35 40 45
9. Volvo Truck Operations Asia Sales, Malaysia Region
Business Development
FINDINGS
Huge dispersion in fuel
cost
The driver cost is
relatively higher
compared to Industry
standard
Maintenance cost
shows a steep
increase from Year 6
Low vehicle uptime
and sliding further
9 May 18, 2012
Key findings and improvement areas
IMPROVEMENT AREAS
Potential Pilferage of fuel
Higher downtime
Driver accountability, The driver
remuneration is only linked with trips not
Fuel consumption
Driver training needs
Higher rate of rise in maintenance costs
After the 3rd year the operation starts
becoming more and more non-profitable
10. Volvo Truck Operations Asia Sales, Malaysia Region
Business Development
10 May 18, 2012
TPOL – using new fleet
RENEW THE FLEET EVERY 5 YEARS
Uptime Figures based on top quartile
Fuel Consumption based on past averaging and has been kept
conservative
THE NEW TPOL WITH ZERO INVESTMENT MODEL
11. Volvo Truck Operations Asia Sales, Malaysia Region
Business Development
11 May 18, 2012
Profitability over 10 Years Timeline
Long haul Business
Renew Fleet on a 5 year cycle
-35.00
-30.00
-25.00
-20.00
-15.00
-10.00
-5.00
0.00
5.00
10.00
15.00
20.00
1 2 3 4 5 6 7 8 9 10
LONG HAUL AS IS LONG HAUL ZE-IN
12. Volvo Truck Operations Asia Sales, Malaysia Region
Business Development
12 May 18, 2012
Profitability over 10 Years Timeline
Medium Haul Business
Renew Fleet on a 5 year cycle
-10.00
-5.00
0.00
5.00
10.00
15.00
20.00
25.00
30.00
35.00
1 2 3 4 5 6 7 8 9 10
MEDIUM HAUL AS IS MEDIUM HAUL ZE-IN
13. Volvo Truck Operations Asia Sales, Malaysia Region
Business Development
13 May 18, 2012
Profitability over 10 Years Timeline
Short Haul Business
Renew Fleet on a 5 year cycle
-35.00
-30.00
-25.00
-20.00
-15.00
-10.00
-5.00
0.00
5.00
10.00
15.00
20.00
1 2 3 4 5 6 7 8 9 10
SHORT HAUL AS IS SHORT HAUL ZE-IN