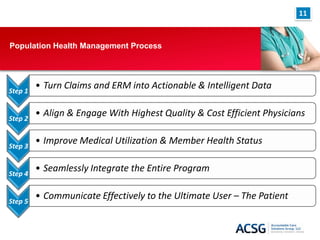
CFO Breakfast - March 23, 2012


Model for Population Health Management with Quantifiable Results and
Optimal Gain Sharing Potential

Jack Hill, Executive Vice President & Partner
Agenda


1. The Current Health Care
   Environment
2. Population Health
   Management Process
3. Proven Results
4. Why You Should Care
5. Opportunities for
   Commercial ACO
   Deployment
3


The Current Health Care Environment


 Reform is Here and We
 Have to Deal with It
4


The Current Health Care Environment


 The Patient Has to be
 Engaged
5


The Current Health Care Environment


 The Political
 Landscape is Rife with
 Challenges
6


The Current Health Care Environment


 The Train Has Left the
 Station – Reform for
 Medical Providers is in
 Play and Population
 Health Management
 should be THE Primary
 Objective
7


The Current Health Care Environment
8


The Current Health Care Environment


    Patient /Payor Shifts


                                  Payment Reductions/
                                  Changes
9


The Changing Health Care Environment
10


Population Health Management Process


                       *                                     * Step Down
                                              Employer
          On-site            Data
                                               Benefit            UM
          Testing          Warehouse
                                              Consulting      Management


                            Data Drill                            Ongoing
   Gain Sharing                                Employer
                             Down                                Educational
    Formulas                                   Stop Loss
                           Capabilities                          Resources
                                                                                     Community Healthcare
                       *                         Small          Health
                                                                                          Partner


                                                                               =
        Physician          Geographic          Employer
        Profiling          Benchmarks          Financial         Risk
                                                Targets      Assessments
                                                                                       Delivery of Quality
   *                   *                  *
        Predictive          Episodic
                                              Recognition
                                              of High Cost       Wellness                   Healthcare
        Modeling            Analysis                             Programs
                                                Patients
                                                                                   Controlled Healthcare Costs
   *
     Chronic
                       * Treatment              Member            Personal             Healthier Members
                          Criteria             Incentive           Health
     Disease            Compliance             Program            Records
   Management


    Structural         *                  *                  *
                        Professional          Employee            Employer
   Organization          Telephonic           Healthcare          Healthcare
      Phys             Nurse Coaching          Indexing            Indexing
    Hosp/etc


       Gain Sharing         Hospital/           Medical
                                                                 ACO Medical
        Distribution        Physician           Referral
                                                                   Director
       Methodology          Discounts           Control
11


Population Health Management Process


Step 1
         • Turn Claims and ERM into Actionable & Intelligent Data


Step 2
         • Align & Engage With Highest Quality & Cost Efficient Physicians


Step 3
         • Improve Medical Utilization & Member Health Status


Step 4
         • Seamlessly Integrate the Entire Program


Step 5
         • Communicate Effectively to the Ultimate User – The Patient
12


Population Health Management Process
13


Population Health Management Process


                                       Why? Because data
                                       mining identifies the
                                       risks.
14


Population Health Management Process
15


Population Health Management Process


The Highest Quality Physicians…..


                                       Provide the Needed Preventative
                                       Service Rates for Chronically Ill
                                       Patients…..
16


Population Health Management Process – Chronic Disease
Management

• Monitors and manages chronic diseases and co-morbidities that total 80% of
    costs
•   Members with a chronic condition are assigned a Nurse Coach
•   Physician profiling allows high dollar claimants to be shifted to high quality, cost
    effective providers
•   Incentives can be aligned with desired health outcomes
•   Built in benchmarks and accountability measures to demonstrate member
    compliance
•   Reporting to the provider whether the chronically ill population meet the
    minimum care standards
•   Documented ROI
•   Reinsurance credit when used with predictive modeling and physician profiling
17


Population Health Management Process – Predictive Modeling


• Predictive modeling’s value proposition is that it shortens the cycle between an
  adverse event and intervention
• Utilizes a Predictive Risk Model which is the science of ranking individuals from
  those with the greatest probability of disease onset to the least probability
• The Predictive Risk Model utilizes a very sophisticated software application which
  takes the following factors into consideration resulting in the assignment of a
  Healthcare Index
     Age/gender
     Illness burden
     Co-morbidities
     Types/frequency of medicines

• Large claim prevention depends significantly on early identification, intervention
  and coaching
18


Population Health Management Process – Physician Profiling


• Patented process employs three stringent, clinically based tests which each
  physician provider must pass in order to be an Endorsed Provider
      Practice patterns which result in low total costs for the types of illnesses
       comparable to other physicians of the same specialty
      Delivery of high levels of post-primary preventive care services for
       chronically ill patients
      Patterns of clinical and billing practices that avoid service up-coding,
       services that are not appropriate for the diagnosis, invalid diagnostic coding
       and services performed more frequently than typically appropriate.
• It has been statistically validated that Endorsed Providers are on average 42%
  less expensive than providers who do not pass the three, clinically based tests
• There are on average 15% Non-Endorsed Providers in areas where there are
  enough episodes to statistically measure
• It has been actuarially validated that Non-Endorsed Providers on average will
  add 10% excess cost to costs
19


Proven Results
20


Why Should I Care?


  Fee for            Pay for                Pay for              Episodic                                 New Payment
                                                                                     Shared Savings
  Service          Coordination          Performance            Payments                Shared savings      Models
                                                              Payment based on         From better care
 Paid for each                             Payment tied to                                                 Providers share
                                                              delivery of services     coordination and
 unit of service     Additional per      objective measures                                                  from better
                                                                within a given       disease management
   WITHOUT          Capita payment         of performance                                                 care coordination
                                                                   timeframe                Reform
 constraint on     Based on ability to         Reform                                                        and disease
                                                                     Reform                  ACOs
   spending          Manage care          VBP/HIT/Readmit                                                   management
                                                               Bundled Payment
21


Opportunities for Commercial ACO Deployment


                            Community
                            Employers


   Hospital(s) &                                Product
   Physician(s)                               Administration
22


Opportunities for Commercial ACO Deployment
23


Opportunities for Commercial ACO Deployment


BENEFIT BUDGET
•    Employers and Healthcare Providers determine health benefit budgets.
•    Healthcare Providers arrange for deeply discounted healthcare services.
•    Employers and Healthcare Providers share in the savings to the healthcare budget through
     financial performance rewards.
ENGINEERING AND COORDINATION OF CARE
•    ACO Medical Director engineers the coordination of patient care pathways through top
     performing medical providers.
BEST OF BREED CLINICAL VALUE NETWORKS AND PHYSICIAN RECRUITED
•    Best of breed physicians are identified by the ACO Medical Director and are heavily
     incentivized by the gain sharing due to favorable variances to the employers’ healthcare
     budget.
•    High Quality, Cost Effective Physicians.
DEVELOP A CULTURE OF WELLNESS
•    Member Health Incentive Programs.
•    Healthcare Coaching - Ongoing Healthcare Education.
24


Opportunities for Commercial ACO Deployment
25


        Opportunities for Commercial ACO Deployment


                                      SAMPLE GAINSHARING TARGET FORMULA ONE
                                                                         Total Bonus Pool
                                                                         Hospital                                                     $ 281,896.78               Physician Distribution
                                                                         Physicians                                                   $ 657,759.15
                                                         $100,000 Specific Stop Loss
                  Reinsurer 1                                         Reinsurer 2                                     Reinsurer 3
                  $7,531,413                                          $7,391,071                                      $7,402,033
                                                                                                                                                                                                              SAMPLE GAINSHARING DISTRIBUTION FORMULA                                                                       Example: Total Bonus Pool $716,700
                                                              Average Expected Paid Claims                                                                                                                                                                                                                                                    Hospital $238,898
                                                                 Annual Budget Target                                                                                                                                                                                                                                                        Physician $477,795
                                                                       $7,441,506
                                                                                                                                                                                                                                                       Patient Cost
                                                                                                                                                                                Patient              Risk              Difference -  Total Patient                                                       Physician Index                      Bonus
                                                                                                                                                                       # of               Target               Actual                                 Difference per                      Distribution                          Bonus                        Bonus
                                                                Monthly Target Factors                                                                   Physician                Risk             Adjusted           Risk Adjusted Cost Difference                     Allocation                       Profiling Bonus                    Forfeiture
                                                                                                                                                                     Patients             PMPM                 PMPM                                       Year for                          Amount                            Forfeiture                  Distribution
                                                         Single        $ 375.72                                                                                                  Score              PMPM              minus Actual     per Year                                                            Index   Factor                  Reallocation
                                                                                                                                                                                                                                                        Allocation
                                                         Family        $ 939.30                                                                              a          b          c        d         e          f          g               h                i                j                  k          l        m            n             o              p
                                                                                                                                                                                                                                                                                           (j x bonus                                       (pro-rata
                                                                                                                                                                                                    (c x d)               (e - f)      (g x b x 12)                    (i / total of i)                                         (l x m)                    (k + n + o)
                                                                                                                                                                                                                                                                                              pool)                                        allocation)
                                                          Sample Monthly Calculation
                                                                                                                                                            1        1,400       0.95     $700     $665        $650       $15        $ 252,000 $ 252,000                 11.6%            $ 55,358         0.80 20.0% $               -    $ 7,545 $          62,903
   Month    Single Census        Factor          Total           Family Census          Factor          Total            Target            Actual
January          413            $ 375.72   $     155,172.26           495              $ 939.30   $     464,953.21   $ 620,125.47     $     106,849.34
                                                                                                                                                            2        1,200       0.98     700       686         710        (24)         (345,600)               -         0.0%                    -        0.85 15.0%                 -           -                 -
February         425            $ 375.72   $     159,680.90           488              $ 939.30   $     458,378.11   $ 618,059.01     $     200,483.45
March            418            $ 375.72   $     157,050.86           490              $ 939.30   $     460,256.71   $ 617,307.57     $     246,395.45
                                                                                                                                                            3        1,100       1.01     700       707         690        17            224,400          224,400        10.3%               49,295        0.90 12.0%                          6,719          56,014
April            423            $ 375.72   $     158,929.46           492              $ 939.30   $     462,135.31   $ 621,064.77     $     332,940.76
May              428            $ 375.72   $     160,808.06           490              $ 939.30   $     460,256.71   $ 621,064.77     $     512,394.34
                                                                                                                                                            4        1,250       1.08     700       756         715        41            615,000          615,000        28.3%             135,101         1.00    8.0%                       18,414         153,514
June             426            $ 375.72   $     160,056.62           490              $ 939.30   $     460,256.71   $ 620,313.33     $     529,450.56
July             419            $ 375.72   $     157,426.58           493              $ 939.30   $     463,074.61   $ 620,501.19     $     488,394.34
                                                                                                                                                            5        1,100       1.10     700       770         800        (30)         (396,000)               -         0.0%                    -        1.50    0.0%                                             -
August           422            $ 375.72   $     158,553.74           496              $ 939.30   $     465,892.51   $ 624,446.25     $     501,935.40
September        427            $ 375.72   $     160,432.34           499              $ 939.30   $     468,710.41   $ 629,142.75     $     462,384.56
                                                                                                                                                            6        1,200       1.12     700       784         725        59            849,600          849,600        39.1%             186,637         1.75 -12.0%         (22,396)                      164,240
October          428            $ 375.72   $     160,808.06           498              $ 939.30   $     467,771.11   $ 628,579.17     $     440,586.45
November         425            $ 375.72   $     159,680.90           491              $ 939.30   $     461,196.01   $ 620,876.91     $     523,940.56
                                                                                                                                                            7        1,300       1.15     700       805         790        15            234,000          234,000        10.8%               51,404        2.00 -20.0%         (10,281)                       41,123
December         426            $ 375.72   $     160,056.62           490              $ 939.30   $     460,256.71   $ 620,313.33     $     412,940.56
IBNR                                       $   1,908,656.41                                       $   5,553,138.13   $ 7,461,794.53   $   4,758,695.77
                                                                                                                                                                                                                                     $ 1,433,400 $ 2,175,000 100.00% $ 477,795                                               $ (32,677) $ 32,677 $ 477,795
January                                                                                                                               $     323,859.34
February                                                                                                                              $    212,945.45
March                                                                                                                                 $    198,485.67                                                                                       Score Indicates Physician is Practicing High
April                                                                                                                                 $     88,496.45
                                                                                                                     $ 7,461,794.53 $ 5,582,482.68       Health Index Score of                                                                    Quality Cost Efficient Medicine
                                                                                                  Favorable
                                                                                                  Variance to        $            1,879,311.85            Patient Population
                                                                                                  Budget
26


Opportunities for Commercial ACO Deployment
27


Targeted Strategy


                                      Medical Providers’ Own Employees
                Captured Population                                         Controlled Population


                                                    Uninsured
            Currently Underwriting Risk                              Need to be Managed & Risk Mitigated


                                                  Local Employers
         Gain Sharing with little or no risk                           Shared Benchmarks & Incentives


                                                 Commercial Payers
       Participate in closed networks and risk                                  Reduce trend


                          Public Programs (Medicare under ACO Rules & Medicaid)
             ACO Gain Sharing and Risk                        Mature Management Expertise – Proven Results
Questions & Answers


                                     Jack Hill
                              Executive VP & Partner


                           www.accountablecaresg.com
                               Phone: 630.878.7539
                      Email: jack.hill@accountablecaresg.com

First Illinois Chapter HFMA

  • 1.
    CFO Breakfast -March 23, 2012 Model for Population Health Management with Quantifiable Results and Optimal Gain Sharing Potential Jack Hill, Executive Vice President & Partner
  • 2.
    Agenda 1. The CurrentHealth Care Environment 2. Population Health Management Process 3. Proven Results 4. Why You Should Care 5. Opportunities for Commercial ACO Deployment
  • 3.
    3 The Current HealthCare Environment Reform is Here and We Have to Deal with It
  • 4.
    4 The Current HealthCare Environment The Patient Has to be Engaged
  • 5.
    5 The Current HealthCare Environment The Political Landscape is Rife with Challenges
  • 6.
    6 The Current HealthCare Environment The Train Has Left the Station – Reform for Medical Providers is in Play and Population Health Management should be THE Primary Objective
  • 7.
    7 The Current HealthCare Environment
  • 8.
    8 The Current HealthCare Environment Patient /Payor Shifts Payment Reductions/ Changes
  • 9.
    9 The Changing HealthCare Environment
  • 10.
    10 Population Health ManagementProcess * * Step Down Employer On-site Data Benefit UM Testing Warehouse Consulting Management Data Drill Ongoing Gain Sharing Employer Down Educational Formulas Stop Loss Capabilities Resources Community Healthcare * Small Health Partner = Physician Geographic Employer Profiling Benchmarks Financial Risk Targets Assessments Delivery of Quality * * * Predictive Episodic Recognition of High Cost Wellness Healthcare Modeling Analysis Programs Patients Controlled Healthcare Costs * Chronic * Treatment Member Personal Healthier Members Criteria Incentive Health Disease Compliance Program Records Management Structural * * * Professional Employee Employer Organization Telephonic Healthcare Healthcare Phys Nurse Coaching Indexing Indexing Hosp/etc Gain Sharing Hospital/ Medical ACO Medical Distribution Physician Referral Director Methodology Discounts Control
  • 11.
    11 Population Health ManagementProcess Step 1 • Turn Claims and ERM into Actionable & Intelligent Data Step 2 • Align & Engage With Highest Quality & Cost Efficient Physicians Step 3 • Improve Medical Utilization & Member Health Status Step 4 • Seamlessly Integrate the Entire Program Step 5 • Communicate Effectively to the Ultimate User – The Patient
  • 12.
  • 13.
    13 Population Health ManagementProcess Why? Because data mining identifies the risks.
  • 14.
  • 15.
    15 Population Health ManagementProcess The Highest Quality Physicians….. Provide the Needed Preventative Service Rates for Chronically Ill Patients…..
  • 16.
    16 Population Health ManagementProcess – Chronic Disease Management • Monitors and manages chronic diseases and co-morbidities that total 80% of costs • Members with a chronic condition are assigned a Nurse Coach • Physician profiling allows high dollar claimants to be shifted to high quality, cost effective providers • Incentives can be aligned with desired health outcomes • Built in benchmarks and accountability measures to demonstrate member compliance • Reporting to the provider whether the chronically ill population meet the minimum care standards • Documented ROI • Reinsurance credit when used with predictive modeling and physician profiling
  • 17.
    17 Population Health ManagementProcess – Predictive Modeling • Predictive modeling’s value proposition is that it shortens the cycle between an adverse event and intervention • Utilizes a Predictive Risk Model which is the science of ranking individuals from those with the greatest probability of disease onset to the least probability • The Predictive Risk Model utilizes a very sophisticated software application which takes the following factors into consideration resulting in the assignment of a Healthcare Index  Age/gender  Illness burden  Co-morbidities  Types/frequency of medicines • Large claim prevention depends significantly on early identification, intervention and coaching
  • 18.
    18 Population Health ManagementProcess – Physician Profiling • Patented process employs three stringent, clinically based tests which each physician provider must pass in order to be an Endorsed Provider  Practice patterns which result in low total costs for the types of illnesses comparable to other physicians of the same specialty  Delivery of high levels of post-primary preventive care services for chronically ill patients  Patterns of clinical and billing practices that avoid service up-coding, services that are not appropriate for the diagnosis, invalid diagnostic coding and services performed more frequently than typically appropriate. • It has been statistically validated that Endorsed Providers are on average 42% less expensive than providers who do not pass the three, clinically based tests • There are on average 15% Non-Endorsed Providers in areas where there are enough episodes to statistically measure • It has been actuarially validated that Non-Endorsed Providers on average will add 10% excess cost to costs
  • 19.
  • 20.
    20 Why Should ICare? Fee for Pay for Pay for Episodic New Payment Shared Savings Service Coordination Performance Payments Shared savings Models Payment based on From better care Paid for each Payment tied to Providers share delivery of services coordination and unit of service Additional per objective measures from better within a given disease management WITHOUT Capita payment of performance care coordination timeframe Reform constraint on Based on ability to Reform and disease Reform ACOs spending Manage care VBP/HIT/Readmit management Bundled Payment
  • 21.
    21 Opportunities for CommercialACO Deployment Community Employers Hospital(s) & Product Physician(s) Administration
  • 22.
  • 23.
    23 Opportunities for CommercialACO Deployment BENEFIT BUDGET • Employers and Healthcare Providers determine health benefit budgets. • Healthcare Providers arrange for deeply discounted healthcare services. • Employers and Healthcare Providers share in the savings to the healthcare budget through financial performance rewards. ENGINEERING AND COORDINATION OF CARE • ACO Medical Director engineers the coordination of patient care pathways through top performing medical providers. BEST OF BREED CLINICAL VALUE NETWORKS AND PHYSICIAN RECRUITED • Best of breed physicians are identified by the ACO Medical Director and are heavily incentivized by the gain sharing due to favorable variances to the employers’ healthcare budget. • High Quality, Cost Effective Physicians. DEVELOP A CULTURE OF WELLNESS • Member Health Incentive Programs. • Healthcare Coaching - Ongoing Healthcare Education.
  • 24.
  • 25.
    25 Opportunities for Commercial ACO Deployment SAMPLE GAINSHARING TARGET FORMULA ONE Total Bonus Pool Hospital $ 281,896.78 Physician Distribution Physicians $ 657,759.15 $100,000 Specific Stop Loss Reinsurer 1 Reinsurer 2 Reinsurer 3 $7,531,413 $7,391,071 $7,402,033 SAMPLE GAINSHARING DISTRIBUTION FORMULA Example: Total Bonus Pool $716,700 Average Expected Paid Claims Hospital $238,898 Annual Budget Target Physician $477,795 $7,441,506 Patient Cost Patient Risk Difference - Total Patient Physician Index Bonus # of Target Actual Difference per Distribution Bonus Bonus Monthly Target Factors Physician Risk Adjusted Risk Adjusted Cost Difference Allocation Profiling Bonus Forfeiture Patients PMPM PMPM Year for Amount Forfeiture Distribution Single $ 375.72 Score PMPM minus Actual per Year Index Factor Reallocation Allocation Family $ 939.30 a b c d e f g h i j k l m n o p (j x bonus (pro-rata (c x d) (e - f) (g x b x 12) (i / total of i) (l x m) (k + n + o) pool) allocation) Sample Monthly Calculation 1 1,400 0.95 $700 $665 $650 $15 $ 252,000 $ 252,000 11.6% $ 55,358 0.80 20.0% $ - $ 7,545 $ 62,903 Month Single Census Factor Total Family Census Factor Total Target Actual January 413 $ 375.72 $ 155,172.26 495 $ 939.30 $ 464,953.21 $ 620,125.47 $ 106,849.34 2 1,200 0.98 700 686 710 (24) (345,600) - 0.0% - 0.85 15.0% - - - February 425 $ 375.72 $ 159,680.90 488 $ 939.30 $ 458,378.11 $ 618,059.01 $ 200,483.45 March 418 $ 375.72 $ 157,050.86 490 $ 939.30 $ 460,256.71 $ 617,307.57 $ 246,395.45 3 1,100 1.01 700 707 690 17 224,400 224,400 10.3% 49,295 0.90 12.0% 6,719 56,014 April 423 $ 375.72 $ 158,929.46 492 $ 939.30 $ 462,135.31 $ 621,064.77 $ 332,940.76 May 428 $ 375.72 $ 160,808.06 490 $ 939.30 $ 460,256.71 $ 621,064.77 $ 512,394.34 4 1,250 1.08 700 756 715 41 615,000 615,000 28.3% 135,101 1.00 8.0% 18,414 153,514 June 426 $ 375.72 $ 160,056.62 490 $ 939.30 $ 460,256.71 $ 620,313.33 $ 529,450.56 July 419 $ 375.72 $ 157,426.58 493 $ 939.30 $ 463,074.61 $ 620,501.19 $ 488,394.34 5 1,100 1.10 700 770 800 (30) (396,000) - 0.0% - 1.50 0.0% - August 422 $ 375.72 $ 158,553.74 496 $ 939.30 $ 465,892.51 $ 624,446.25 $ 501,935.40 September 427 $ 375.72 $ 160,432.34 499 $ 939.30 $ 468,710.41 $ 629,142.75 $ 462,384.56 6 1,200 1.12 700 784 725 59 849,600 849,600 39.1% 186,637 1.75 -12.0% (22,396) 164,240 October 428 $ 375.72 $ 160,808.06 498 $ 939.30 $ 467,771.11 $ 628,579.17 $ 440,586.45 November 425 $ 375.72 $ 159,680.90 491 $ 939.30 $ 461,196.01 $ 620,876.91 $ 523,940.56 7 1,300 1.15 700 805 790 15 234,000 234,000 10.8% 51,404 2.00 -20.0% (10,281) 41,123 December 426 $ 375.72 $ 160,056.62 490 $ 939.30 $ 460,256.71 $ 620,313.33 $ 412,940.56 IBNR $ 1,908,656.41 $ 5,553,138.13 $ 7,461,794.53 $ 4,758,695.77 $ 1,433,400 $ 2,175,000 100.00% $ 477,795 $ (32,677) $ 32,677 $ 477,795 January $ 323,859.34 February $ 212,945.45 March $ 198,485.67 Score Indicates Physician is Practicing High April $ 88,496.45 $ 7,461,794.53 $ 5,582,482.68 Health Index Score of Quality Cost Efficient Medicine Favorable Variance to $ 1,879,311.85 Patient Population Budget
  • 26.
  • 27.
    27 Targeted Strategy Medical Providers’ Own Employees Captured Population Controlled Population Uninsured Currently Underwriting Risk Need to be Managed & Risk Mitigated Local Employers Gain Sharing with little or no risk Shared Benchmarks & Incentives Commercial Payers Participate in closed networks and risk Reduce trend Public Programs (Medicare under ACO Rules & Medicaid) ACO Gain Sharing and Risk Mature Management Expertise – Proven Results
  • 28.
    Questions & Answers Jack Hill Executive VP & Partner www.accountablecaresg.com Phone: 630.878.7539 Email: jack.hill@accountablecaresg.com