Fire safety review of interior materials in buses

A number of bus interior materials are reviewed for fire safety. Data is presented from fire tests made on three seats, eleven wall and ceiling materials and two floor systems coming from modern buses and coaches with a mass more than five tons and with more than 22 passenger seats. All materials were tested in the presently required simple horizontal flame spread fire test for buses and coaches in Europe and also in several modern state-of-the-art fire test methods used for other applications such as trains, ships and buildings. The tests were evaluating flame spread behaviour, heat- and smoke release rates, ignition resistance and generation of toxic gases. The test results are compared with existing criteria for other applications and the present level of fire safety is discussed. The main conclusion is that the present horizontal fire test does not provide a sufficiently high fire safety level in the passenger compartment of buses and is not able to distinguish between different product fire performance. A short review of other research within the same area shows that several publications have come to the same conclusion. This report is presenting working package two (WP2) out of eight in a project called “Fire safety in buses”.

Recommended
More Related Content
Similar to Fire safety review of interior materials in buses
Similar to Fire safety review of interior materials in buses (20)
More from Phani Mohan K
More from Phani Mohan K (20)
Recently uploaded
Recently uploaded (20)
Fire safety review of interior materials in buses
- 1. Fire Safety in Buses - WP2 report: Fire safety review of interior materials in buses SP Technical Research Institute of Sweden Patrik Johansson Jesper Axelsson Norwegian Public Roads Administration Swedish Road Administration SP Technical Research Institute of Sweden Fire Technology SP Report 2006:59
- 2. Fire Safety in Buses - WP2 report: Fire safety review of interior materials in buses Patrik Johansson Jesper Axelsson
- 3. 3 Abstract A number of bus interior materials are reviewed for fire safety. Data is presented from fire tests made on three seats, eleven wall and ceiling materials and two floor systems coming from modern buses and coaches with a mass more than five tons and with more than 22 passenger seats. All materials were tested in the presently required simple horizontal flame spread fire test for buses and coaches in Europe and also in several modern state-of-the-art fire test methods used for other applications such as trains, ships and buildings. The tests were evaluating flame spread behaviour, heat- and smoke release rates, ignition resistance and generation of toxic gases. The test results are compared with existing criteria for other applications and the present level of fire safety is discussed. The main conclusion is that the present horizontal fire test does not provide a sufficiently high fire safety level in the passenger compartment of buses and is not able to distinguish between different product fire performance. A short review of other research within the same area shows that several publications have come to the same conclusion. This report is presenting working package two (WP2) out of eight in a project called “Fire safety in buses”. Key words: Fire tests, fire safety, bus interiors, ISO 3795, FMVSS 302, CBUF, ISO 5659, ISO 5660, heat release rate, smoke production rate, flame spread, trains, ships. SP Sveriges Tekniska Forskningsinstitut SP Technical Research Institute of Sweden SP Report 2006:59 ISBN 91-85533-52-1 ISSN 0284-5172 Borås 2006
- 4. 4 Contents Abstract 3 Contents 4 1 Preface 5 2 Introduction 6 3 Fire test methods 7 4 Tested products 17 5 Test results 6 Other research within bus fire safety ISO 3795 in Europe FMVSS 302 in the U.S. NMAB 1979, study including FMVSS 302 Fire performance of school bus interior components, NIST 1990 NFPA proposal for new tests supplementing the FMVSS 302 Why Isn’t Ground Transportation Safe? 24 24 24 25 26 26 7 Conclusions 28 8 References 29 3.1 3.2 3.3 3.4 3.5 3.6 3.7 3.8 5.1 5.2 5.3 5.4 5.5 5.6 5.7 5.8 6.1 6.2 6.3 6.4 6.5 6.6 ISO 3795 ISO 5660-1 ISO 5659-2 + toxicity ISO 5658 EN ISO 9239-1 EN ISO 11925-2 Full scale upholstery chairs, CBUF ISO 6941 ISO 3795 ISO 5660 ISO 5659-2 and toxic gases ISO 5658 EN ISO 9239-1 EN ISO 11925-2 Full-scale seat tests ISO 6941 ANNEX A1 Detailed test results 8.1 8.2 ISO 3795 ISO 5660 8.3 ISO 5659-2 and toxic gases 8.2.1 8.3.1 8.4 8.5 8.6 8.6.1 8.7 8.7.1 8.7.2 ISO 5660 parameter explanation ISO 5659 Parameter explanation 8 9 10 11 13 14 15 16 18 18 19 20 21 22 22 23 23 24 31 31 35 59 60 88 ISO 5658 EN ISO 11925-2 Full-scale seat tests 89 116 118 ISO 6941 142 S3, test 3 Y7 Y8 138 142 142
- 5. 5 1 Preface The authors acknowledge the Norwegian and Swedish National Road Agencies for initiating and financing the project. A large contribution to the project was made by the companies that supported in the selection of materials and supplied products for testing. Acknowledgement also goes to Scania for providing a test bus and seats.
- 6. 6 2 Introduction Fires in buses are a relatively common incident and this indicates that the fire safety level in buses is not good enough. The materials used and the construction and design of modern buses needs to be inherently safe to decrease the risk of fire. In 2005 the Norwegian and Swedish National Roads Administrations together with SP Fire Technology initiated a comprehensive research programme on bus fire safety with the aim to decrease the number and consequences of bus fires. The programme consists of eight working packages and this report describes the second package that has reviewed the fire behaviour of existing materials. The aim of the work presented in this report is to characterize surface lining and upholstery etc. used in buses today. A test series is performed regarding reaction to fire, such as ignitability, fire propagation, smoke production and toxicity. A comparison with existing testing technology and requirements in other areas as passenger ships, public buildings and trains is performed. Fire safety in automotive vehicles is also an object of concern in the U.S. Similar test methods used in the European countries are used in the U.S. and several research programs have been dealing with the subject and some are still ongoing. References to and short summary of conclusions from other projects are given in this report.
- 7. 7 3 Fire test methods Fire test methods used for evaluation of the fire behaviour of the interior materials were selected to reflect the state-of-the-art of today. The methods should be able to give relevant information, be well established and be able to differentiate products providing a reasonable fire safety. Existing fire classification systems and requirements were used as guideline in the selection, e.g. the system for fire safety demands on passenger ships and the recently proposed European standard for fire safety on trains (CEN TS 45545-2)1. A summary of the test methods chosen is given in Table 1 and a more detailed explanation is given in the following sections. The proposed European standard for fire safety on trains is especially interesting since trains are very similar to buses. It contains a set of test methods and criteria that are based on real-scale scenarios and selected to reflect fire safety in modern trains. The proposal is not yet formally published but it will probably become an approved European standard (Technical Specification) during 2007. Criteria values presented in this paper reflect both the highest and the lowest railway fire category defined in the draft standard. Note that these criteria are for indication and are subject to changes before the standard CEN TS 45545-2 is finalised. Table 1. Summary of fire test methods, Test Method ISO 37952 Flame spread test ISO 5660-14 Cone Calorimeter test ISO 5659-2 + toxicity5 Smoke Box test Main application areas Automotive vehicle interiors. (e.g. Vehicle directive 95/28/EC3) Research in all areas, construction products, trains (CEN TS 45545-2) Surface linings on passenger ships, proposed for trains. ISO 5658-26 Spread of flame test Surface linings, ships*, proposed for trains. EN ISO 9239-17 Radiant flooring panel test Flooring materials in buildings (CPD**), proposed for trains. EN ISO 11925-28 Small flame test Surface linings and insulation in buildings. Seats, full-scale test, variant proposed for trains. Curtains in buses. CBUF Full scale seat test9 ISO 694110 Curtain flame spread test * A similar test is used for passenger ships ** Construction Products Directive; harmonised regulations for building products in Europe. Also basis for CE-marking system.
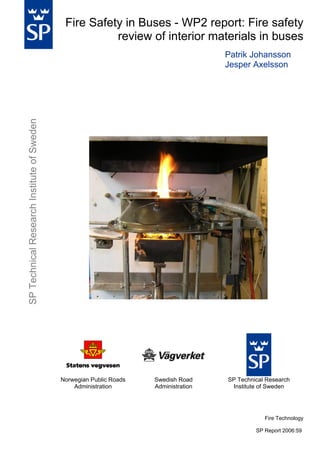
- 8. 8 3.1 ISO 3795 In present time products for use in the interior of buses are mainly regulated by the international standard ISO 3795. This standard describes the test method but does not contain any explicit requirements or pass/fail criteria. The requirements are laid down in e.g. European Directives 95/27/EC or in the internal quality systems of the industry. The principle of ISO 3795 is that a 100x356 mm sample is mounted horizontally in a Ushaped holder and is exposed to the action of a defined low-energy flame for 15 seconds in a combustion chamber, the flame applied on the free end of the sample, see Figure 1. The test determines if and when the flame extinguishes, or the time at which the flame passes a measured distance, resulting in a burning rate in mm/minute. The European directive 95/28/EC mentions a burning rate of maximum 100 mm/minute as a demand and an internal requirement at Volvo is 80 mm/minute. Similar test method is FMVSS (Federal Motor Vehicle Safety Standard) 302. The differences are very small and test results from one of the tests can be directly compared to the other. The FMVSS 302 defines a requirement of maximum burning rate = 102 mm/minute. This test or variations are used widely over the world for passenger car fire safety testing. Figure 1. Photograph of the ISO 3795 test.
- 9. 9 3.2 ISO 5660-1 The international standard ISO 5660-1, also called the Cone Calorimeter, is used in the recently proposed system for fire safety on trains, CEN TS 45545-2. It is also used in fire testing and type approval of building products within development work and factory production control testing. In the Cone Calorimeter, ISO 5660-1, specimens of 100 x 100 mm are exposed to controlled levels of radiant heating. The specimen surface is heated up and an external spark generator ignites any pyrolysis gases from the specimen, see Figure 2. The gases are collected by a hood and extracted by an exhaust fan. The levels of radiant heating used in CEN TS 45545-2 are 25 kW/m2 and 50 kW/m2. The heat release rate (HRR) is determined by measurements of the oxygen consumption derived from the oxygen concentration and the flow rate in the exhaust duct. The specimen is placed on a load cell during testing and the mass loss recorded continuously. A retainer frame covers the periphery of the specimen. The standard ISO 5660-1 does not contain any explicit requirements. In the proposed system for fire safety on trains (CEN TS 45545-2) the requirements are focused on the heat release rate. The HRR is used to calculate a parameter called MARHE, or the Maximum Average Rate of Heat Emission between test start and end of test, defined as the cumulative heat emission in the test period divided by the time. The highest criterion mentioned in the CEN TS 45545-2 is a maximum MARHE of 50 kW/m2. Result data from ISO 5660-1 can also be used for prediction of fire behaviour in medium scale (EN 13823 SBI test11) and large scale (ISO 9705 Room Corner test12) to achieve a predicted Euroclassification. See further the results section. Figure 2. Photograph of the ISO 5660 test.
- 10. 10 3.3 ISO 5659-2 + toxicity The international standard ISO 5659-2 is well established in the ship building industry. The International Maritime Organisation, IMO, use this method together with a smoke toxicity analysis to investigate if a material meets the requirements as not capable of producing excessive quantities of smoke and toxic products or not giving rise to toxic hazards at elevated temperatures. The standard ISO 5659-2 together with toxicity analysis is also used in the recently proposed system for fire safety on trains (CEN TS 45545-2). In the test method described in standard ISO 5659-2, specimens of 75 by 75 mm are positioned horizontally within a 0.5 m3 sealed chamber and exposed to controlled levels of radiant heating, in a similar way as in ISO 5660-1. A retainer frame covers the periphery of the specimen. Two different levels of irradiance, 25 kW/m2 and 50 kW/m2, are prescribed both for IMO- and the proposed train regulation. The specimen surface is heated up by the irradiance. IMO has an additional mode, 25 kW/m2, with a small pilot flame igniting the pyrolysis gases from the specimen. See Figure 3. The smoke evolved from the specimen is accumulated in the sealed chamber which contains photometric equipment. The attenuation of a light beam passing though the smoke is measured continuously and the results are reported in terms of specific optical density. Toxicity of the smoke is determined continuously by FTIR gas analysis. A small gas sample is taken from the geometrical centre of the test chamber and is passed through an infrared spectrometer. The requirements used in IMO are shown in the FTP Code, Resolution MSC. 61(67)13 and treats the maximum smoke optical density, Dm, and the maximum toxic concentration of seven different gas species. The IMO requirements are presently (2007) under review. In the proposed system for fire safety on trains (CEN TS 45545-2) the requirements treats the maximum smoke optical density, Ds (max) and the smoke optical density after 4 minutes test time, Ds (4) and VOF4. The gas concentrations are evaluated after 8 minutes test time and reported as the Conventional Index of Toxicity, CIT.
- 11. 11 Figure 3. Photograph of the ISO 5659-2 test, view through window. 3.4 ISO 5658 To determine a products behaviour regarding lateral flame spread the international standard ISO 5658 is used in the proposed system for fire safety on trains (CEN TS 45545-2). The same test procedure but with some additional measurements is used as the main flame spread test for interior linings in passenger ships under the IMO Resolution A.653(16)14. The lateral flame spread is determined on vertically orientated specimens exposed to radiant heat from a methane-fuelled rectangular radiant panel at an angle to the specimen as shown in Figure 4. A small gas burner flame acts as pilot ignition source. For trains the only interesting part is the distance of the flame spread over the surface. According to IMO also the heat release rate and the speed of the flame spread are important. The distance of the flame spread is used for reporting the CHF-value for both trains and ships. The CHF-value (Critical Heat Flux at extinguishment) is the incident heat flux at the specimen surface at the point along its horizontal centreline where the flame ceases to advance. The CHF-value, kW/m2, is determined by measuring the maximum spread of flame and relating this value to the corresponding heat flux value from the heat flux profile curve, the calibration curve, which is based on measurements with a noncombustible board. Limit for most surfaces in the CEN TS 45545-2 is a minimum CHFvalue of 20 kW/m2, corresponding to a flame spread of about 380 mm. Surface products in ships shall also comply with the following parameters: • Heat for sustained burning, Qsb, MJ/m2 (speed of the flame spread) • Total heat release, Qt, MJ (measured with thermocouples). • Peak heat release rate, qp, kW (measured with thermocouples). The last two heat release parameters will however probably not be considered in a proposal for bus interiors. Heat release from the products is evaluated by the Cone Calorimeter ISO 5660-1.
- 12. 12 Figure 4. Photograph of the ISO 5658 test.
- 13. 13 3.5 EN ISO 9239-1 The standard EN ISO 9239-1, Reaction to fire tests for floorings, is a European harmonized testing standard for building products and it is implemented in the Swedish building code. The standard describes a test method which determines the burning behaviour of a floor covering using a radiant heat source. The same test method is also used in the proposed system for fire safety on trains (CEN TS 45545-2). During the test a 230 x 1050 mm test specimen is placed in a horizontal position below a gas-fired radiant panel inclined at 30° where it is exposed to a defined heat flux profile. A pilot flame is applied to the hotter end of the specimen. Following ignition, any flame front which develops is noted and a record is made of the progression of the flame front horizontally along the length of the specimen in terms of the time it takes to spread to defined distances. Smoke production during the test is recorded as light transmission in the exhaust stack using a lamp and a photocell. See Figure 5. The CHF-value, kW/m2, is determined by measuring the maximum flame spread distance and relating this value to the corresponding heat flux value from the heat flux profile curve, the calibration curve, which is based on measurements with a heat-flux meter and a non-combustible board. The highest criterion mentioned in the Swedish building code and the CEN TS 45545-2 train standard is a minimum CHF-value of 8 kW/m2, corresponding to a flame spread distance of approximately 270 mm. Figure 5. Photograph of the ISO 9239-1 test. The horizontal floor sample has ignited.
- 14. 14 3.6 EN ISO 11925-2 The standard EN ISO 11925-2, Reaction to fire tests - Ignitability of building products subjected to direct impingement of flame, is a European harmonized testing standard for building products and it is implemented in the Swedish building code. The test is a singleflame source test and is mostly required in addition to other tests methods as the test for floor coverings EN ISO 9239-1 mentioned above, and also the SBI test15. The test method measures the ignitability of building products when exposed to a small flame. The test takes place inside a test chamber where the 90 x 250 mm test specimen is mounted vertically. The test specimen is subjected to edge and/or surface exposure from a gas flame during 15 or 30 seconds depending on which class the product should achieve. During the test, time to ignition, burning droplets and flame spread are registered. The flames are not allowed to spread past 150 mm above the exposure point within a described time, 30 or 60 s depending on class. See Figure 6. Figure 6 Schematic sketch of the test method EN ISO 11925-2.
- 15. 15 3.7 Full scale upholstery chairs, CBUF In the proposed system for fire safety on trains (CEN TS 45545-2) a full scale test for upholstery seats is required. In this project we have used a similar test but with a different ignition source of a higher effect. The ignition source used is a square ring propane burner developed in the CBUF project, identical to the one presently used in the California TB 13316 furniture test. The burner delivers 30 kW. The ignition source is applied on top of the specimen, 25 mm from the seat cushion and 50 mm from the back rest, during 2 minutes, see Figure 7. The smoke gases produced are collected by a hood and exhaust system from where samples are taken for gas analysis. The heat release rate (HRR) is determined by measurements of the oxygen consumption derived from the oxygen concentration and the flow rate in the exhaust system. The proposed train requirements (CEN TS 45545-2) are focusing on the heat release rate, HRR. The HRR is used to calculate a parameter called MARHE, or the maximum average rate of heat emission between test start and end of test, defined as the cumulative heat emission in the test period divided by the time. The highest criterion mentioned in the CEN TS 45545-2 is a maximum MARHE of 20 kW. The test procedure simulates ignition from adjacent fire, e.g. dropping curtains/plastic, or an arson fire. Vandalisation and arson are not common in buses compared to trains but the test is very well suited to identify risk of an existing fire to develop fast inside the passenger compartment due to flammable seats. Figure 7. Schematic sketch and picture of the full-scale CBUF test for seats.
- 16. 16 3.8 ISO 6941 Curtain, blinds and other vertical hanging materials in buses are in present time regulated by the European directive 95/28/EC; annex VI3, which describes an identical test method as the international standard ISO 6941. The principle of ISO 6941 is that a sample is held vertically fastened on pins located on a steel frame. The sample is exposed from below with a 40 mm long flame for 5 or 15 seconds. On three different heights a marker thread is placed horizontally over the sample surface. The time for the flame to burn off each marker thread is measured. The vertical burning rate to each marker thread is calculated and the fastest burning rate is taken into account for classification. The European directive 95/28/EC requires a maximum 100 mm/minute.
- 17. 17 4 Tested products Selection of products for testing was made together with several of the major coach constructing companies in Norway and Sweden. Focus was set on selecting modern and representative interior products from wall, ceiling and floor constructions. In addition three different seats were selected, two coach seats of different quality plus on city bus seat. A summary of the products received is given in Table 2 below. Products Y5 and Y6 respectively Y10 and Y11 are glued together and tested as a combination. Table 2. Tested products. Product ID Y1 Y2 Y3 Y4 Y5 Y6 Y7 Y8 Y9 Y10 Y11 G1 G2 S1 S2 S3 Description PVC band/strip Fibre glass plate ABS wall panel Laminate wall panel EPS wall insulation Rubber foam wall insulation (glued to Y5) Sunscreen curtain Window curtain Needle felt 1 Needle felt 2 (glued to Y11) Needle felt 2 glued to laminate PVC flooring 1 + Plywood + insulation PVC flooring 2 + plywood Seat from coach, wool plush on PUR-foam Seat from coach, Trevira CS on PUR-foam Seat from city bus Thickness (mm) 2 4-6 3 2 15 18 0.5 0.5 4 4.5 2 mm + 18 mm + 4 mm 2 mm + 18 mm
- 18. 18 5 Test results This chapter presents a summary of the main test results. Measured relevant parameters are presented in a table for each test method. In the top rows of the tables there are present and proposed (train) criteria in other fire safety regulation systems that allows for a comparison to be made. More detailed test results and graphs are presented in Annex 1. A detailed description of the test methods is given in chapter 3. 5.1 ISO 3795 Table 3 presents results from ISO 3795 which is the main method for fire testing of interiors in buses. All materials tested comply with the demands of the bus directive except material Y5/Y6. It should be noted that the failing material is an insulating material not normally exposed in a bus construction but mounted in the wall structure behind a laminate. However it is not glued to the laminate and should therefore be tested separately in ISO 3795. Most of the materials get a zero burning rate which means that they do not ignite by the pilot flame or that they extinguish as soon as the pilot flame is removed. Table 3. ISO 3795 results. Demand/Product Vehicle directive 95/28/EC3 Y1 Y2 Y3 Y4 Y5/Y6 Y7 Y8 Y9 Y10/Y11 G1 G2 Burning rate (mm/min) < 100 0.0 0.0 18.5 0.0 122.4 0.0 0.0 87.3 0.0 0.0 0.0
- 19. 19 5.2 ISO 5660 The fire test ISO 5660 generates a large amount of fire behaviour data, e.g. curves of heat release rate. Full data sets can be found in Annex 1. Table 4 below presents the parameter MARHE used for assessing train fire safety together with peak heat release which gives a hint of how combustible a material is. The last column in Table 4 is a simulation of Euroclass17, i.e. a simulated result in the test method EN 13823 (SBI). The simulation is made using the software package ConeTools18, developed at SP Fire Technology. The software uses a cone heat release curve as input and then models the behaviour in EN 13823 or the ISO 970512 room corner test. EN 13823 is the main method for classification of surfaces in the European Construction Products Directive (CPD) and the simulated Euroclass can therefore be used to compare with the demands for public spaces. The ConeTools model is well validated against a number of materials and has a high prediction rate in the order of 80-90 % Most countries in the European Union adopt a Euroclass demand for fire safety in public spaces. As an example the Nordic countries (except Norway) has a demand of Euroclass B in all public escape routes and Euroclass C in all public spaces. Other countries have similar demands. The results indicate that only one of the tested products is below the proposed limit for trains of highest fire safety class. However, none of the products falls within Euroclass B when simulated. Three products are predicted as Euroclass E or worse, which means that they alone could cause flashover conditions in a small room within two minutes from a fire starting in a corner. Table 4. ISO 5660 results. Average values of double tests. Demand/Product MARHE (kW/m2) CEN TS 45545-2 train CPD escape routes and public spaces < 50 Peak Heat Release Rate (kW/m2) - Simulated Euroclass - - At least Euroclass B Y1 Y2 Y3 Y4 Y5/Y6 Y7, 25 kW/m2 Y8, 25 kW/m2 Y9 Y10/Y11 G1 G2 40 293 686 152 418 78 17 296 362 117 111 80 368 1130 292 614 114 158 591 728 241 176 C E or worse E or worse D E or worse D A2/B E or worse E or worse - -
- 20. 20 5.3 ISO 5659-2 and toxic gases Table 5 below gives the results from the smoke production test ISO 5659-2. Here it is possible to make comparison with both the proposed train requirements in CEN TS 45545-2 as well as the well-established demands for passenger ships (IMO)13. The IMO has different criteria for wall/ceiling linings and floorings. Smoke production from the tested products is high to very high and none of the tests yields result within the limits for either ships or trains. The extremely high value of e.g. Y2 implies a significant risk of rapid smoke filling in case of fire. A 75 x 75 mm test specimen of this material can produce smoke that results in a zero-sight within a volume of 1 m3 before 2 minutes. Table 5. ISO 5659 smoke production results. Average values of double tests. Demand/Product Dm, 25 kW/m2 CEN TS 45545-2 < 150 train IMO ships < 200 wall < 500 flooring Y1 481 Y2 983 Y3 663 Y4 233 Y5/Y6 239 Y7 137 (<200–300) Y8 126 (<200–300) Y9 Y10/Y11 G1 749 G2 843 Dm, 50 kW/m2 - Ds(4) 50 kW/m2 < 150 VOF4 50 kW/m2 < 300 < 200 wall < 500 flooring 932 1320 1320 189 377 129 247 - - - 899 1060 1185 183 211 89 234 - 1602 2038 3036 395 1199 240 738 - In the ISO 5659-2 test sampling is made for toxic and corrosive gases and measured continuously with an FTIR spectrometer. Table 6 below gives the concentrations for some of the most important substances that are regulated in IMO13 and the train proposal. For information requirements in industry standards from Bombardier19 and Airbus20 are also listed. Comparison with IMO criteria reveals the PVC materials to produce large amounts of HCl and the floorings also produce HF and CO in amounts above the limits. The gas concentrations are also evaluated after 8 minutes test time and reported as the Conventional Index of Toxicity, CIT, according to prCEN TS 45545-2.
- 21. 21 Table 6. ISO 5659-2 gas concentrations. Average values of double tests. Demand/Product CEN TS 45545-2 train IMO ships CO2 % - CO ppm - HF ppm - HCl ppm - HBr ppm - HCN ppm - - <1450 <600 <600 <600 <140 Airbus <1000 <100 <150 <150 Bombardier <3500 <100 <500 <100 <100 Y1 <1 770 <5 8500 <10 <2 Y2 3 1220 <5 40 <10 <2 Y3 4 1860 <5 <5 <10 100 Y4 2 230 <5 <5 <10 21 Y5/Y6 <1 220 <5 <5 <10 <2 Y7 <1 85 <5 110 <10 <2 Y8 <1 300 <5 <5 <10 <2 Y9 <1 310 <5 <5 <10 <2 Y10/Y11 2 250 <5 <5 <10 <2 G1 <1 800 <5 2930 <10 <2 G2 <1 1100 <5 2990 <10 <2 * SO2 limit 120 ppm for wall/ceiling and 200 ppm for floorings. 5.4 NOx ppm - SO2 ppm - <350 <120 <200* <100 <100 <100 <100 <20 <10 <20 <10 430 <10 84 <10 <20 <10 <20 <10 <20 <20 <20 <10 78 28 <20 <10 <20 <10 CIT <0.75 1.2 - 12.7 0.31 2.4 0.44 1.67 0.3 0.3 1.7 4.8 8.5 10.7 ISO 5658 Results from the Spread of flame test ISO 5658-2 are presented in Table 7 below. This test is used in the proposed regulation for trains where the criterion Critical Heat Flux at extinguishment (CHF) is corresponding to a maximum flame spread distance over the exposed surface. Together with heat release measurements this test is also used for materials in ships regulated by IMO in the IMO Resolution A.653(16). However the only measurement performed here is the spread of flame. The CHF for ships represents a flame spread distance of 380 mm approximately when the CHF for trains represents a flame spread distance of 250 - 350 mm. Y4 and Y9 pass the demands for ships but do not fulfil the highest criteria for trains. Table 7. ISO 5658-2 Spread of flame. Average values of triple tests. Demand/Product IMO ships CEN TS 45545-2 train Y1 Y2 Y3 Y4 Y5/Y6 Y9 Y10/Y11 CHF (Critical heat flux at extinguishment) ≥ 20.0 ≥ 23.9 - 37.8 16.5 3.8 1.7 26.3 1.7 30.2 5.5
- 22. 22 5.5 EN ISO 9239-1 Results from the flooring test EN ISO 9239-1 are presented in Table 8 below. Comparison is made with the train and Construction Products Directive (CPD) criteria, which are identical for the CFE parameter. CFE means the minimum level of heat flux needed to sustain burning of the material, i.e. the higher value the better fire performance. Both the tested floors meet the criteria for the highest class. The smoke production criteria for buildings are included for information. However, this parameter should not be used for smoke production assessment since the method is less suited for smoke measurement compared to the dedicated smoke test ISO 5659-2. Table 8. EN ISO 9239-1 Radiant panel test for floorings. Demand/Product CFE (Critical flux for extinguishment) CEN TS 45545-2 > 4.5 train CPD escape > 4.5 routes and public spaces G1 - test 1 7.8 G1 - test 2 6.8 G2 - test 1 7.0 G2 - test 2 7.2 5.6 Smoke production (%min) < 750 328 350 429 408 EN ISO 11925-2 Products behaviour in vertical orientation when exposed for a single flame source is tested according to EN ISO 11925-2. The results from tests of two curtains are presented in Table 9 below. The results are compared with the demands for trains and CPD criteria, which are the same. When no vertical flame spread was observed in the tests the curtains passed the criteria. Table 9. EN ISO 11925-2, single flame source test. Demand/Product CEN TS 45545-2 train CPD escape routes and public spaces Y7 Y8 Time to > 150 mm flame spread ≤60 ≤60 No flame spread No flame spread
- 23. 23 5.7 Full-scale seat tests Three types of seats were tested in full-scale. The complete seat was exposed for 2 minutes to a propane ring burner with a heat output of 30 kW. In Table 10 below the results from each test is reported. MARHE is calculated according to the procedure described in prEN 45455-2. Other parameters are total heat release and peak values of heat release and smoke production rates. The heat release rate and the smoke production rates are high. Compared to the criteria mentioned in prEN 45455-2 the calculated MARHE for these seats are very high. The mentioned criterion for the lowest security level is MARHE ≤ 75 kW and for the highest level it is MARHE ≤ 20 kW. Table 10. Full-scale seat test. Demand/Product Peak HRR (kW) CEN TS 45545-2 train S1 183 S2, test 1 264 S2, test 2 269 S3, test 1 217 S3, test 2 281 S3, test 3 277 5.8 THR (MJ) Peak SPR (m2/s) TSP (m2) MARHE (kW) ≤ 20 - 75 74 75 112 88 90 91 2.2 2.3 4.7 3.8 4.4 4.1 656 654 1782 1436 1254 1205 86 150 188 136 146 157 ISO 6941 The two curtains tested in according to EN ISO 11925-2 are also tested according to ISO 6941. It is another test with the product in vertical orientation when exposed for a single flame source. The curtains do not ignite and meet the demands described in the vehicle directive, see Table 11 below. Table 11. ISO 6941, curtain test. Demand/Product Vehicle directive 95/28/EC Y7 Y8 Burning rate (mm/min) ≤100 No ignition No ignition
- 24. 24 6 Other research within bus fire safety Since the 1970’s several research projects have been conducted within the field of automotive fire safety, mostly in the US. This chapter gives a brief summary of earlier research within this field, focusing on research that has investigated the present test requirements and its impact on the fires safety in vehicles. Many of the projects involve the main fire test for buses in Europe, ISO 3795, which is equivalent to several other standards used worldwide for automotive vehicles including buses. Similar test standards are FMVSS 302 (U.S.), BS AU 169 (UK), ST 18-502 (France), DIN 75200 (Germany), JIS D1201 (Japan), SAE J369, ASTM D5132. All these standards use the same set-up and procedure as ISO 3795 but the requirement for flame spread can differ somewhat. 6.1 ISO 3795 in Europe The principle of ISO 3795 is that a sample is held horizontally and is exposed to the action of a defined low-energy flame for 15 seconds in a combustion chamber, the flame applied on the free end of the sample. The test determines the horizontal burning rate. No criteria are mentioned in the standard but are defined by authorities. See chapter 3.1 for further details. The European directive 95/28/EC requires a burning rate of maximum 100 mm/minute.. Some manufacturers have defined their own, more severe, requirement. 6.2 FMVSS 302 in the U.S. In the United States of America the test standard FMVSS (Federal Motor Vehicle Safety Standard) 302 is used as requirement for interiors in road vehicles This is the only requirement and the criteria is that if materials in the vehicle are within 13 mm of the passenger compartment they must exhibit a horizontal flame spread rate no higher than 102 mm/min when tested against FMVSS 302. The standard is developed in the late 1960s to predict against ignition of interior materials from a lit cigarette and was brought into force in September 1972. Research in the U.S. has repeatedly found the FMVSS 302 not to provide sufficient fire safety, see following sections. 6.3 NMAB 1979, study including FMVSS 302 Already in 1979, 7 years after the standard was taken into force, FMVSS 302 was questioned. The National Materials Advisory Board (NMAB) in the US, as part of a study of the fire hazards of polymeric materials in ground transport vehicles, reviewed tests used for assessing the flammability of materials21. That study concluded the following about FMVSS 302: • “This standard prescribes a test method that tests materials only in a horizontal orientation and is considered by test experts to be totally ineffective in providing fire safety in a real fire situation.”
- 25. 25 • 6.4 “Although all these materials are required to pass FMVSS 302 with a horizontal burning rate not exceeding 4 in. per minute [102 mm], most of them are used in a vertical configuration where the actual burning state would be expected to be several times that exhibited in the horizontal configuration.” Fire performance of school bus interior components, NIST 1990 27 passengers in a school bus were killed in a crash in Carrollton, Kentucky, U.S., on the 14th of May 1988. The bus started to burn directly after the crash and the passengers were judged to have died mainly by smoke inhalation. The seat assemblies in the bus were assumed to meet the maximum flame spread rate requirements of FMVSS 302. In January, 1989, the National Highway Transportation Safety Administration (NHTSA) asked the Center for Fire Research (CFR) of the National Institute of Standards and Technology (NIST) to investigate the possibility of replacing the existing test method in FMVSS 302 with another test method or procedure that would improve the fire safety of school bus occupants beyond that currently provided by the existing test method. The investigation was reported in “Assessment of the fire performance of school bus interior components, NISTIR 4347”22. The work focused on passenger seats and small scale, large scale and full scale tests were performed. Some conclusions in the report are summarized below: • Single small scale tests (as FMVSS 302) are not suitable to verify the fire performance of materials. Consideration must be given to a combination of factors, such as ease of ignition, flame spread, rate of heat release, smoke development and toxicity of the combustion products. • Full scale tests are outlined as the most secure way to evaluate fire performance of seats. A proposal of a testing protocol is shown in the report. • Toxicity is important and it can be necessary to perform animal toxicity testing.
- 26. 26 6.5 NFPA proposal for new tests supplementing the FMVSS 302 The National Fire Protection Association (NFPA, U.S.) has written a draft proposal dated 2006 called “Guide for Identification and Development of Mitigation Strategies for Fire Hazard to Occupants of Passenger Road Vehicles, 2007 Edition”23. The below mentioned points summarize the guidelines regarding choice of interior materials in a road vehicle: • FMVSS 302 was initially intended to solve the problem of smouldering ignition caused by cigarettes, and it has been effective in doing so. With the prevalent, and growing, use of combustible materials in road vehicles (especially cars) such a mild flaming ignition test is insufficiently severe so that road vehicle materials meeting that test would allow enough time for escape to passengers and drivers in the case of a fire. • Conducting full-scale tests is clearly the most representative way of understanding where deficiencies in fire safety are present in a road vehicle and to develop mitigation strategies. It is also clear, however, that the high cost associated with conducting full-scale fire tests is likely to make their exclusive use difficult. • Testing sections, such as individual compartments of a road vehicle, for example in a furniture calorimeter, will be a way of understanding the interactions between the materials and products contained in the various sections of the road vehicle. • The cone calorimeter, NFPA 271 or ASTM E 1354 (in this document ISO 5660), is a suitable tool for selecting materials with desired fire performance properties. 6.6 Why Isn’t Ground Transportation Safe? The above question is raised in “Flame Retardancy News, October 2005” by Marcelo M. Hirschler, fire researcher in U.S. The article refers to two deadly bus fires during the same week in September 2005. The first one happened in Texas the 23rd of September where 23 people were killed because of rapid fire propagation. Some 15 people were removed before the fire and smoke development was too large. The second one took place in Poland the 30th of September and killed 11 students and sent at least 20 to hospital. The author blames the poor fire safety requirements in road vehicles. The horizontal flame spread test, FMVSS 302, ISO 3795 etc. is not providing enough safety but is unfortunately very much used world wide. The author calls up the project mentioned above “Fire performance of school bus interior components, NIST 1990” and finishes the article with one comment regarding the proposed testing protocol in the project: “The fire recommendations [NFPA] were never implemented and that is likely to be one of the reasons that road vehicle fires (and bus fires) continue being deadly”. Additionally there is recent research on fire properties of exterior automotive materials that has come to the same conclusions as above. Researchers from Southwest Research Institute in Texas published the following in 200424: “It was demonstrated in this project that the FMVSS 302 test, which is currently required for interior materials, is relatively
- 27. 27 mild and corresponds to a low level of performance in actual vehicle fires. Moreover, it is a pass/fail type test and it may not be possible to change the acceptance criteria so that actual fire performance is sufficiently improved to result in the desired reduction of motor vehicle fire injuries and fatalities.”
- 28. 28 7 Conclusions Eleven bus interior products and three types of seats have been tested for fire behaviour in several different fire test methods. Results from fire test methods used in the current European vehicle directives have been compared to results from modern fire test methods to investigate if they can give a more differentiated picture of a product’s fire performance. The results have allowed for the following conclusions to be drawn: • All materials except one fulfil the requirements in the present European vehicle directives and are far below the criteria. • When tested in methods required for passenger ships most products do not fulfil the criteria for smoke production. • Several of the tested products would most likely not be allowed in public spaces or in escape routes in buildings in Europe. The results indicate that some of them would produce flashover in less than two minutes if mounted on the walls and ceiling in a small room and exposed to a corner fire. • When compared to the proposed European standard for fire safety in passenger trains, most products do not fulfil the demands neither on heat release nor on smoke production. • The above results clearly indicate that the presently used test ISO 3795 yields a low level of safety for bus passengers in case of a fire. The low fire safety level can easily be improved using modern test methods that can differentiate fire performance. It would be beneficial to use experience from existing or proposed requirements used in other areas. • Other research in the same area has come to the same conclusions as in this project. From the conclusions it is clear that the fire safety of bus interiors should be improved. The present test requirements are obviously not designed for modern and compact vehicle designs using mostly synthetic materials and plastics. The required improvements will be accomplished within the larger research programme that is using the results and conclusions from this work in standardisation work in Europe.
- 29. 29 8 References 1 CEN TS 45545, Railway applications – Fire protection on railway vehicles – Part 2: Requirements for fire behaviour of materials and components, November 2006. 2 ISO 3795:1989, Road vehicles, and tractors and machinery for agriculture and forestry Determination of burning behaviour of interior materials, International Organization for Standardisation, 2nd ed, 2002. 3 Directive 95/28/EC of the European Parliament and of the Council of 24 October 1995 relating to the burning behaviour of materials used in the interior construction of certain categories of motor vehicle. 4 ISO 5660-1:2002. Fire tests -- Reaction to fire -- Part 1: Rate of heat release from building products - (Cone calorimeter method), International Organization for Standardisation, 2002. 5 ISO 5650-2:1994, Plastics -- Smoke generation -- Part 2: Determination of optical density by a single-chamber test, International Organization for Standardisation, 1994. 6 ISO 5658, Reaction to fire tests -- Spread of flame -- Part 2: Lateral spread on building products in vertical configuration, International Organization for Standardisation, 1996. 7 ISO 9239-1, Reaction to fire tests for floorings -- Part 1: Determination of the burning behaviour using a radiant heat source, International Organisation for Standardization, 2001. 8 EN ISO 11925-2, Reaction to fire tests -- Ignitability of building products subjected to direct impingement of flame -- Part 2: Single-flame source test, International Organization for Standardisation, 2002. 9 CBUF - Fire Safety of Upholstered furniture - The Final Report on the CBUF Research Programme, EC Report EUR 16477 EN, Interscience Communications ltd, London 1994. 10 ISO 6941, Textile fabrics - Burning behaviour - Measurement of flame spread properties of vertically oriented specimens, International Organization for Standardisation, 2003. 11 EN 13823, Reaction to fire tests for building products - Building products excluding floorings exposed to the thermal attack by a single burning item, CEN European Committee for Standardisation, Brussels, 2002. 12 ISO 9705:1993(E), Fire Tests -- Full-scale room test for surface products, ISO 1993. 13 FTP code - International Code for Application of Fire Test Procedures, Resolution MSC.61(67), International Maritime Organisation (IMO), London, 1998. 14 Recommendation on improved fire test procedures for surface flammability of bulkhead, ceiling and deck finish materials, IMO Resolution A.653(16), International Maritime Organisation, 1989.
- 30. 30 15 EN 13823, Reaction to fire tests for building products -- Building products excluding floorings exposed to the thermal attack by a single burning item, CEN European Committee for Standardisation, Brussels, 2002. 16 Technical Bulletin 133, Flammability Test Procedure for Seating Furniture for Use in Public Occupancies, Bureau of Home Furnishings and Thermal Insulation, State of California, US, 1991. 17 EN 13501-1, Fire classification of construction products and building elements - Part 1: Classification using test data from reaction to fire tests, CEN European Committee for Standardisation, Brussels, 2002. 18 Development of a Screening Method for the SBI and Room Corner using the Cone Calorimeter, SP Report 2002:11, SP Swedish National Testing- and Research Institute, Borås, 2002. 19 Y. Courcy, Bombardier Material and Process Specification SMP 800-C, Toxic Gas Generation, 1994. 20 Airbus ABD0031, Fireworthiness Requirements Pressurized Section of Fuselage, Airbus SAS 2003. 21 Committee on Fire Safety Aspects of Polymeric Materials,“Fire Safety Aspects of Polymeric Materials, Volume 8 LandTransportation Vehicles”, National Materials Advisory Board,National Academy of Sciences, Publication NMAB 318-8,Washington DC, pp. 158, 1979 [Original Reference is Ward’s Automotive Yearbook, 1975] 22 Assessment of the fire performance of school bus interior components, NISTIR 4347, NIST Galthenburg, MD 20899, 1990. 23 Report on Proposals A2006, NFPA 556, Guide for Identification and Development of Mitigation Strategies for Fire Hazard to Occupants of Passenger Road Vehicles, 2007 Edition 24 K. Battipaglia, J. Huczek, M. Janssens, M. Miller & K. Willson, Southwest Research Institute, USA, “Fire properties of exterior automotive materials”, Flame Retardants, San Fransisco, 2004.
- 31. ANNEX A1 Detailed test results 8.1 ISO 3795 Y1 Test no 1 2 3 4 5 Burnt distance, mm 0 0 0 0 0 Burning time, s 0 0 0 0 0 Burning rate, mm/min 0 0 0 0 0 In all tests the flames died out before reaching the first measuring point. Y2 Test no 1 2 3 4 5 Burnt distance, mm 0 0 0 0 0 Burning time, s 0 0 0 0 0 Burning rate, mm/min 0 0 0 0 0 In test no 1 the flames died out before reaching the first measuring point. Due to a very low burning rate, test no 2 - 5 were terminated after flames reached half the test length. Y3 Test no 1 2 3 4 5 Burnt distance, mm 254 254 254 254 254 Burning time, s 775 916 777 772 875 Burning rate, mm/min 20 16 20 20 17 In all tests burning droplets fell from the sample. Y4 Test no 1 2 3 4 5 Burnt distance, mm 0 0 0 0 0 Burning time, s 0 0 0 0 0 Burning rate, mm/min 0 0 0 0 0 In all tests the flames died out before reaching the first measuring point.
- 32. 32 Y5/Y6 Test no 1 2 3 4 5 Burnt distance, mm 254 254 254 254 254 Burning time, s 131 123 127 119 123 Burning rate, mm/min 116 124 120 128 124 In all tests burning droplets fell from the sample. Y7 Test no 1 2 3 4 5 Burnt distance, mm 0 0 0 0 0 Burning time, s 0 0 0 0 0 Burning rate, mm/min 0 0 0 0 0 In all tests the flames died out before reaching the first measuring point. Y8 Test no 1 2 3 4 5 Burnt distance, mm 0 0 0 0 0 Burning time, s 0 0 0 0 0 Burning rate, mm/min 0 0 0 0 0 In all tests the flames died out before reaching the first measuring point. Y9 Test no 1 2 3 4 5 Burnt distance, mm 254 254 254 254 254 Burning time, s 177 173 184 163 177 Burning rate, mm/min 86 88 83 93 86 In all tests burning droplets fell from the sample. Y10/Y11 Test no 1 2 3 4 5 Burnt distance, mm 0 0 0 0 0 Burning time, s 0 0 0 0 0 Burning rate, mm/min 0 0 0 0 0 In all tests the flames died out before reaching the first measuring point.
- 33. 33 G1 Test no 1 2 3 4 5 Burnt distance, mm 0 0 0 0 0 Burning time, s 0 0 0 0 0 Burning rate, mm/min 0 0 0 0 0 In all tests the flames died out before reaching the first measuring point. G2 Test no 1 2 3 4 5 Burnt distance, mm 0 0 0 0 0 Burning time, s 0 0 0 0 0 Burning rate, mm/min 0 0 0 0 0 In all tests the flames died out before reaching the first measuring point. S1, fabric Test no 1 2 3 4 5 Burnt distance, mm 0 0 0 0 0 Burning time, s 0 0 0 0 0 Burning rate, mm/min 0 0 0 0 0 In all tests the flames died out before reaching the first measuring point. S2, fabric Test no 1 2 3 4 5 Burnt distance, mm 0 40 0 0 0 Burning time, s 0 95 0 0 0 Burning rate, mm/min 0 25 0 0 0 In test no 1, 3 - 5 the flames died out before reaching the first measuring point. In all tests burning droplets fell from the sample. S1 and S2, foam Test no 1 2 3 4 5 Burnt distance, mm 0 0 0 0 0 Burning time, s 0 0 0 0 0 Burning rate, mm/min 0 0 0 0 0 In all tests the flames died out before reaching the first measuring point.
- 34. 34 S3, fabric Test no 1 2 3 4 5 Burnt distance, mm 0 0 0 0 0 Burning time, s 0 0 0 0 0 Burning rate, mm/min 0 0 0 0 0 In all tests the flames died out before reaching the first measuring point. S3, foam Test no 1 2 3 4 5 Burnt distance, mm 127 127 127 0 127 Burning time, s 91 97 128 0 108 Burning rate, mm/min 84 78 59 0 70 In test no 4 the flames died out before reaching the first measuring point. Due to the length of the specimen, test no 1 - 3 and 5 was terminated. In all tests burning droplets fell from the sample.
- 35. 35 8.2 ISO 5660 Y1 – PVC band/strip Test specification Irradiance level: Calibration constant (C): Orientation: Backing: Fastening: Note 50 kW/m2. 0.0431 m1/2 g1/2 K1/2. Horizontal. No other than the non-combustible required in the standard. The product was cut in stripes to form a plane surface and loosely put on the backing. The retainer frame was used. Test results The explanation of the parameters is shown in 5.2.13 below. Property Name of Test 1 variable Flashing (min:s) Glowing (min:s) Ignition (min:s) All flaming ceased (min:s) Test time (min:s) Heat release rate (kW/m2) Peak heat release rate (kW/m2) Average heat release, 3 min (kW/m2) Average heat release, 5 min (kW/m2) Total heat produced (MJ/m2) Smoke production rate (m2/m2s) Peak smoke production (m2/m2s) Total smoke production over the nonflaming phase (m2/m2) Total smoke production over the flaming phase (m2/m2) Total smoke production (m2/m2) Sample mass before test (g) Sample mass at sustained flaming (g) Sample mass after test (g) Average mass loss rate (g/m2s) Average mass loss rate (g/m2s) Total mass loss (g/m2) Effective heat of combustion (MJ/kg) Specific smoke production (m2/kg) Volume flow in exhaust duct (l/s) tflash tflash tign text ttest q qmax q180 q300 THR SPR SPRmax 00:53 05:34 01:03 NI 04:50 NI 06:50 10:00 See figure 1 133 27 105 84 27.1 8.2 See figure 2 14.45 10.84 12.65 TSPnonfl 324.0 - 324.0 TSPfl TSP M0 Ms Mf MLRign-end MLR10-90 TML ΔHc SEA V 1260 1584 28.5 26.0 4.9 6.4 10.9 2390 11.3 663 24 28.3 4.6 8.3 24 1260 1584 28.4 26.0 4.8 6.4 9.6 2390 11.3 663 24 NI = no ignition Test 2 Average value 00:53 05:34 01:03 04:50 08:25 80 105 84 17.7
- 36. 36 Graphs of heat release rate and smoke production rate BRm6083 160 kW/m² 120 T est 1 80 T est 2 40 0 0 2 4 6 Time (min) Figure 1 Heat release rate for Y1, duplicate tests at an irradiance of 50 kW/m2. BRm6083 16 m²/m²s 12 T est 1 8 T est 2 4 0 0 2 4 6 Time (min) Figure 2 Smoke production rate for Y1, duplicate tests at an irradiance of 50 kW/m2.
- 37. 37 Y2 – Fibre glass plate Test specification Irradiance level: Calibration constant (C): Orientation: Backing: Fastening: Note 50 kW/m2. Test 1, 0.0431 m1/2 g1/2 K1/2 and test 2, 0.0425 m1/2 g1/2 K1/2 Horizontal. No other than the non-combustible required in the standard. The product was loosely put on the backing. The retainer frame was used. Test results The explanation of the parameters is shown in 8.2.1 below. Property Name of Test 1 variable Test 2 Average value Flashing (min:s) Ignition (min:s) All flaming ceased (min:s) Test time (min:s) Heat release rate (kW/m2) Peak heat release rate (kW/m2) Average heat release, 3 min (kW/m2) Average heat release, 5 min (kW/m2) Total heat produced (MJ/m2) Smoke production rate (m2/m2s) Peak smoke production (m2/m2s) Total smoke production over the nonflaming phase (m2/m2) Total smoke production over the flaming phase (m2/m2) Total smoke production (m2/m2) Sample mass before test (g) Sample mass at sustained flaming (g) Sample mass after test (g) Average mass loss rate (g/m2s) Average mass loss rate (g/m2s) Total mass loss (g/m2) Effective heat of combustion (MJ/kg) Specific smoke production (m2/kg) Volume flow in exhaust duct (l/s) tflash tign text ttest q qmax q180 q300 THR SPR SPRmax 00:24 00:22 08:16 08:50 10:16 10:50 See figure 1 370 365 300 287 317 308 113.2 113.8 See figure 2 18.49 19.42 TSPnonfl 0.7 1.4 1.1 TSPfl TSP M0 Ms Mf MLRign-end MLR10-90 TML ΔHc SEA V 4779 4780 65.3 65.9 20.3 8.7 15.5 5193 21.8 921 24 5249 5250 66.2 66.1 20.2 8.3 15.0 5220 21.8 1006 24 5014 5015 65.8 66.0 20.2 8.5 15.3 5206 21.8 963 24 00:23 08:33 10:33 368 293 312 113.5 18.95
- 38. 38 Graphs of heat release rate and smoke production rate BRm6083 400 kW/m² 300 T est 1 200 T est 2 100 0 0 4 8 Time (min) Figure 1 Heat release rate for Y2, duplicate tests at an irradiance of 50 kW/m2. BRm6083 25 20 m²/m²s 15 T est 1 T est 2 10 5 0 0 4 8 Time (min) Figure 2 Smoke production rate for Y2, duplicate tests at an irradiance of 50 kW/m2.
- 39. 39 Y3 – ABS wall panel Test specification Irradiance level: Calibration constant (C): Orientation: Backing: Fastening: Note 50 kW/m2. Test 1, 0.0431 m1/2 g1/2 K1/2 and test 2, 0.0427 m1/2 g1/2 K1/2 Horizontal. No other than the non-combustible required in the standard. The product was loosely put on the backing. The retainer frame was used. Test results The explanation of the parameters is shown in 8.2.1 below. Property Name of Test 1 variable Test 2 Average value Flashing (min:s) Ignition (min:s) All flaming ceased (min:s) Test time (min:s) Heat release rate (kW/m2) Peak heat release rate (kW/m2) Average heat release, 3 min (kW/m2) Average heat release, 5 min (kW/m2) Total heat produced (MJ/m2) Smoke production rate (m2/m2s) Peak smoke production (m2/m2s) Total smoke production over the nonflaming phase (m2/m2) Total smoke production over the flaming phase (m2/m2) Total smoke production (m2/m2) Sample mass before test (g) Sample mass at sustained flaming (g) Sample mass after test (g) Average mass loss rate (g/m2s) Average mass loss rate (g/m2s) Total mass loss (g/m2) Effective heat of combustion (MJ/kg) Specific smoke production (m2/kg) Volume flow in exhaust duct (l/s) tflash tign text ttest q qmax q180 q300 THR SPR SPRmax 00:21 00:24 04:48 05:50 06:48 07:50 See figure 1 1153 1110 584 572 362 364 109.9 112.9 See figure 2 42.19 46.70 00:23 05:19 07:19 TSPnonfl 1.2 2.8 2.0 TSPfl TSP M0 Ms Mf MLRign-end MLR10-90 TML ΔHc SEA V 4143 4144 32.1 32.2 0.1 9.4 25.6 3653 30.1 1135 24 4169 4172 32.0 31.8 0.0 8.3 23.3 3675 30.7 1135 24 4156 4158 32.1 32.0 0.1 8.8 24.5 3664 30.4 1135 24 1132 578 363 111.4 44.45
- 40. 40 Graphs of heat release rate and smoke production rate BRm6083 1160 kW/m² 870 T est 1 580 T est 2 290 0 0 2 4 6 Time (min) Figure 1 Heat release rate for Y3, duplicate tests at an irradiance of 50 kW/m2. BRm6083 60 m²/m²s 40 T est 1 T est 2 20 0 0 2 4 6 Time (min) Figure 2 Smoke production rate for Y3, duplicate tests at an irradiance of 50 kW/m2.
- 41. 41 Y4 – Laminate wall panel Test specification Irradiance level: Calibration constant (C): Orientation: Backing: Fastening: Note 50 kW/m2. Test 1, 0.0431 m1/2 g1/2 K1/2 and test 2, 0.0427 m1/2 g1/2 K1/2 Horizontal. No other than the non-combustible required in the standard. The product was loosely put on the backing. The retainer frame was used. Test results The explanation of the parameters is shown in 8.2.1 below. Property Name of Test 1 variable Test 2 Average value Flashing (min:s) Ignition (min:s) All flaming ceased (min:s) Test time (min:s) Heat release rate (kW/m2) Peak heat release rate (kW/m2) Average heat release, 3 min (kW/m2) Average heat release, 5 min (kW/m2) Total heat produced (MJ/m2) Smoke production rate (m2/m2s) Peak smoke production (m2/m2s) Total smoke production over the nonflaming phase (m2/m2) Total smoke production over the flaming phase (m2/m2) Total smoke production (m2/m2) Sample mass before test (g) Sample mass at sustained flaming (g) Sample mass after test (g) Average mass loss rate (g/m2s) Average mass loss rate (g/m2s) Total mass loss (g/m2) Effective heat of combustion (MJ/kg) Specific smoke production (m2/kg) Volume flow in exhaust duct (l/s) tflash tign text ttest q qmax q180 q300 THR SPR SPRmax 00:48 00:42 06:04 07:05 08:04 09:05 See figure 1 269 316 163 159 119 122 42.0 47.6 See figure 2 6.42 4.96 TSPnonfl 80.8 80.1 80.5 TSPfl TSP M0 Ms Mf MLRign-end MLR10-90 TML ΔHc SEA V 204 284 27.4 26.3 3.7 6.1 8.3 2565 16.4 111 24 197 277 27.8 35.6 2.7 10.2 11.6 3734 12.7 74 24 200 281 27.6 30.9 3.2 8.2 10.0 3149 14.6 93 24 00:45 06:34 08:34 292 161 120 44.8 5.69
- 42. 42 Graphs of heat release rate and smoke production rate BRm6083 320 kW/m² 240 T est 1 160 T est 2 80 0 0 2 4 6 8 Time (min) Figure 1 Heat release rate for Y4, duplicate tests at an irradiance of 50 kW/m2. BRm6083 8 m²/m²s 6 T est 1 4 T est 2 2 0 0 2 4 6 8 Time (min) Figure 2 Smoke production rate for Y4, duplicate tests at an irradiance of 50 kW/m2.
- 43. 43 Y5/Y6 – EPS + rubber wall insulation Test specification Irradiance level: Calibration constant (C): Orientation: Backing: Fastening: Note 50 kW/m2. Test 1, 0.0431 m1/2 g1/2 K1/2 and test 2, 0.0425 m1/2 g1/2 K1/2 Horizontal. No other than the non-combustible required in the standard. The product was loosely put on the backing. The retainer frame was used. Test results The explanation of the parameters is shown in 8.2.1 below. Property Name of Test 1 variable Test 2 Average value Flashing (min:s) Ignition (min:s) All flaming ceased (min:s) Test time (min:s) Heat release rate (kW/m2) Peak heat release rate (kW/m2) Average heat release, 3 min (kW/m2) Average heat release, 5 min (kW/m2) Total heat produced (MJ/m2) Smoke production rate (m2/m2s) Peak smoke production (m2/m2s) Total smoke production over the nonflaming phase (m2/m2) Total smoke production over the flaming phase (m2/m2) Total smoke production (m2/m2) Sample mass before test (g) Sample mass at sustained flaming (g) Sample mass after test (g) Average mass loss rate (g/m2s) Average mass loss rate (g/m2s) Total mass loss (g/m2) Effective heat of combustion (MJ/kg) Specific smoke production (m2/kg) Volume flow in exhaust duct (l/s) tflash tign text ttest q qmax q180 q300 THR SPR SPRmax 00:03 00:02 01:12 01:08 03:12 03:08 See figure 1 612 616 82 80 49 48 15.3 14.9 See figure 2 22.24 23.59 TSPnonfl 4.4 0.4 2.4 TSPfl TSP M0 Ms Mf MLRign-end MLR10-90 TML ΔHc SEA V 577 581 4.5 4.5 0.0 2.7 13.2 510 27.4 1142 24 565 566 4.5 4.5 0.0 2.7 11.3 510 29.3 1110 24 571 573 4.5 4.5 0.0 2.7 12.2 510 28.3 1126 24 00:02 01:10 03:10 614 81 49 15.1 22.92
- 44. 44 Graphs of heat release rate and smoke production rate BRm6083 640 kW/m² 480 T est 1 320 T est 2 160 0 0 2 4 Time (min) Figure 1 Heat release rate for Y5/Y6, duplicate tests at an irradiance of 50 kW/m2. BRm6083 30 24 m²/m²s 18 T est 1 T est 2 12 6 0 0 2 4 Time (min) Figure 2 Smoke production rate for Y5/Y6, duplicate tests at an irradiance of 50 kW/m2.
- 45. 45 Y7 – Sunscreen curtain Test specification Irradiance level: Calibration constant (C): Orientation: Backing: Fastening: Note 25 kW/m2. 0.0427 m1/2 g1/2 K1/2. Horizontal. No other than the non-combustible required in the standard. The product was loosely put on the backing. The retainer frame was used. Test results The explanation of the parameters is shown in 8.2.1 below. Property Name of Test 1 variable Test 2 Average value Flashing (min:s) Ignition (min:s) All flaming ceased (min:s) Test time (min:s) Heat release rate (kW/m2) Peak heat release rate (kW/m2) Average heat release, 3 min (kW/m2) Average heat release, 5 min (kW/m2) Total heat produced (MJ/m2) Smoke production rate (m2/m2s) Peak smoke production (m2/m2s) Total smoke production over the nonflaming phase (m2/m2) Total smoke production over the flaming phase (m2/m2) Total smoke production (m2/m2) Sample mass before test (g) Sample mass at sustained flaming (g) Sample mass after test (g) Average mass loss rate (g/m2s) Average mass loss rate (g/m2s) Total mass loss (g/m2) Effective heat of combustion (MJ/kg) Specific smoke production (m2/kg) Volume flow in exhaust duct (l/s) *Transitory flaming. tflash tign text ttest q qmax q180 q300 THR SPR SPRmax 00:07 00:07 00:15* 00:26* 02:15 02:26 See figure 1 121 108 18 25 11 15 3.6 4.8 See figure 2 12.45 12.36 TSPnonfl -* -* -* TSPfl TSP M0 Ms Mf MLRign-end MLR10-90 TML ΔHc SEA V -* 157 3.9 -* 1.7 -* 2.1 235 15.2 668 24 -* 154 3.7 -* 1.9 -* 2.9 205 23.4 753 24 -* 156 3.8 -* 1.8 -* 2.5 220 19.3 711 24 00:07 00:21* 02:21 114 22 13 4.2 12.41
- 46. 46 Graphs of heat release rate and smoke production rate BRm6083 160 kW/m² 120 T est 1 80 T est 2 40 0 0 2 Time (min) Figure 1 Heat release rate for Y7, duplicate tests at an irradiance of 25 kW/m2. BRm6083 16 m²/m²s 12 T est 1 8 T est 2 4 0 0 2 Time (min) Figure 2 Smoke production rate for Y7, duplicate tests at an irradiance of 25 kW/m2.
- 47. 47 Y8 – Window curtain Test specification Irradiance level: Calibration constant (C): Orientation: Backing: Fastening: Note 25 kW/m2. 0.0427 m1/2 g1/2 K1/2. Horizontal. No other than the non-combustible required in the standard. The product was loosely put on the backing. The retainer frame was used. Test results The explanation of the parameters is shown in 8.2.1 below. Property Name of Test 1 variable Test 2 Average value Flashing (min:s) Ignition (min:s) All flaming ceased (min:s) Test time (min:s) Heat release rate (kW/m2) Peak heat release rate (kW/m2) Average heat release, 3 min (kW/m2) Average heat release, 5 min (kW/m2) Total heat produced (MJ/m2) Smoke production rate (m2/m2s) Peak smoke production (m2/m2s) Total smoke production over the nonflaming phase (m2/m2) Total smoke production over the flaming phase (m2/m2) Total smoke production (m2/m2) Sample mass before test (g) Sample mass at sustained flaming (g) Sample mass after test (g) Average mass loss rate (g/m2s) Average mass loss rate (g/m2s) Total mass loss (g/m2) Effective heat of combustion (MJ/kg) Specific smoke production (m2/kg) Volume flow in exhaust duct (l/s) tflash tign text ttest q qmax q180 q300 THR SPR SPRmax 08:58 03:41 09:31 03:56 11:31 05:56 See figure 1 150 167 27 12 16 7 10.1 6.4 See figure 2 7.51 6.42 TSPnonfl 60.7 109.8 85.3 TSPfl TSP M0 Ms Mf MLRign-end MLR10-90 TML ΔHc SEA V 78 138 2.5 1.4 0.0 0.7 3.6 163 61.9 849 24 19 129 2.3 0.5 0.0 0.6 2.2 54 118.1 2401 24 49 134 2.4 0.9 0.0 0.7 2.9 108 90.0 1625 24 06:19 06:44 08:43 158 20 12 8.2 6.96
- 48. 48 Graphs of heat release rate and smoke production rate BRm6083 200 kW/m² 150 T est 1 100 T est 2 50 0 0 4 8 Time (min) Figure 1 Heat release rate for Y8, duplicate tests at an irradiance of 25 kW/m2. BRm6083 10 8 m²/m²s 6 T est 1 T est 2 4 2 0 0 4 8 Time (min) Figure 2 Smoke production rate for Y8, duplicate tests at an irradiance of 25 kW/m2.
- 49. 49 Y9 – Needle felt 1 Test specification Irradiance level: Calibration constant (C): Orientation: Backing: Fastening: Note 50 kW/m2. 0.0427 m1/2 g1/2 K1/2. Horizontal. No other than the non-combustible required in the standard. The product was loosely put on the backing. The retainer frame was used. Test results The explanation of the parameters is shown in 8.2.1 below. Property Name of Test 1 variable Test 2 Average value Flashing (min:s) Ignition (min:s) All flaming ceased (min:s) Test time (min:s) Heat release rate (kW/m2) Peak heat release rate (kW/m2) Average heat release, 3 min (kW/m2) Average heat release, 5 min (kW/m2) Total heat produced (MJ/m2) Smoke production rate (m2/m2s) Peak smoke production (m2/m2s) Total smoke production over the nonflaming phase (m2/m2) Total smoke production over the flaming phase (m2/m2) Total smoke production (m2/m2) Sample mass before test (g) Sample mass at sustained flaming (g) Sample mass after test (g) Average mass loss rate (g/m2s) Average mass loss rate (g/m2s) Total mass loss (g/m2) Effective heat of combustion (MJ/kg) Specific smoke production (m2/kg) Volume flow in exhaust duct (l/s) tflash tign text ttest q qmax q180 q300 THR SPR SPRmax 00:17 00:17 02:54 02:55 04:54 04:55 See figure 1 628 554 97 85 59 53 17.9 15.9 See figure 2 8.46 6.58 TSPnonfl 0.6 1.1 0.8 TSPfl TSP M0 Ms Mf MLRign-end MLR10-90 TML ΔHc SEA V 202 203 4.9 4.8 0.8 1.6 5.3 449 39.9 452 24 165 166 4.2 4.2 1.1 1.3 3.5 356 44.8 467 24 184 184 4.5 4.5 0.9 1.4 4.4 402 42.4 460 24 00:17 02:54 04:55 591 91 56 16.9 7.52
- 50. 50 Graphs of heat release rate and smoke production rate BRm6083 640 kW/m² 480 T est 1 320 T est 2 160 0 0 2 4 Time (min) Figure 1 Heat release rate for Y9, duplicate tests at an irradiance of 50 kW/m2. BRm6083 12 m²/m²s 9 T est 1 6 T est 2 3 0 0 2 4 Time (min) Figure 2 Smoke production rate for Y9, duplicate tests at an irradiance of 50 kW/m2.
- 51. 51 Y10/Y11 – Needle felt 2 + Laminate Test specification Irradiance level: Calibration constant (C): Orientation: Backing: Fastening: Note 50 kW/m2. 0.0425 m1/2 g1/2 K1/2. Horizontal. No other than the non-combustible required in the standard. The product was loosely put on the backing. The retainer frame was used. Test results The explanation of the parameters is shown in 8.2.1 below. Property Name of Test 1 variable Test 2 Average value Flashing (min:s) Ignition (min:s) All flaming ceased (min:s) Test time (min:s) Heat release rate (kW/m2) Peak heat release rate (kW/m2) Average heat release, 3 min (kW/m2) Average heat release, 5 min (kW/m2) Total heat produced (MJ/m2) Smoke production rate (m2/m2s) Peak smoke production (m2/m2s) Total smoke production over the nonflaming phase (m2/m2) Total smoke production over the flaming phase (m2/m2) Total smoke production (m2/m2) Sample mass before test (g) Sample mass at sustained flaming (g) Sample mass after test (g) Average mass loss rate (g/m2s) Average mass loss rate (g/m2s) Total mass loss (g/m2) Effective heat of combustion (MJ/kg) Specific smoke production (m2/kg) Volume flow in exhaust duct (l/s) tflash tign text ttest q qmax q180 q300 THR SPR SPRmax 00:11 00:10 03:32 03:52 05:32 05:52 See figure 1 763 693 277 256 191 175 58.9 54.5 See figure 2 6.18 6.69 TSPnonfl 0.7 0.4 0.5 TSPfl TSP M0 Ms Mf MLRign-end MLR10-90 TML ΔHc SEA V 460 461 34.2 34.2 8.6 9.0 20.8 2916 20.2 158 24 379 380 32.7 32.5 7.0 8.4 17.1 2901 18.8 131 24 420 420 33.5 33.4 7.8 8.7 18.9 2909 19.5 144 24 00:11 03:42 05:42 728 266 183 56.7 6.44
- 52. 52 Graphs of heat release rate and smoke production rate BRm6083 800 kW/m² 600 T est 1 400 T est 2 200 0 0 2 4 Time (min) Figure 1 Heat release rate for Y10/Y11, duplicate tests at an irradiance of 50 kW/m2. BRm6083 8 m²/m²s 6 T est 1 4 T est 2 2 0 0 2 4 Time (min) Figure 2 Smoke production rate for Y10/Y11, duplicate tests at an irradiance of 50 kW/m2.
- 53. 53 G1 – Flooring system 1 Test specification Irradiance level: Calibration constant (C): Orientation: Backing: Fastening: Note 25 kW/m2. 0.0431 m1/2 g1/2 K1/2. Horizontal. No other than the non-combustible required in the standard. The product was loosely put on the backing. The retainer frame was used. Test results The explanation of the parameters is shown in 8.2.1 below. Property Name of Test 1 variable Test 2 Average value Flashing (min:s) Ignition (min:s) All flaming ceased (min:s) Test time (min:s) Heat release rate (kW/m2) Peak heat release rate (kW/m2) Average heat release, 3 min (kW/m2) Average heat release, 5 min (kW/m2) Total heat produced (MJ/m2) Smoke production rate (m2/m2s) Peak smoke production (m2/m2s) Total smoke production over the nonflaming phase (m2/m2) Total smoke production over the flaming phase (m2/m2) Total smoke production (m2/m2) Sample mass before test (g) Sample mass at sustained flaming (g) Sample mass after test (g) Average mass loss rate (g/m2s) Average mass loss rate (g/m2s) Total mass loss (g/m2) Effective heat of combustion (MJ/kg) Specific smoke production (m2/kg) Volume flow in exhaust duct (l/s) tflash tign text ttest q qmax q180 q300 THR SPR SPRmax 01:02 01:00 11:57 20:00 13:57 20:00 See figure 1 245 237 147 146 119 119 67.6 68.0 See figure 2 21.50 20.12 TSPnonfl 17.4 9.5 13.5 TSPfl TSP M0 Ms Mf MLRign-end MLR10-90 TML ΔHc SEA V 2103 2121 226.2 225.9 180.5 6.7 7.3 5150 13.1 412 24 2061 2071 249.0 249.1 192.0 5.7 5.6 6491 10.5 319 24 2082 2096 237.6 237.5 186.3 6.2 6.4 5821 11.8 365 24 01:01 15:59 16:59 241 147 119 67.8 20.81
- 54. 54 Graphs of heat release rate and smoke production rate BRm6083 280 kW/m² 210 T est 1 140 T est 2 70 0 0 4 8 12 Time (min) Figure 1 Heat release rate for G1, duplicate tests at an irradiance of 25 kW/m2. BRm6083 24 m²/m²s 18 T est 1 12 T est 2 6 0 0 4 8 12 Time (min) Figure 2 Smoke production rate for G1, duplicate tests at an irradiance of 25 kW/m2.
- 55. 55 G2 – Flooring system 2 Test specification Irradiance level: Calibration constant (C): Orientation: Backing: Fastening: Note 25 kW/m2. 0.0431 m1/2 g1/2 K1/2. Horizontal. No other than the non-combustible required in the standard. The product was loosely put on the backing. The retainer frame was used. Test results The explanation of the parameters is shown in 8.2.1 below. Property Name of Test 1 variable Test 2 Average value Flashing (min:s) Ignition (min:s) All flaming ceased (min:s) Test time (min:s) Heat release rate (kW/m2) Peak heat release rate (kW/m2) Average heat release, 3 min (kW/m2) Average heat release, 5 min (kW/m2) Total heat produced (MJ/m2) Smoke production rate (m2/m2s) Peak smoke production (m2/m2s) Total smoke production over the nonflaming phase (m2/m2) Total smoke production over the flaming phase (m2/m2) Total smoke production (m2/m2) Sample mass before test (g) Sample mass at sustained flaming (g) Sample mass after test (g) Average mass loss rate (g/m2s) Average mass loss rate (g/m2s) Total mass loss (g/m2) Effective heat of combustion (MJ/kg) Specific smoke production (m2/kg) Volume flow in exhaust duct (l/s) tflash tign text ttest q qmax q180 q300 THR SPR SPRmax 01:12 00:56 06:40 12:30 08:40 12:30 See figure 1 182 169 150 142 121 125 38.9 51.1 See figure 2 16.41 14.00 TSPnonfl 25.3 6.8 16.0 TSPfl TSP M0 Ms Mf MLRign-end MLR10-90 TML ΔHc SEA V 2233 2259 156.9 155.7 127.6 7.1 7.7 3199 12.2 706 24 2227 2234 155.2 155.0 115.7 6.4 6.4 4472 11.4 500 24 2230 2246 156.0 155.4 121.6 6.7 7.0 3835 11.8 603 24 01:04 09:35 10:35 176 146 123 45.0 15.20
- 56. 56 Graphs of heat release rate and smoke production rate BRm6083 200 kW/m² 150 T est 1 100 T est 2 50 0 0 2 4 6 8 Time (min) Figure 1 Heat release rate for G2, duplicate tests at an irradiance of 25 kW/m2. BRm6083 20 m²/m²s 15 T est 1 10 T est 2 5 0 0 2 4 6 8 Time (min) Figure 2 Smoke production rate for G2, duplicate tests at an irradiance of 25 kW/m2.
- 57. 57 S1, S2 and S3 - Seats Test specification Irradiance level: Calibration constant (C): Orientation: Backing: Fastening: Note 50 kW/m2. 0.0431 m1/2 g1/2 K1/2. Horizontal. No other than the non-combustible required in the standard. The product was loosely put on the backing. The combination of fabric and foam was tested. The foam had a thickness off 50 mm approximately. The retainer frame was used. Test results The explanation of the parameters is shown in 8.2.1 below. Property Name of S1 variable S2 S3 Flashing (min:s) Ignition (min:s) All flaming ceased (min:s) Test time (min:s) Heat release rate (kW/m2) Peak heat release rate (kW/m2) Average heat release, 3 min (kW/m2) Average heat release, 5 min (kW/m2) Total heat produced (MJ/m2) Smoke production rate (m2/m2s) Peak smoke production (m2/m2s) Total smoke production over the nonflaming phase (m2/m2) Total smoke production over the flaming phase (m2/m2) Total smoke production (m2/m2) Sample mass before test (g) Sample mass at sustained flaming (g) Sample mass after test (g) Average mass loss rate (g/m2s) Average mass loss rate (g/m2s) Total mass loss (g/m2) Effective heat of combustion (MJ/kg) Specific smoke production (m2/kg) Volume flow in exhaust duct (l/s) tflash tign text ttest q qmax q180 q300 THR SPR SPRmax 00:06 00:21* 06:54 05:29 08:54 07:29 See figure 1 475 475 266 387 293 297 101.6 93.0 See figure 2 5.40 7.99 TSPnonfl 1.2 15.2 47.2 TSPfl TSP M0 Ms Mf MLRign-end MLR10-90 TML ΔHc SEA V 936 937 38.6 38.4 0.9 8.1 12.1 4251 23.9 220 24 1092 1107 36.1 35.6 2.0 9.1 15.7 3812 24.4 290 24 1301 1349 28.1 27.2 1.7 6.4 14.0 2907 23.4 464 24 00:27* 05:59 07:59 450 316 212 68.1 14.06 * The time to ignition is insecure when the surface was deformed and disturbed the ignition sparkle.
- 58. 58 Graphs of heat release rate and smoke production rate BRm6083 480 kW/m² 360 S1 S2 240 S3 120 0 0 2 4 6 8 Time (min) Figure 1 Heat release rate for S1, S2 and S3, single test on each seat at an irradiance of 50 kW/m2. BRm6083 16 m²/m²s 12 S1 S2 8 S3 4 0 0 2 4 6 8 Time (min) Figure 2 Smoke production rate for S1, S2 and S3, single test on each seat at an irradiance of 50 kW/m2.
- 59. 59 8.2.1 ISO 5660 parameter explanation Parameter Explanation Test start The test specimen is subjected to the irradiance and the clock is started. tflash Time from test start until flames with shorter duration than 1 s. tign Time from test start until sustained flaming with duration more than 10 s. Text Time from test start until the flames have died out. End of test Defined as the time when both, the product has been extinguished for 2 minutes, and the mass loss is less than 150 g/m2 during 1 minute. Ttest Test time. From test start until end of test. qmax Peak heat release rate during the entire test. q180 Average heat release rate during 3 minutes from ignition. If the test is terminated before, the heat release rate is taken as 0 from the end of test. q300 Average heat release rate during 5 minutes from ignition. If the test is terminated before, the heat release rate is taken as 0 from the end of test. THR Total Heat Released from test start until end of test. SPRmax Peak Smoke Production Rate from test start until end of test. TSP Total Smoke Produced from test start until end of test. M0 Mass of specimen. Ms Mass of specimen at sustained flaming. Mf Mass of specimen at the end of the test. MLRign-end Mass Loss Rate. Average mass loss rate from ignition until end of test. MLR10-90 Mass Loss Rate. Average mass loss rate between 10% and 90% of mass loss. TML Total mass loss from ignition until end of test. ΔHc Effective heat of combustion calculated as the ratio between total energy released and total mass loss calculated from ignition until end of test. SEA Specific Extinction Area defined as the ratio between total smoke released and total mass loss calculated from test start until end of test. V Volume flow rate in exhaust duct. Average during the test.
- 60. 60 8.3 ISO 5659-2 and toxic gases Y1 – PVC band/strip Light Transmission – Non-flaming exposure (Irradiance 25 kW/m2) 100 Test 1 Test 2 Light Transmission (%) 80 60 40 20 0 0 4 8 12 16 20 Time (min) Light Transmission – Non-flaming exposure (Irradiance 50 kW/m2) 100 Test 3 Test 4 Light Transmission (%) 80 60 40 20 0 0 2 4 6 Time (min) 8 10
- 61. 61 Smoke results The explanation of the parameters is shown in 8.3.1 below. Mode Test no Ds,max Dc Duration of test, s Irradiance 25kW/m², Non-flaming exposure 1 2 452 509 31 37 1200 1200 Mode Test no Ds,max Ds(4) VOF4 Dc Duration of test, s Irradiance 50kW/m², Non-flaming exposure 3 4 913 951 903 895 1666 1602 57 67 600 600 Mean 481(Dm) Mean 932 (Dm) 899 1634 Note None of the specimens tested in mode 1 (Irradiance 25 kW/m2, Non-flaming exposure) ignited. All of the specimens tested in mode 3 (Irradiance 50 kW/m2, Non-flaming exposure) ignited. Gas analysis The following gas concentrations were measured in the test chamber. The gas samples were taken from the geometrical centre of the test chamber. The concentrations of the different gas species were measured with FTIR gas analysis. The gas concentrations are evaluated after 8 minutes test time and reported as the Conventional Index of Toxicity, CIT, according to CEN TS 45545-2. Gas species Measured concentration during non-flaming exposure (Irradiance of 25 kW/m2). [ppm] Measured concentration during non-flaming exposure (Irradiance of 50 kW/m2). [ppm] CO 390 770 HCl 7110 8500 HBr <10 <10 HF <5 <5 HCN <2 <2 NOX <20 <20 SO2 <10 <10 CIT at 8 min 11.1 12.7
- 62. 62 Y2 – Fibre glass plate Light Transmission – Non-flaming exposure (Irradiance 25 kW/m2) 100 Test 1 Test 2 Light Transmission (%) 80 60 40 20 0 0 4 8 12 16 20 Time (min) Light Transmission – Non-flaming exposure (Irradiance 50 kW/m2) 100 Test 3 Test 4 Light Transmission (%) 80 60 40 20 0 0 4 8 12 Time (min) 16 20
- 63. 63 Smoke results The explanation of the parameters is shown in 8.3.1 below. Mode Test no Ds,max Dc Duration of test, s Irradiance 25kW/m², Non-flaming exposure 1 2 965 1000 102 133 1200 1200 Mode Test no Ds,max Ds(4) VOF4 Dc Duration of test, s Irradiance 50kW/m², Non-flaming exposure 3 4 1320 1320 1016 1103 2261 2038 334 263 700 600 Mean 983(Dm) Mean 1320 (Dm) 1060 2150 Note None of the specimens tested in mode 1 (Irradiance 25 kW/m2, Non-flaming exposure) ignited. All of the specimens tested in mode 3 (Irradiance 50 kW/m2, Non-flaming exposure) ignited. Gas analysis The following gas concentrations were measured in the test chamber. The gas samples were taken from the geometrical centre of the test chamber. The concentrations of the different gas species were measured with FTIR gas analysis. The gas concentrations are evaluated after 8 minutes test time and reported as the Conventional Index of Toxicity, CIT, according to CEN TS 45545-2. Gas species Measured concentration during non-flaming exposure (Irradiance of 50 kW/m2). [ppm] CO 1220 HCl 40 HBr <10 HF <5 HCN <2 NOX <20 SO2 <10 CIT at 8 min 0.31
- 64. 64 Y3 – ABS wall panel Light Transmission – Non-flaming exposure (Irradiance 25 kW/m2) Test 1 100 Test 1 Light Transmission (%) 80 60 40 20 0 0 4 8 12 16 20 Time (min) Light Transmission – Non-flaming exposure (Irradiance 50 kW/m2) 100 Test 2 Test 3 Light Transmission (%) 80 60 40 20 0 0 2 4 6 Time (min) 8 10
- 65. 65 Smoke results The explanation of the parameters is shown in 8.3.1 below. Mode Test no Ds,max Dc Duration of test, s Irradiance 25kW/m², Non-flaming exposure 1 663 94 1200 Mode Test no Ds,max Ds(4) VOF4 Dc Duration of test, s Irradiance 50kW/m², Non-flaming exposure 2 3 1320 1320 1320 1049 2942 3036 384 367 600 650 Mean 663(Dm) Mean 1320 (Dm) 1184 2989 Note The specimen tested in mode 1 (Irradiance 25 kW/m2, Non-flaming exposure) did not ignited. All of the specimens tested in mode 3 (Irradiance 50 kW/m2, Non-flaming exposure) ignited. Gas analysis The following gas concentrations were measured in the test chamber. The gas samples were taken from the geometrical centre of the test chamber. The concentrations of the different gas species were measured with FTIR gas analysis. The gas concentrations are evaluated after 8 minutes test time and reported as the Conventional Index of Toxicity, CIT, according to CEN TS 45545-2. Gas species Measured concentration during non-flaming exposure (Irradiance of 25 kW/m2). [ppm] Measured concentration during non-flaming exposure (Irradiance of 50 kW/m2). [ppm] CO 415 1860 HCl <5 <5 HBr <10 <10 HF <5 <5 HCN 16 100 NOX 24 430 SO2 <10 <10 CIT at 8 min 0.9 2.4
- 66. 66 Y4 – Laminate wall panel Light Transmission – Non-flaming exposure (Irradiance 25 kW/m2) Test 1 100 Test 1 Light Transmission (%) 80 60 40 20 0 0 4 8 12 16 20 Time (min) Light Transmission – Non-flaming exposure (Irradiance 50 kW/m2) 100 Test 2 Test 3 Light Transmission (%) 80 60 40 20 0 0 2 4 6 Time (min) 8 10
- 67. 67 Smoke results The explanation of the parameters is shown in 8.3.1 below. Mode Test no Ds,max Dc Duration of test, s Irradiance 25kW/m², Non-flaming exposure 1 233 40 1200 Mode Test no Ds,max Ds(4) VOF4 Dc Duration of test, s Irradiance 50kW/m², Non-flaming exposure 2 3 197 181 192 175 451 395 28 25 610 600 Mean 233 (Dm) Mean 189 (Dm) 184 423 Note The specimen tested in mode 1 (Irradiance 25 kW/m2, Non-flaming exposure) did not ignited. All of the specimens tested in mode 3 (Irradiance 50 kW/m2, Non-flaming exposure) ignited. Gas analysis The following gas concentrations were measured in the test chamber. The gas samples were taken from the geometrical centre of the test chamber. The concentrations of the different gas species were measured with FTIR gas analysis. The gas concentrations are evaluated after 8 minutes test time and reported as the Conventional Index of Toxicity, CIT, according to CEN TS 45545-2. Gas species Measured concentration during non-flaming exposure (Irradiance of 25 kW/m2). [ppm] Measured concentration during non-flaming exposure (Irradiance of 50 kW/m2). [ppm] CO 1530 230 HCl <5 <5 HBr <10 <10 HF <5 <5 HCN 63 21 NOX 18 84 SO2 <10 <10 CIT at 8 min 0.1 0.44
- 68. 68 Y5/Y6 - EPS + rubber wall insulation Light Transmission – Non-flaming exposure (Irradiance 25 kW/m2) Test 1 100 Test 1 Light Transmission (%) 80 60 40 20 0 0 4 8 12 16 20 Time (min) Light Transmission – Non-flaming exposure (Irradiance 50 kW/m2) 100 Test 2 Test 3 Light Transmission (%) 80 60 40 20 0 0 2 4 6 Time (min) 8 10
- 69. 69 Smoke results The explanation of the parameters is shown in 8.3.1 below. Mode Test no Ds,max Dc Duration of test, s Irradiance 25kW/m², Non-flaming exposure 1 239 Mode Test no Ds,max Ds(4) VOF4 Dc Duration of test, s Irradiance 50kW/m², Non-flaming exposure 2 3 349 405 297 324 1106 1199 44 48 600 600 Mean 239 (Dm) Mean 377 (Dm) 311 1153 Note The specimen tested in mode 1 (Irradiance 25 kW/m2, Non-flaming exposure) did not ignited. All of the specimens tested in mode 3 (Irradiance 50 kW/m2, Non-flaming exposure) ignited. Gas analysis The following gas concentrations were measured in the test chamber. The gas samples were taken from the geometrical centre of the test chamber. The concentrations of the different gas species were measured with FTIR gas analysis. The gas concentrations are evaluated after 8 minutes test time and reported as the Conventional Index of Toxicity, CIT, according to CEN TS 45545-2. Gas species Measured concentration during non-flaming exposure (Irradiance of 25 kW/m2). [ppm] Measured concentration during non-flaming exposure (Irradiance of 50 kW/m2). [ppm] CO 90 220 HCl <5 <5 HBr <10 <10 HF <5 <5 HCN <2 <2 NOX <20 <20 SO2 <10 <10 CIT at 8 min 0.19 1.67
- 70. 70 Y7 - Sunscreen curtain Light Transmission – Non-flaming exposure (Irradiance 25 kW/m2) 100 Test 1 Test 2 Light Transmission (%) 80 60 40 20 0 0 4 8 12 16 Time (min) Smoke results The explanation of the parameters is shown in 8.3.1 below. Mode Test no Ds,max Dc Duration of test, s Irradiance 25kW/m², Non-flaming exposure 1 2 143 134 1200 Mean 139(Dm) 600 Note None of the specimens tested in mode 1 (Irradiance 25 kW/m2, Non-flaming exposure) ignited. 20
- 71. 71 Gas analysis The following gas concentrations were measured in the test chamber. The gas samples were taken from the geometrical centre of the test chamber. The concentrations of the different gas species were measured with FTIR gas analysis. The gas concentrations are evaluated after 8 minutes test time and reported as the Conventional Index of Toxicity, CIT, according to CEN TS 45545-2. Gas species Measured concentration during non-flaming exposure (Irradiance of 25 kW/m2). [ppm] CO 85 HCl 110 HBr <10 HF <5 HCN <2 NOX <20 SO2 <10 CIT at 8 min 0.3
- 72. 72 Y8 - Window curtain Light Transmission – Non-flaming exposure (Irradiance 25 kW/m2) 100 Test 1 Test 2 Light Transmission (%) 80 60 40 20 0 0 4 8 12 16 Time (min) Smoke results The explanation of the parameters is shown in 8.3.1 below. Mode Test no Ds,max Dc Duration of test, s Irradiance 25kW/m², Non-flaming exposure 1 2 135 116 6 8 1200 1200 Mean 126(Dm) Note None of the specimens tested in mode 1 (Irradiance 25 kW/m2, Non-flaming exposure) ignited. 20
- 73. 73 Gas analysis The following gas concentrations were measured in the test chamber. The gas samples were taken from the geometrical centre of the test chamber. The concentrations of the different gas species were measured with FTIR gas analysis. The gas concentrations are evaluated after 8 minutes test time and reported as the Conventional Index of Toxicity, CIT, according to CEN TS 45545-2. Gas species Measured concentration during non-flaming exposure (Irradiance of 25 kW/m2). [ppm] CO 300 HCl <5 HBr <10 HF <5 HCN <2 NOX <20 SO2 <20 CIT at 8 min 0.3
- 74. 74 Y9 - Needle felt 1 Light Transmission – Non-flaming exposure (Irradiance 50 kW/m2) 100 Test 1 Test 2 Light Transmission (%) 80 60 40 20 0 0 4 8 12 16 Time (min) Smoke results The explanation of the parameters is shown in 8.3.1 below. Mode Test no Ds,max Ds(4) VOF4 Dc Duration of test, s Irradiance 50kW/m², Non-flaming exposure 1 2 164 96 88 93 213 268 13 12 1200 600 Mean 130 (Dm) 91 241 Note All of the specimens tested in mode 3 (Irradiance 50 kW/m2, Non-flaming exposure) ignited. 20
- 75. 75 Gas analysis The following gas concentrations were measured in the test chamber. The gas samples were taken from the geometrical centre of the test chamber. The concentrations of the different gas species were measured with FTIR gas analysis. The gas concentrations are evaluated after 8 minutes test time and reported as the Conventional Index of Toxicity, CIT, according to CEN TS 45545-2. Gas species Measured concentration during non-flaming exposure (Irradiance of 50 kW/m2). [ppm] CO 310 HCl <5 HBr <10 HF <5 HCN <2 NOX <20 SO2 <10 CIT at 8 min 1.7
- 76. 76 Y10/Y11 - Needle felt 2 + laminate Light Transmission – Non-flaming exposure (Irradiance 50 kW/m2) 100 Test 1 Test 2 Light Transmission (%) 80 60 40 20 0 0 2 4 6 8 Time (min) Smoke results The explanation of the parameters is shown in 8.3.1 below. Mode Test no Ds,max Ds(4) VOF4 Dc Duration of test, s Irradiance 50kW/m², Non-flaming exposure 1 2 246 249 230 238 741 736 47 49 600 600 Mean 248 (Dm) 234 739 Note All of the specimens tested in mode 3 (Irradiance 50 kW/m2, Non-flaming exposure) ignited. 10
- 77. 77 Gas analysis The following gas concentrations were measured in the test chamber. The gas samples were taken from the geometrical centre of the test chamber. The concentrations of the different gas species were measured with FTIR gas analysis. The gas concentrations are evaluated after 8 minutes test time and reported as the Conventional Index of Toxicity, CIT, according to CEN TS 45545-2. Gas species Measured concentration during non-flaming exposure (Irradiance of 50 kW/m2). [ppm] CO 250 HCl <5 HBr <10 HF <5 HCN <2 NOX 78 SO2 28 CIT at 8 min 4.8
- 78. 78 G1 - Flooring system 1 Light Transmission – Non-flaming exposure (Irradiance 25 kW/m2) 100 Test 1 Test 2 Light Transmission (%) 80 60 40 20 0 0 4 8 12 16 Time (min) Smoke results The explanation of the parameters is shown in 8.3.1 below. Mode Test no Ds,max Dc Duration of test, s Irradiance 25kW/m², Non-flaming exposure 1 2 739 761 7 41 1200 1200 Mean 750(Dm) Note None of the specimens tested in mode 1 (Irradiance 25 kW/m2, Non-flaming exposure) ignited. 20
- 79. 79 Gas analysis The following gas concentrations were measured in the test chamber. The gas samples were taken from the geometrical centre of the test chamber. The concentrations of the different gas species were measured with FTIR gas analysis. The gas concentrations are evaluated after 8 minutes test time and reported as the Conventional Index of Toxicity, CIT, according to CEN TS 45545-2. Gas species Measured concentration during non-flaming exposure (Irradiance of 25 kW/m2). [ppm] CO 800 HCl 2930 HBr <10 HF <5 HCN <2 NOX <20 SO2 <10 CIT at 8 min 8.5
- 80. 80 G2 - Flooring system 2 Light Transmission – Non-flaming exposure (Irradiance 25 kW/m2) 100 Test 1 Test 2 Light Transmission (%) 80 60 40 20 0 0 4 8 12 16 Time (min) Smoke results The explanation of the parameters is shown in 8.3.1 below. Mode Test no Ds,max Dc Duration of test, s Irradiance 25kW/m², Non-flaming exposure 1 2 841 845 67 106 1200 1200 Mean 843(Dm) Note None of the specimens tested in mode 1 (Irradiance 25 kW/m2, Non-flaming exposure) ignited. 20
- 81. 81 Gas analysis The following gas concentrations were measured in the test chamber. The gas samples were taken from the geometrical centre of the test chamber. The concentrations of the different gas species were measured with FTIR gas analysis. The gas concentrations are evaluated after 8 minutes test time and reported as the Conventional Index of Toxicity, CIT, according to CEN TS 45545-2. Gas species Measured concentration during non-flaming exposure (Irradiance of 25 kW/m2). [ppm] CO 1100 HCl 2990 HBr <10 HF <5 HCN <2 NOX <20 SO2 <10 CIT at 8 min 10.7
- 82. 82 S1 - Seat 1 Light Transmission – Non-flaming exposure (Irradiance 50 kW/m2) Test 1 100 Test 1 Light Transmission (%) 80 60 40 20 0 0 2 4 6 8 Time (min) Smoke results The explanation of the parameters is shown in 8.3.1 below. Mode Test no Ds,max Ds(4) VOF4 Dc Duration of test, s Irradiance 50kW/m², Non-flaming exposure 1 252 130 437 60 600 Note The specimen tested in mode 3 (Irradiance 50 kW/m2, Non-flaming exposure) ignited. 10
- 83. 83 Gas analysis The following gas concentrations were measured in the test chamber. The gas samples were taken from the geometrical centre of the test chamber. The concentrations of the different gas species were measured with FTIR gas analysis. The gas concentrations are evaluated after 8 minutes test time and reported as the Conventional Index of Toxicity, CIT, according to CEN TS 45545-2. Gas species Measured concentration during non-flaming exposure (Irradiance of 50 kW/m2). [ppm] CO 320 HCl <5 HBr <10 HF <5 HCN 15 NOX 168 SO2 60 CIT at 8 min 9.8
- 84. 84 S2 - Seat 2 Light Transmission – Non-flaming exposure (Irradiance 50 kW/m2) Test 1 100 Test 1 Light Transmission (%) 80 60 40 20 0 0 2 4 6 8 Time (min) Smoke results The explanation of the parameters is shown in 8.3.1 below. Mode Test no Ds,max Ds(4) VOF4 Dc Duration of test, s Irradiance 50kW/m², Non-flaming exposure 1 467 400 1001 89 600 Note The specimen tested in mode 3 (Irradiance 50 kW/m2, Non-flaming exposure) ignited. 10
- 85. 85 Gas analysis The following gas concentrations were measured in the test chamber. The gas samples were taken from the geometrical centre of the test chamber. The concentrations of the different gas species were measured with FTIR gas analysis. The gas concentrations are evaluated after 8 minutes test time and reported as the Conventional Index of Toxicity, CIT, according to CEN TS 45545-2. Gas species Measured concentration during non-flaming exposure (Irradiance of 50 kW/m2). [ppm] CO 590 HCl <5 HBr <10 HF <5 HCN 31 NOX 161 SO2 18 CIT at 8 min 10.8
- 86. 86 S3 - Seat 3 Light Transmission – Non-flaming exposure (Irradiance 50 kW/m2) Test 1 100 Test 1 Light Transmission (%) 80 60 40 20 0 0 2 4 6 8 Time (min) Smoke results The explanation of the parameters is shown in 8.3.1 below. Mode Test no Ds,max Ds(4) VOF4 Dc Duration of test, s Irradiance 50kW/m², Non-flaming exposure 1 491 475 1376 78 600 Note The specimen tested in mode 3 (Irradiance 50 kW/m2, Non-flaming exposure) ignited. 10
- 87. 87 Gas analysis The following gas concentrations were measured in the test chamber. The gas samples were taken from the geometrical centre of the test chamber. The concentrations of the different gas species were measured with FTIR gas analysis. The gas concentrations are evaluated after 8 minutes test time and reported as the Conventional Index of Toxicity, CIT, according to CEN TS 45545-2. Gas species Measured concentration during non-flaming exposure (Irradiance of 50 kW/m2). [ppm] CO 650 HCl <5 HBr <10 HF <5 HCN 35 NOX 93 SO2 21 CIT at 8 min 10.7
- 88. 88 8.3.1 DS ISO 5659 Parameter explanation Specific optical density, calculated as follows: DS = 132 log 100 where T = percent light transmittance. T DS,max Maximum specific optical density. D,m The average of the maximum specific optical density. Ds(4) Specific optical density at 4 minutes. VOF4 Specific optical density at 10 minutes. Dc Specific optical density correction factor for the smoke absorbed on the glass windows of the optical system. CIT Conventional Index of Toxicity, calculated according to prCEN TS 45545-2.
- 89. 89 8.4 ISO 5658 Y1 - PVC band/strip Application No other backing than the non-combustible required in the standard. In test no 2 and 3 the specimen was fastened with steel wire each 20 cm approximately. Test procedure The pilot flame was placed parallel to the specimen. Observations made during fire test Test no The flame front reached, mm 50 100 150 200 250 300 350 400 Flames at flame front went out Burning droplets Time, min:s 1* Heat for Time, sustained min:s burning, MJ/m² 0:48 0:48 2.4 2.3 2 Heat for Time, sustained min:s burning, MJ/m² 3 Heat for sustained burning, MJ/m² 1:20 at 110 mm* 0:53 2.7 2:13 6.5 2:13 6 2:13 5.5 2:13 4.8 3:25 6.1 4:55 7.1 8:38 9.6 11:40 at 430 mm 3:22 10.2 3:22 9.8 3:22 9.1 3:22 8.3 3:34 7.7 3:52 6.9 4:27 6.4 9:14 10.2 10:53 at 410 mm none none none *The specimen fell out from the specimen holder after 1:20 min:s and the flames died out.
- 90. 90 Derived fire characteristics Om max flamfront ej överstiger 180 mm skall inte Qsb presenteras. 1 2 3 Test no Average Heat for ignition, MJ/m2 -* 6 9.1 7.6 Average heat for sustained -* 6.5 7.7 7.1 burning, Qsb, MJ/m2 Critical flux at -* 15.6 17.5 16.6 extinguishement, CFE, kW/m2 Total heat release, Qt, MJ -* 0.5 0.5 0.5 Peak heat release rate, Qp, -* 1.3 1.3 1.3 kW *The specimen fell out from the specimen holder after 1:20 min:s and the flames died out. Heat release rates, graphs Test 2 BRm6083a 8 Output signal mV,kW 6 4 T comp (mV) HRR (kW) 2 0 -2 -290 -50 190 430 670 Time (s) Figure 2 Heat release rate for test no 2. Total heat release: 0.5 MJ. Peak heat release rate: 1.3 kW.
- 91. 91 Test 3 BRm6083a 8 Output signal mV,kW 6 4 T comp (mV) HRR (kW) 2 0 -2 -260 -20 220 460 700 Time (s) Figure 3 Heat release rate for test no 3. Total heat release: 0.5 MJ. Peak heat release rate: 1.3 kW.
- 92. 92 Y2 - Fibre glass plate Application No other backing than the non-combustible required in the standard. Test procedure The pilot flame was placed parallel to the specimen. Observations made during fire test Test no The flame front reached, mm 50 100 150 200 250 300 350 400 450 500 550 600 Flames at flame front went out Burning droplets Time, min:s 1 Heat for Time, sustained min:s burning, MJ/m² 2 Heat for Time, sustained min:s burning, MJ/m² 3 Heat for sustained burning, MJ/m² 0:34 1.7 0:34 1.7 0:34 1.5 0:39 1.6 0:46 1.6 1:00 1.8 1:36 2.3 3:00 3.3 3:46 3.1 5:37 3.1 9:40 3.4 14:24 3.6 21:16 at 610 mm 0:42 2.1 0:42 2 0:42 1.9 0:42 1.7 0:50 1.8 0:59 1.8 1:36 2.3 2:15 2.5 3:43 3 5:42 3.2 10:06 3.6 14:10 3.5 20:22 at 620 mm 0:32 1.6 0:32 1.6 0:32 1.4 0:32 1.3 0:42 1.5 0:53 1.6 1:16 1.8 1:46 2 3:20 2.7 5:55 3.3 9:33 3.4 17:15 4.3 21:55 at 620 mm none none none
- 93. 93 Derived fire characteristics 1 2 3 Test no Average Heat for ignition, MJ/m2 Average heat for sustained burning, Qsb, MJ/m2 Critical flux at extinguishement, CFE, kW/m2 Total heat release, Qt, MJ Peak heat release rate, Qp, kW 1.5 2.0 1.9 2.0 1.4 1.6 1.6 1.9 3.9 3.7 3.7 3.8 4.8 7.5 4.9 7.0 4.4 6.3 4.7 6.9 Heat release rates, graphs Test 1 BRm6083b 8 Output signal mV,kW 6 4 T comp (mV) HRR (kW) 2 0 -2 -380 -10 360 730 1100 Time (s) Figure 1 Heat release rate for test no 1. Total heat release: 4.8 MJ. Peak heat release rate: 7.5 kW.
- 94. 94 Test 2 BRm6083b 8 Output signal mV,kW 6 4 T comp (mV) HRR (kW) 2 0 -2 -200 120 440 760 1080 1400 Time (s) Figure 2 Heat release rate for test no 2. Total heat release: 4.9 MJ. Peak heat release rate: 7.0 kW. Test 3 BRm6083b 8 Output signal mV,kW 6 4 T comp (mV) HRR (kW) 2 0 -2 -200 140 480 820 1160 Time (s) Figure 3 Heat release rate for test no 3. Total heat release: 4.4 MJ. Peak heat release rate: 6.3 kW.
- 95. 95 Y3 - ABS wall panel Application No other backing than the non-combustible required in the standard. Test procedure The pilot flame was placed parallel to the specimen. Observations made during fire test Test no The flame front reached, mm 50 100 150 200 250 300 350 400 450 500 550 600 650 700 750 Flames at flame front went out Burning droplets Time, min:s 1 Heat for Time, sustained min:s burning, MJ/m² 2 Heat for Time, sustained min:s burning, MJ/m² 3 Heat for sustained burning, MJ/m² 0:32 1.6 0:32 1.6 0:32 1.4 0:32 1.3 0:41 1.5 0:50 1.5 1:07 1.6 1:37 1.8 2:03 1.7 3:33 2 6:54 2.5 11:02 2.7 15:31 2.8 20:08 2.8 25:44 2.7 27:14 at 770 mm 0:35 1.8 0:35 1.7 0:35 1.6 0:38 1.6 0:43 1.5 0:57 1.7 1:07 1.6 1:33 1.7 2:29 2 4:10 2.3 7:47 2.8 13:52 3.4 17:06 3.1 21:13 2.9 26:27 2.8 27:35 at 770 mm 0:37 1.9 0:37 1.8 0:37 1.7 0:42 1.7 0:44 1.6 0:54 1.6 1:09 1.7 1:32 1.7 2:16 1.9 3:33 2 7:06 2.5 11:20 2.8 15:21 2.8 19:52 2.7 25:31 2.7 26:54 at 770 mm none none none
- 96. 96 Derived fire characteristics 1 2 3 Test no Average Heat for ignition, MJ/m2 Average heat for sustained burning, Qsb, MJ/m2 Critical flux at extinguishement, CFE, kW/m2 Total heat release, Qt, MJ Peak heat release rate, Qp, kW 1.4 1.5 1.6 1.6 1.7 1.7 1.6 1.6 1.8 1.8 1.8 1.8 4.5 17.5 4.6 18.5 5 26.1 4.7 20.7 Heat release rates, graphs Test 1 BRm6083c 18 16 Output signal mV,kW 14 12 10 T comp (mV) 8 HRR (kW) 6 4 2 0 -2 -200 210 620 1030 1440 Time (s) Figure 1 Heat release rate for test no 1. Total heat release: 4.5 MJ. Peak heat release rate: 17.5 kW.