SlideShare a Scribd company logo
SPECIAL REPORT
Packaged LED and SSL
projections are powered by
technology shifts and trends
Each year at Strategies in Light, analysts from our
colleagues at Strategies Unlimited present the
latest LED and solid-state lighting (SSL) market
forecast to an audience of LED and lighting
professionals who all want to know, “What has
happened in the market during the past year,
and where do my business opportunities lie?”
This pre-eminent presentation is reported on
annually by LEDs Magazine chief editor Maury
Wright, who focuses on the data-driven details
that help decision makers move forward and
make big plays in the industry. This special report
combines the past three years of Strategies
Unlimited forecasts, noting the technology shifts
that sparked trends as well as growth and dip
patterns, and delivers a comparison of regional
markets as well as LED and SSL segments.
REPRINTED WITH REVISIONS TO FORMAT FROM LEDS MAGAZINE. COPYRIGHT 2015 BY PENNWELL CORPORATION.
TECHNOLOGY AND
APPLICATIONS OF
LIGHT EMITTING
DIODES
Packaged LED market
resumes moderate
growth while the SSL
market will enjoy 12%
CAGR through 2017
PAGE 28
Research projects
five years of growth
for packaged
LEDs and SSL
PAGE 16
Strategies Unlimited
tempers LED and
SSL projections
but remains bullish
on sectors
PAGE 2
2 LEDS Magazine SPECIAL REPORT
ORIGINALLY PUBLISHED APRIL 23, 2015
Strategies Unlimited tempers
LED and SSL projections but
remains bullish on sectors
Analysts led off the Plenary Session on each day of Strategies in Light,
reports MAURY WRIGHT, with growth projections for both packaged LEDs
and lighting products slightly lowered relative to the 2014 presentations.
THE STRATEGIES IN Light (SIL) 2015 conference, held Feb. 24-26 in Las Vegas,
NV, featured Plenary Sessions anchored by Strategies Unlimited market-research
presentations on each of the two main-conference days. Senior analyst Stephanie
Pruitt reported that packaged LED revenue hit $15.4B (billion) in 2014 and
projected growth to $22.1B in 2019. Philip Smallwood, co-chair of SIL and director
of research at Strategies Unlimited, reported that LEDs penetrated 5% of the lamps
market in 2014 and projected 52% penetration by 2022 based on units shipped.
Smallwood reported LED penetration in luminaires at 33% in 2014 and projected
69% penetration by 2022.
Generally, the market projections were positive, but growth rates in terms of revenue
were slightly down from the 2014 data. We will discuss the new data in detail
including reasons for changes that range from packaged LED prices dropping faster
than expected to new methods of modeling the lighting market that have been
instigated by Smallwood in the research program.
Packaged LEDs
The packaged LED presentation is directly comparable to the data presented last
year as the methodology remained consistent in the component area. Still, there is
one caveat. Pruitt presented preliminary data. The actual data will not be finalized
Strategies Unlimited tempers LED and SSL projections but remains bullish on sectors
3 LEDs Magazine SPECIAL REPORT
until April when the report is due for sale (after this article was written). So beware
of some changes, although we’d expect them to be minor.
Pruitt took the stage on day two of SIL (Fig. 1) and compared data in the most
recent years. In 2014, Strategies Unlimited projected a 13% compound annual
growth rate (CAGR) for LED revenue through 2018. Pruitt said the new data
suggests an 8% CAGR through
2019. The lower growth, however,
is not in any way indicative of the
research team expecting fewer LEDs
to be sold. But LED component
prices are eroding faster than
expected. Moreover, parts of the
LED forecast are driven by research
on the lighting market, and Pruitt
said the new forecast is “more
conservative than last year due to
lighting research”–in part the new
models mentioned earlier.
Indeed, we can already see slower growth in revenue numbers reported for 2014.
Pruitt said LED revenue grew from $14.5B in 2013 to $15.4B in 2014. That’s far
lower than the 13% projection from last year. In fact, the 6% growth from 2013 even
lags behind the new projection going out to 2019.
But before we delve into more details, let’s discuss the methodology of the packaged
LED research. As with previous years, the scope includes all packaged LEDs but
not bare LED die or chips. It certainly does include package-light LEDs such as
products based on chip-scale packages (CSPs). We covered the CSP trend in our
report from the Light+Building event in Frankfurt last year, and there is much more
in our conference keynote coverage in this issue.
FIG. 1. Senior Strategies Unlimited analyst Stephanie
Pruitt presented the research firm’s latest data on the
packaged LED market.
Strategies Unlimited tempers LED and SSL projections but remains bullish on sectors
4 LEDs Magazine SPECIAL REPORT
The research is focused on revenue and not number of LEDs shipped or sold. The
report covers products ranging from very-low-cost, low- and mid-power LEDs to the
high-power LEDs that have been most prominently used in lighting until recently
when mid-power LEDs entered that space. The scope also includes super-high-
power LEDs, primarily chip-on-board (COB) products. Strategies Unlimited now
also publishes dedicated COB LED research.
The segmentation of the packaged LED market also remains largely consistent with
prior years. The 0.5W dividing line between the mid- and high-power segments
remains. But that line may create ambiguity in some of the data where applications
are dissected relative to the types of LEDs used. Many LEDs that look like
traditional mid-power devices in plastic packages with no secondary optics can be
driven at levels of 1W and higher today.
Application segments
The projected 8% CAGR through 2019 will lead to a packaged LED segment
that totals $22.1B. Let’s look at the applications that will drive such growth and
the near- and long-term prospects and trends for each. The primary application
segments include:
• Displays/backlights
• Mobile
• Signs
• Automotive
• Lighting
Fig. 2 depicts the segments and the recent growth or decline in each segment from
2013 to 2014. As you might expect, lighting will remain the largest growth segment
for the foreseeable future. Two years ago, Strategies Unlimited reported that general
lighting had become the largest consumer of LEDs by revenue. Previously, the display-
backlight sector had consumed more LEDs by revenue. Still, all of the applications
listed above consume copious amounts of packaged LEDs.
Strategies Unlimited tempers LED and SSL projections but remains bullish on sectors
5 LEDs Magazine SPECIAL REPORT
Display backlights
Indeed, the display-backlight
market for TVs and computer
monitors remains robust and
likely consumes more individual
LED components that any other
application. But the LEDs utilized
are generally low- or mid-power
LEDs and are among the most-
commoditized products in the
packaged LED space.
In terms of revenue, the display
sector is already in decline from
$2.6B in 2014, as detailed in
Fig. 3, with a -5% CAGR projected
through 2019. The display sector
will not suffer from the same
type of saturation as the lighting
sector that we will discuss later.
Now the backlight segment is
fully saturated, but consumers
continue to buy new and better
TVs or monitors. Still, LEDs used
in displays will continue to fall
in price. At the same time LEDs
get brighter, resulting in fewer
LEDs being required per display
in some cases.
Packaged LED revenues ($B)
LED industry grew 6% from 2013 to 2014
0 1 2 3 4 5 6
Lighting
Automotive
lighting
Signage
Mobile
devices
Backlight
in displays
& monitors
Others
2014
2013
$14.6B
2014
$15.4B
2013
15%
10%
10%
-8.7%
-0.4%
8%
0.0
0.5
1.0
1.5
2.0
2.5
3.0
Video walls
Monitors
TVs
2019201820172016201520142013
LED revenues for TVs/monitors/displays
($B)
Others
Mobile phones
Mobile computing
devices
2019201820172016201520142013
0.0
0.5
1.0
1.5
2.0
2.5
3.0
3.5
Revenues for LEDs in mobile devices
($B)
FIG. 4. LED revenue related to mobile devices is declining
with falling LED prices.
FIG. 3. The display-backlight market for LEDs is in decline
but is still significant.
FIG. 2. The packaged LED market grew by $800M from
2013 to 2014 with lighting applications leading the charge.
Strategies Unlimited tempers LED and SSL projections but remains bullish on sectors
6 LEDs Magazine SPECIAL REPORT
Pruitt noted, however, that technology innovation in the TV space could
significantly impact the projection. Specifically, a larger-than-expected transition
to 4k-pixel TVs, sometimes called ultrahigh-definition TVs (UHDTV), could
result in more LEDs being sold into the application. Such higher-end TVs would
almost assuredly rely on local-dimming implementations where individual
LEDs light a smaller area of the overall screen to provide optimum contrast ratio.
Conversely, were an OLED manufacturer to solve the manufacturing issues with
large screens, allowing that technology to drop in price, fewer LEDs might be sold
into backlighting.
Mobile devices
Moving to LED revenue in mobile devices, we find yet another application in
decline. Fig. 4 depicts the details of the -5% CAGR projected by Pruitt through 2019.
Still, the raw numbers are impressive. Mobile devices consumed $2.8B worth of
LEDs in 2014 and the projection calls for around $2.1B in 2019.
The reasons for the decline in mobile are in part similar to the decline in displays,
but OLED technology plays a larger role. The mobile market is nearly saturated, but
the upgrade cycle continues to drive the sale of new devices. However, price erosion
is heavy in the LEDs used in mobile devices for backlighting or lighting the keypad.
Moreover, OLED technology is already being used broadly by vendors such as
Samsung in smartphones. LED revenue specifically for the phone market will go
from $1.3B in 2014 to less than $1B in 2019. Declines in tablets and other mobile
computing devices will be shallower.
Last year, we reported that expanded camera functionality in mobile devices was
driving the need for more and higher-quality LEDs for both forward- and rear-
facing camera-flash functionality. Indeed, we covered that technology trend in our
report on the conference sessions at SIL 2014. Pruitt did not address the flash sub-
Strategies Unlimited tempers LED and SSL projections but remains bullish on sectors
7 LEDs Magazine SPECIAL REPORT
segment in her SIL presentation,
but that data will likely be
included in the final LED market
report due in April.
Pruitt also suggested that as with
the display market, a transition
to higher-resolution screens in
mobile devices could positively
impact the revenue for LEDs in
the mobile segment. There will
be some level of penetration of
UHDTV technology even in
the smaller devices as screen
technology continues to improve.
Automotive and signage
Moving to areas of growth,
automotive is probably the
packaged-LED application with
the greatest growth potential
outside of general lighting. As Fig.
2 indicates, the sector experienced
10% growth between 2013 and
2014. Moreover, Pruitt projects
10% CAGR through 2019 as
depicted in Fig. 5, with revenue
going from $1.8B in 2014 to
$2.9B in 2019.
0.0
0.5
1.0
1.5
2.0
2.5
3.0
Exterior
lighting
Interior
lighting
2019201820172016201520142013
Revenues for LEDs in automotive lighting
($B)
15% CAGR
Others
24%
Others
37% Front turn
4%
Front turn
5%
Stop/tail
13%
Stop/tail
10%
Headlamps
42%
Headlamps
22%
DRL
17%
DRL
26%
Automotive exterior revenues
20192014
2014 Revenues for
LEDs in lighting
$5.3B
Other
Residential
Outdoor
Industrial
Commercial
Replacement
lamps
FIG. 7. Lighting, and specifically general illumination, holds the
greatest revenue potential for packaged LEDs. In 2014, general
illumination accounted for 75% of the lighting market.
FIG. 6. Exterior applications, especially in headlamps, will
drive the growth of LED revenue in automotive.
FIG. 5. The interior sub-segment of LED usage in
automotive is saturated, but great growth potential awaits
on the exterior.
Strategies Unlimited tempers LED and SSL projections but remains bullish on sectors
8 LEDs Magazine SPECIAL REPORT
The automotive application includes both exterior and interior lighting. The
dashboard sub-segment of interior automotive lighting is fully saturated. We will
see more in-cabin use of LEDs for ambience including color-tunable lighting
products. We covered an Osram Opto Semiconductors product designed for just
such applications more than a year ago. But the LEDs used in automotive interiors
will mostly be commodity products and falling component prices will keep interior
revenue relatively flat.
The exterior automotive application, however, still has a lot of room to grow with
penetration remaining relatively low in headlamps. Moreover, the value proposition
is twofold. Automakers will adopt LEDs for headlamps in mainstream cars to
leverage the low power and long life inherent in LEDs. High-end vehicles will carry
LED headlamps with functionality such as steered beams that can’t be realized with
legacy sources.
Fig. 6 shows that LED revenue is projected to grow by 15% through 2019 in the
exterior sub-segment with LED revenue in just that sub-segment exceeding $2B
by 2019. The biggest growth will come in headlamps with that specific application
consuming nearly $1B by 2019. Stop- and tail-light revenue will be the other high-
growth area as automobile manufacturers add functionality in that application.
Signage is yet another LED application that is projected to grow. Pruitt reported that
LED revenue in the application totaled $1.7B in 2014. Projection of an 11% CAGR
will take the market to $2.9B in 2019.
General illumination
Lighting–specifically general illumination–however, will provide the real lift in LED
revenue for the next five years. LED revenue in the lighting application totaled $5.3B
in 2014 with 75% of that total dedicated to general illumination (Fig. 7). Retrofit
lamps account for nearly half of the 2014 LED revenue in lighting. Pruitt projects a
14% CAGR through 2019, consuming more than $10B in LEDs for lighting.
Strategies Unlimited tempers LED and SSL projections but remains bullish on sectors
9 LEDs Magazine SPECIAL REPORT
Fig. 8 provides more details
on the projection with general
illumination accounting for 86%
of the LED revenue by 2019. At
the end of the projection, LED
revenue for replacement lamps
will grow to $6.6B with that
application remaining well over
half of the lighting consumption
base. The other or non-general-
illumination segment is the next
largest in aggregate at $1.5B in
2019. That category, however,
comprises a wide variety of
small sub-segments including
entertainment, architectural,
retail display, consumer portable,
safety and security, off-grid, and
strip and string lighting. Outdoor
is the second largest general-
illumination sub-segment today
and in 2019 growing to consume
$815M (million) in LEDs.
LED types in lighting
Pruitt dug deeper into the LED
market data relative to lighting
applications. For example, Fig.
9 breaks down the total lighting
application by types of LEDs used FIG. 10. All classes of power LEDs will see growth in
replacement lamps.
FIG. 9. The high-power LED segment will decline as a
percentage of the total revenues of all LED classes.
FIG. 8. The Strategies Unlimited forecast states that 86%
of the lighting market will be general illumination in
2019, and replacement lamps are expected to be the top
consumer of LEDs by a wide margin.
Revenues for LEDs in lighting
($B)
0
2
4
6
8
10
12
Replacement lamps
Commercial
Industrial
Outdoor
Residential
Other
’19’18’17’16’15’14’13
14% CAGR
$5.3B
$10.2B
Low power
(<0.1W)
Mid power
(0.1W – 0.5W)
High power
(>0.5W – <5W)
Super-high power
(>5W)
RGB
Percentage of revenues for LEDs in lighting
0
20
40
60
80
100
2019201820172016201520142013
0
1
2
3
4
5
6
7
Super-high power
High power
Mid power
Low power
2019201820172016201520142013
Revenues for LEDs in replacement lamps
($B)
20% CAGR
Strategies Unlimited tempers LED and SSL projections but remains bullish on sectors
10 LEDs Magazine SPECIAL REPORT
through the five-year forecast. The details rely on the aforementioned categorization
of LEDs by power rating.
At first glance, the data is surprising. We’ve been hearing for several years about the
rise of mid-power LEDs in a greater number of lighting applications. But the forecast
projects that the mid-power share remains near-constant as a percentage of the
total market. Still, the escalating overall market will take mid-power revenue from
$1B in 2014 to $1.8B in 2019. But why doesn’t mid-power represent a bigger share
percentage-wise? The answer is that many LEDs that are based on typical mid-
power technology platforms operate well in excess of 0.5W today and are actually
captured in the high-power segment.
Despite the inclusion of some super-charged
mid-power LEDs in the high-power category,
that high-power segment will decline as a
percentage of the total, as you can see in
the chart. The super-high-power category
composed primarily of COB LEDs will enjoy
the biggest gains percentage-wise. That gain
is due to a couple of primary factors. Price
erosion is much lower in both high- and
super-high-power LEDs relative to low- and
mid-power LEDs. And COBs are much
simpler for many lighting manufacturers
to work with given that the LEDs have a
single electrical interface and can be more
simply mounted in a design. Moreover,
optics manufacturers have made great
progress in lenses for the relatively-larger
COB LEDs, as was evident in a recent feature
article on optics.
FIG. 12. LED revenue will continue to ramp in
outdoor applications with the most growth
coming in chip-on-board (COB) LEDs.
FIG. 11. Mid-power LEDs will do especially
well in commercial luminaires and specifically
the troffer application.
Revenues for LEDs in commercial luminaires
($M)
0
100
200
300
400
500
Super-high
power
High power
Mid power
Low power
’19’18’17’16’15’14’13
14% CAGR
0
200
400
600
800
1000
’19’18’17’16’15’14’13
Revenues for LEDs in outdoor luminaires
($M)
Super-high
power
High power
12% CAGR
Strategies Unlimited tempers LED and SSL projections but remains bullish on sectors
11 LEDs Magazine SPECIAL REPORT
In her SIL presentation, Pruitt also characterized types of LEDs used in specific
applications, and a couple are of particular interest. Fig. 10 depicts the LED
segments relative to replacement lamps, including A-lamps, directional lamps,
and tubes. Arguably, replacement lamps are the most cost-sensitive portion of the
general illumination market. Yet in terms of percentage of the LED market, high-
power LEDs will remain predominant in the application. Moreover, COB revenue
will grow at a higher rate than either the commodity mid- or low-power LEDs.
Mid-power LEDs will make the greatest gains in the commercial sector, as
documented by Fig. 11. Ceiling troffers are widely used in the commercial sector.
And LED-based luminaires that are focused on the traditional rectilinear troffer
form factors are a good match to mid-power LEDs. The LEDs are applied in a linear
fashion with the components closely spaced for even illumination.
The outdoor segment is one where COBs will really shine, according to Pruitt’s
forecast. Fig. 12 shows high-power LED usage remaining relatively flat in outdoor
applications while COBs ramp considerably. We’d speculate that the improved
COB optics mentioned earlier will be a driver for the success of COBs in outdoor
applications. In the past, luminaires that used COB LEDs relied on reflector-based
designs for beam control. The new lenses can enable far superior beam control that
had been only achievable with smaller sources.
Lighting market data
Now let’s transition to an examination of market data centered on lighting products
presented in the Plenary by Smallwood on day one of SIL (Fig. 13). The presentation
was entitled “How big can the LED lighting market get?” Smallwood addressed
both the lamps and luminaires markets.
Smallwood moved into a leadership position in the Strategies Unlimited lighting
practice in late 2013. He has since revamped the approach that the firm takes to
characterize the lighting market. The research has been expanded to cover lighting
Strategies Unlimited tempers LED and SSL projections but remains bullish on sectors
12 LEDs Magazine SPECIAL REPORT
products based on all types of light sources–not just LED-based products. The data
is segmented for form factors and applications. And Smallwood has led development
of a market model that can yield regional geographical segmentation of the market.
Smallwood also said the new approach will enable more accurate prediction of
saturation by long-life, LED-based products and the coincident shrinking of
market potential.
Starting with the lamps
market, Smallwood said
there are around 45B
installed lamp sockets
in the world with that
number only growing
incrementally in the coming
years (Fig. 14). Today, 9B
incandescent products are
installed in those sockets
with that number projected
to fall to less than 2B by 2022. Smallwood’s projection shows that linear fluorescent
and compact fluorescent (CFL) technologies will remain prevalent through 2022.
Primarily, LED-based replacement lamps will replace the incandescent incumbent
with some displacement of fluorescent and halogen technologies.
Recognize, however, that there is a vast difference between the installed base and
shipments of lamps throughout the forecast period; Strategies Unlimited’s new
model allows the analysts to report both, and by region or globally. For example,
Fig. 15 depicts the difference in the North America region specific to A-lamps. The
installed base chart on the left of Fig. 15 shows a strong presence of incandescent
products, whereas shipments of such products will drop precipitously as LED lamp
shipments continue to rise.
FIG. 13. Philip Smallwood of Strategies Unlimited presented lamp
and luminaire market research at Strategies in Light.
Strategies Unlimited tempers LED and SSL projections but remains bullish on sectors
13 LEDs Magazine SPECIAL REPORT
Smallwood reported that LED
lamps represented 5% of the overall
2014 market globally. He projects
that penetration to rise to 28% in
2018 and to 52% in 2022. Those
numbers may sound low, but
remember the total lamp market
includes tubes, and fluorescent
technology will remain a major
player. Indeed, Smallwood projects
that fluorescent
tubes will still
account for more
than 20% of lamp
shipments in 2022.
Ironically, Smallwood
also reported a very
bullish outlook
for LED-based
replacement tubes
as he broke the data
down by type of
lamp. Smallwood admitted that he never believed the concept of an LED-based
replacement tube to be a very good idea relative to products such as integral, LED-
based luminaires. But the research indicates that the market will heavily rely on such
tube products primarily because of the ease of retrofit. Smallwood projects a 29%
CAGR for tube shipments through 2022, although the growth will flatten at the end
of that period as sockets are saturated.
FIG. 14. The global installed base of lamps will remain a
mix in terms of light-source technology through 2022.
FIG. 15. The installed base of incandescent A-lamps in North America will
decline slowly, whereas new shipments of such products have already
plummeted as LED-lamp shipments rise.
Incandescent
LED
replacement
Halogen
Fluorescent
CFL
Global lamp installed base
(billions of units)
0
10
20
30
40
50
Incandescent units
2014 = 9B
2022 = <2B
’22’21’20’19’18’17’16’15’14
NA residential installed base
of A-lamps (billions of units)
A-lamp shipments
(millions of units)
0
1
2
3
4
5
’22’21’20’19’18’17’16’15’14 ’22’21’20’19’18’17’16’15
900
800
700
600
500
400
300
200
100
0
LED replacement
Incandescent
Halogen
CFL
Strategies Unlimited tempers LED and SSL projections but remains bullish on sectors
14 LEDs Magazine SPECIAL REPORT
Overall saturation will be felt far more acutely. Total lamp shipments will decline by
44% through 2022. Other than the tube market, all of the other lamp types will be
in decline in terms of units shipped by the end of this decade.
Still, the lamp market will remain sizeable in terms of revenue. Fig. 16 shows
the lamp market charted by revenue and segmented by light-source technology.
Revenue will peak at $21B in 2018 but still reach a hefty $16B value in 2022.
Smallwood also covered the luminaires space. And the Strategies Unlimited team
has developed a far more granular model for the broad luminaires segment. The
team is now segmenting the market by different types of fixtures including:
• Downlights
• Troffers
• High bays
• Suspended pendants
• Tracklights
• Street lights
Moreover, the new model includes the ability to sort the data by application
including retail, office, hospitality, and more. The two types of segmentation can
be applied individually or together. And in terms of LED-based fixtures, Strategies
Unlimited is separately tracking fixtures that use LED-based replacement lamps
and fixtures based on integral, LED-based designs.
In 2014, the combination of both types of LED fixtures represented less than 4%
of the total luminaire market in terms of the installed base. But again installed base
and shipments differ. Fig. 17 provides an excellent picture of both market size and
the light-source technologies that will ship in luminaires. Luminaire revenue will
only ramp from $59B in 2014 to $66B in 2022. But as mentioned at the beginning of
the article, 69% of the luminaires will be LED-based in 2022.
Strategies Unlimited tempers LED and SSL projections but remains bullish on sectors
15 LEDs Magazine SPECIAL REPORT
Smallwood closed his presentation with some interesting thoughts. He said, “The
lighting world has accepted that LEDs are the future.” Still, he characterized the
transition as an evolution from the filament to LED sources. He added, however,
that there is a revolution afoot in addition to the changing light sources.
Smallwood said, “The revolution is the ancillary products and technologies such
as networks and controls that are coming along with LED lighting.” Smart lighting
based on sensor-driven autonomous or programmatic controls is a good example.
Smallwood also suggested that the revolution will deliver “lighting with a purpose.”
He said lighting will specifically target needs such as human wellbeing, productivity,
security, and safety.
Smallwood asked the audience, “Would you ever have thought Cisco would present
a keynote at Strategies in Light?” Indeed, that company did.
FIG. 17. The global luminaire market will grow slowly
through 2022, but LED-based products will represent an
increasingly large share of that revenue.
FIG. 16. Global lamp revenue will peak in about
four years as socket saturation with long-life LED-
based products takes place.
Global lamp revenue ($B)
0
5
10
15
20
25
’22’21’20’19’18’17’16’15’14
LED replacement
$18B
$21B
$16B
Incandescent
Halogen
Fluorescent
CFL
Global luminaire market forecast
LED replacement
LED integrated
Incandescent
HID
Halogen
Fluorescent
CFL
2022 $66B2017 $64B2014 $59B
16 LEDS Magazine SPECIAL REPORT
ORIGINALLY PUBLISHED APRIL 22, 2014
Research projects five
years of growth for
packaged LEDs and SSL
Bracketing the keynote presentations at Strategies in Light,
Strategies Unlimited analysts reported positive developments in
the LED component and lighting markets, reports MAURY WRIGHT,
with both projected at double-digit growth through 2018.
THE PLENARY SESSION at the Strategies
in Light (SIL) 2014 conference held
February 25–27 in Santa Clara,
California again featured analysts from
Strategies Unlimited presenting their
most recent research on the packaged
LED component and LED-based
general lighting markets. Packaged
LED revenue was reported at $14.4B
(billion) for 2013 with projection that
the total will reach $25.9B in 2018. The
general lighting market will grow even
more steeply. The SIL presentation
focused on LED replacement lamps,
with that segment alone generating
$4.8B in 2013 and projected to reach $12.2B in 2018. In both cases, the revenue
growth will come amongst price decreases with the next five years being an exciting
time in the maturing solid-state lighting (SSL) space.
FIG. 1. Cree announced the CXA1310 (pictured),
CXA1850, and CXA2590 COB LED arrays leading up
to Strategies in Light.
Research projects five years of growth for packaged LEDs and SSL
17 LEDs Magazine SPECIAL REPORT
The LED research was focused on packaged components, as it has been in the
past. It does not include the sale of bare die. It also excludes products such as
infrared (IR) and ultraviolet (UV) LEDs that are sold into industrial, security, and
other applications.
The LED research does include chip-on-board (COB) LEDs such as the recently
announced Cree CXA1310 pictured in Fig. 1. Analyst Katya Evstratyeva made the
point during her presentation that the line between such COB LEDs and other light
engine or modular products is blurring. Indeed, many companies use the COB term
to describe larger light engines based on printed circuit boards in a variety of form
factors. Conversely, some modules look more like a COB LED than a module, such
as the new Xicato XTM module.
Evstratyeva said that the research firm is planning a report to address the modules
and light engine space. The universe of manufacturers of modular products will
be significantly broader than that of packaged LEDs, and that research will surely
be of interest.
LEDs by regions
Diving into the packaged LED revenue research, Evstratyeva first broke down the
revenue by region and compared 2012 and 2013 data (Fig. 2). There was modest
7% growth in 2013, although as we
mentioned previously the ramp will
be steeper — projected at 13% CAGR
(compound annual growth rate) —
going forward. Companies based
in Japan remain responsible for the
largest sum of global LED revenue.
Certainly, market leader Nichia is in
part responsible for that country’s
position, although Strategies Unlimited
FIG. 2. Packaged LED revenue grew 7% in 2013
with Japan remaining in the top spot in revenue
production.
Source:
Strategies Unlimited
2012 Industry revenues
$13.3 B
2013 Industry revenues
$14.397 B
Taiwan/
SE Asia
16%
Taiwan/
SE Asia
14%
USA
13%
USA
12%
Europe
8%
Europe
8% China
10%
China
8% Japan
27%Japan
32%
Korea
27%
Korea
26%
Research projects five years of growth for packaged LEDs and SSL
18 LEDs Magazine SPECIAL REPORT
tracks the five largest LED makers in Japan. The analysts also track five companies
in Korea that in aggregate earn the second highest revenues.
Outside of Japan and Korea, however, the story is far more interesting. In the US,
for instance, the revenue is generated by only three companies and in Europe only
one is tracked. In contrast, Strategies Unlimited tracks 13 companies in Taiwan and
nine in China. Those numbers are indicative of the upstarts attempting to win space
in what is already a crowded market.
Application segments
Now let’s discuss the application segments for packaged LEDs. The Strategies
Unlimited team has long broken the market into five segments plus a catchall
other category:
• Backlights for displays, monitors, and TVs
• Mobile devices
• Automotive lighting
• Signage
• General lighting
• Other
Fig. 3 depicts these market segments
and the contribution of LED revenue
that is attributable to each segment.
Clearly, the general lighting segment
will drive the LED component
market going forward. Indeed, general
lighting displaced backlighting as the
growth driver, as we reported in our
SIL coverage last year. Still, all of the
segments are significant and worth
further discussion.
FIG. 3. Packaged LED revenue growth segment by
application projected through 2018.
Revenues (US$B)
$14.4B
$25.9B
CAGR
13%
0
5
10
15
20
25
30
’12 ’13 ’14 ’15 ’16 ’17 ’18
Others
Lighting
Signage
Automotive lighting
Mobile devices
Backlight in displays
and monitors
Research projects five years of growth for packaged LEDs and SSL
19 LEDs Magazine SPECIAL REPORT
Given that backlighting has been such
a significant market, let’s begin in that
application. Strategies Unlimited is
projecting in a decline in the segment
at a 7.74% CAGR from 2013 to 2018.
There are several factors that are
combining to portend the decline.
First of all, the application segment
is virtually fully saturated with a
transition to LED backlights at this
point. Second, brighter LED components mean that in many cases fewer LEDs
will be needed to backlight a screen. Third, the price drop in LED components
has been especially acute in the mid- and low-power LED space and those are the
predominant LEDs used in the application.
Fig. 4 details the backlight segment. The peak in the 2011 to 2012 timeframe came
as there were still legacy fluorescent-based backlights in use and more potential
for market share gains for LEDs. Still, the projected $1.7B in 2018 is a very
significant market.
Mobile applications
Moving to mobile, Strategies
Unlimited primarily focuses on mobile
phones, including smartphones, and
tablets. The mobile sector is projected
in a more moderate 2.36% decline
(Fig. 5). As with the backlight segment,
lower LED prices and brighter
components are part of the story.
FIG. 4. LED revenue in the backlight application will
decline going forward, driven by lower component
prices and brighter LEDs.
Revenues (US$B)
0.5
0.0
1.0
1.5
2.0
2.5
3.0
’10 ’11 ’12 ’13 ’14 ’15 ’16 ’17 ’18
Monitors
Video walls
TVs
$2.6B
$1.7B
CAGR
-7.74%
FIG. 5. The mobile segment is in a gradual decline
in terms of LED revenue, although the camera flash
sub-segment lessened the impact of lower-cost LEDs.
Revenues (US$B)
0.5
0.0
1.0
1.5
2.0
2.5
3.0
3.5
’10 ’11 ’12 ’13 ’14 ’15 ’16 ’17 ’18
Others
Mobile
computing
devices
Mobile
phone
revenues
$2.6B
$2.3B
CAGR
-2.36%
Research projects five years of growth for packaged LEDs and SSL
20 LEDs Magazine SPECIAL REPORT
There are market dynamics, however, that have made the revenue decline for mobile
more shallow than for backlight. In many cases, mobile devices have displaced
dedicated digital cameras as the primary camera used by consumers. Higher pixel
counts in image sensors and lower cost have enabled better cameras in mobile
devices. And now the market is demanding better LED-based flash for cameras.
We discuss the trend in the companion story on the SIL conference. In many cases,
mobile device makers are including an LED-based flash on both the forward- and
rear-facing cameras in mobile devices.
Evstratyeva said LED revenue sold into flash applications is in the $700M (million)
range in 2013. Moreover, she said that sub-segment will continue to rise in revenue
through 2018, albeit not at a rate that will eliminate the aggregate projected decline.
Automotive lighting
Now we will transition into growth segments including automotive lighting and
signage. There are a number of factors that will keep LED revenue on the rise in the
automotive segment. For starters, the market is far from saturated. LED exterior
lighting including headlamps has been primarily limited to luxury-level vehicles. But
that situation is changing. Evstratyeva noted that Toyota is moving to LED-based
headlamps on its Corolla model, which is a smaller economy vehicle.
LED headlamps are also moving
beyond stylish cars. Ford recently
announced that its best-selling
F-150 light-duty truck will get LED
headlamps across the model. Ford
noted that the durability of LED
lighting technology was a good match
to the work truck market. Indeed,
the company said it fired stones at
the headlamp unit in tests. But the
FIG. 6. The automotive segment for LED lighting is far
from saturated and is expected to deliver growth in
terms of LED revenue.
Revenues (US$B)
0.5
0.0
1.0
1.5
2.0
2.5
’12 ’13 ’14 ’15 ’16 ’17 ’18
$1.4B
$2.3BCAGR
10.16%
Exterior
lighting
Interior
lighting
Research projects five years of growth for packaged LEDs and SSL
21 LEDs Magazine SPECIAL REPORT
company also noted a styling angle and the LED-lit light guide implemented around
the perimeter of the unit that the company said will offer a signature look.
Fig. 6 details the interior and exterior sub-segments of the automotive market. The
exterior segment will remain the larger of the two, primarily because of the number
of different ways that LEDs are used in headlamps, turn signals, brake lights, and
other functions. Still, Evstratyeva pointed out the in-cabin potential. She said auto
makers are increasingly using LED lighting with features such as color tunability to
add styling inside the cabin and to help drive sales.
Signage is also a growth market that
totaled $1.8B in LED revenue in 2013
with growth projected to $2.4B in
2018 (Fig. 7). The bulk of the sign
manufacturing is taking place in
China, so that region is driving the
LED purchases. The sign market itself
will grow from $4.7B in 2013 to $6.1B
in 2018 and that would indicate a
market that is far from saturation.
General lighting
And now let’s get to general lighting and the largest market for LEDs going forward.
Here we will look at both LED revenue trends and at lighting revenues. Moreover,
we will consider the types of LEDs being used in general lighting and how specific
LED manufacturers are faring in the segment.
The chart in Fig. 8 is a complex one that depicts the revenue forecast for packaged
LEDs relative to specific sub-segments of the lighting market. While we regularly
write about — and presentations at conferences such as SIL support — the premise
that LEDs will fundamentally change the lighting market, presumably the bulb
FIG. 7. Signage will remain a growing source of LED
revenue for the next five years.
Revenues (US$B)
0.5
0.0
1.0
1.5
2.0
2.5
’12 ’13 ’14 ’15 ’16 ’17 ’18
Channel letters
and others
LED multi-color
LED single-color
LED full-color
CAGR
5.72%
$2.4B
$1.8B
Research projects five years of growth for packaged LEDs and SSL
22 LEDs Magazine SPECIAL REPORT
form will begin to disappear in favor
of luminaires with integral LEDs
or modular SSL engines. And these
new luminaires will truly leverage the
compact size of LED light sources
and the ability to distribute LEDs in
arrays to cover large areas. Examples of
revolutionary new designs include the
planar fixtures based on light guides
that are edge lit with LEDs.
LEDs may indeed yet revolutionize
lighting product design. But Fig. 8 makes it clear that through 2018 the replacement
lamp will be the most widely deployed lighting product consuming LEDs. The
graph tells an interesting story. Lamps trailed the aggregate luminaire segment in
2013, although the overall lamps LED revenue was an impressive $1.5B. But soon
lamps will account for half of the LED revenue for components sold into lighting.
Ironically, socket saturation will happen in the lamps space toward the end of the
projection window, and once again luminaires will become the larger sub-segment
for LED revenues.
It is worth noting that the replacement lamps segment includes products sold into
both residential and commercial applications. Strategies Unlimited includes LED-
based linear tubes in the category, for example, and those products target industrial
and commercial applications. Likewise, the MR16 sub-segment is mostly based on
business customers whereas A-lamps are more prominent in residential applications.
LED lamp market
Taking a deeper look at the lamp market, Philip Smallwood, director of research at
Strategies Unlimited, addressed the end product market at SIL. He presented the
adoption graph depicted in Fig. 9 that pretty much confirms the LED research data
FIG. 8. The lighting market will consume the most
LEDs by revenue, and the replacement lamps sub-
segment will be the largest consumer through 2018.
’13 ’14 ’15 ’16 ’17 ’18
Revenues (US$B)
$4.4B
$14.9B
$0.5B $0.8B $1.4B $2.3B
$3.5B $4.3B
$1.5B
$2.5B
$4.0B
$5.0B
$6.6B
$7.3B
0
2
4
6
8
10
12
14
16
Replacement lamps
Strips and strings
Outdoor area
Industrial
Architectural
Commercial
Residential
Consumer portable
Entertainment
Retail display
Off-grid
Safety/security
Research projects five years of growth for packaged LEDs and SSL
23 LEDs Magazine SPECIAL REPORT
in Fig. 8, the blue arrow standing for the
penetration of LED lamps with regard
to the total global installed base. The
LED lamp market today is at the earliest
stages in terms of technology adoption.
Smallwood asserted that we haven’t
even reached the early adopter stage
at this point.
Still, the lamp market has racked
up some impressive revenues. In
aggregate lamps revenue totaled
$4.8B in 2013. Smallwood projected
growth to $12.2B in 2018 — a 21%
CAGR (Fig. 10). What you may
find surprising is that the MR16
segment is the largest segment at the
moment and will continue to be so
until A-lamps catch up in the 2015 to
2016 timeframe.
There are several factors at play in
the size of the MR16 sub-segment.
For starters, the lamps are primarily
deployed in business applications, as
mentioned before. And businesses
have adopted LED lighting more
quickly than residential consumers.
There also have been many low-quality MR16 lamps made in China and sold into
markets such as Russia. Smallwood said as many as 50M MR16 lamps were sold in
Russia in 2013.
FIG. 9. In terms of the consumption of LED retrofit
lamps, the market is still not at the early adopter
stage.
Market share (%)
Innovators
2.5%
Early
majority
34%
Late
majority
34%
Laggards
16%
Early
adopters
13.5%
100
75
50
25
0
FIG. 10. LED replacement lamp revenue is on a steep
21% growth path over the next five years.
Revenues (US$B)
’13 ’14’12 ’15 ’16 ’17 ’18
0
2
4
6
8
10
12
14
Reflector
MR16
LFT
Decorative/other
A-19
2013
$4.8B
2018
$12.2B
CAGR
21%
Revenues (US$B)
0.5
0.0
1.0
1.5
2.0
2.5
3.0
3.5
’13 ’14’12 ’15 ’16 ’17 ’18
2013
$1.7B
2018
$3.2BCAGR
13%
FIG. 11. MR16 LED lamps will be impacted by socket
saturation earlier than other sub-segments.
Research projects five years of growth for packaged LEDs and SSL
24 LEDs Magazine SPECIAL REPORT
The MR16 sub-segment is also instructive of what will happen across the lamps
market because it is a year or two in front of the other sub-segments in terms of
adoption. Fig. 11 shows that in the 2017–2018 timeframe socket saturation will
impact MR16 lamps sales with a decline in revenue inevitable.
Conversely, Smallwood projects A-lamp revenue at $5.2B in 2018, exceeding MR16
revenue and still on a growth path at that point. But saturation will happen soon
after, and with the long LED lifetime the lamps market will decline considerably.
Smallwood said that North America has been consuming 1.1 replacement lamp per
year based on legacy incandescent and compact-fluorescent technology. That per-
year unit volume will be slashed by LED lifetime.
Smallwood also had an interesting outlook on the LED-based tube market, which as
Fig. 10 shows is substantial but probably not as large as the participants in that space
would hope based on the huge installed base of linear fluorescent lamps around
the globe. While many prognosticators, including the US Department of Energy
(DOE), have questioned the lighting quality produced by LED tubes, Smallwood
based his thoughts on the incumbent technology. He said T8 and T5 fluorescent
tubes perform well and the efficiency advantage of LEDs is not significant enough to
spur a broad retrofit wave.
LED luminaires
Let’s briefly consider the state of the LED luminaire market. While comparing
lamps and luminaires in terms of packaged LED revenue revealed that lamps were
the larger segment, the opposite is true in terms of revenue of the lighting products.
Consider Fig. 12. Luminaire revenues totaled $11.7B in 2013 and will grow to
$21.3B in five years. Luminaires are simply much more complex products with more
expensive subsystems such as driver electronics and housings. And LEDs with
dropping component prices represent an increasingly smaller portion of the bill of
materials cost for both lamps and luminaires.
Research projects five years of growth for packaged LEDs and SSL
25 LEDs Magazine SPECIAL REPORT
The luminaire market is
predominantly driven by four sub-
segments. Architectural or façade
lighting outdoors has been an early
area of success due to both the
energy savings associated with LEDs
and dynamic color capabilities.
Outdoor street and area lighting is
a prime sub-segment because those
products burn all night, and energy
and maintenance savings are critical.
Likewise, the commercial and industrial sub-segments are very focused on energy
and maintenance savings and, more recently, the quality of light that LED sources
can deliver relative to fluorescent and high-intensity discharge (HID) sources.
Success in lighting
Having covered the lighting products, let’s return to a final discussion focused
on LEDs relative to lighting applications. First, we will look at how well the LED
manufacturers are penetrating the general lighting market. Strategies Unlimited
does not break such data out per individual LED
manufacturers, but we can make some inferences based
on Fig. 13, and the discussion we had based around Fig. 2
and the number of LED makers that Strategies Unlimited
tracks in each region.
In perhaps a surprising fact, Evstratyeva reported that
LED makers in the US accounted for the majority of the
LED revenue sold into lighting in 2013. The bulk of that
revenue is surely attributable to Cree. While the company
is only the sixth-largest LED supplier based on revenue for
FIG. 12. LED luminaire revenue is much higher than
lamps due to the complexity of the products.
’13 ’14’12 ’15 ’16 ’17 ’18
Revenues (US$B)
0
5
10
15
20
25
Emergency
Outdoor
Industrial
Architectural
Commercial
Residential
Consumer portable
Entertainment
Retail display
Off-grid
2013
$11.7B
2018
$21.3B
CAGR
12.3%
US$4.47B
Japan
21%
Korea
15%
China
11%
Taiwan
18%
USA
31%
Europe
4%
FIG. 13. US LED suppliers
are leading the way in the
lighting application.
Research projects five years of growth for packaged LEDs and SSL
26 LEDs Magazine SPECIAL REPORT
2013, Cree is perhaps the top supplier in lighting applications and has taken good
advantage of its early focus on the lighting application segment.
The real question is how the lighting market will proceed going forward. And
much of that discussion could hinge on the types of LEDs used in various lighting
products. Strategies Unlimited continues to segment the LED market into low-
power, mid-power, high-power, and super-high-power sub-segments. The key
differentiating point has been the line in the middle where mid-power LEDs are
operated at 0.5W and below and high-power LEDs in the 0.5W to 5W range. High-
power LEDs have been dominant in lighting applications.
LED categorization
The boundary between mid- and
high-power LEDs has also been neatly
aligned with plastic or hybrid-plastic
packages used in the lower-end LEDs
and more-reliable ceramic packages
being used in higher-power devices. But
the boundary lines are being crossed
from every perspective. Mid-power
LEDs are being operated at power levels
above 0.5W and increasingly include
architectural elements that were developed first in high-power LEDs. For example,
Philips just announced high-voltage mid-power LEDs, and added epoxy-molded-
compound packages that should deliver better reliability. Cree continues to push
ceramic packages into smaller footprints — smaller than mid-power LEDs — while
delivering the luminous flux of larger high-power LEDs.
Evstratyeva readily admitted in her SIL presentation that new thinking was needed
in the area of segmenting the LED market by type of device. Still, she presented
’13 ’14 ’15 ’16 ’17 ’18
Revenues (US$B)
0
1
2
3
4
5
6
7
8
Super-high
power
High power
Medium
power
Low power
FIG. 14. The replacement lamps market will consume
LEDs across the power sub-segment categorization.
Research projects five years of growth for packaged LEDs and SSL
27 LEDs Magazine SPECIAL REPORT
some projections based on the conventional segmentation tied to power level. And
the results were surprising to some in the audience.
For example, consider the replacement lamps market depicted in Fig. 14 segmented
by LED type. Strategies Unlimited projects high-power LEDs to remain dominant
in terms of revenue in the retrofit lamps segment. A number of attendees at SIL
questioned that projection in networking events after the Plenary session.
We’d speculate, however, that the devil is in the details. If you stick with a
categorization based on power level, then LEDs packaged in a plastic or hybrid-
composition package, and that operate above the 0.5W level, are in the high-power
category. Moreover, remember that the breakdown is based on LED revenue and
not unit volume. High-power LEDs sell at higher price levels; therefore, the products
that use high-power LEDs will contribute more to the high-power category
measured by revenue.
The surprising angle to the category-based breakdown is the increasing prominence
of COB LEDs across many different lighting applications. Some in the industry have
the mistaken idea that COBs deliver more uniform light. In reality a careful optical
design can almost always deliver better optical performance with discrete emitters.
The fact is that COBs are easier to design into products. Driving the COBs is easier
and the thermals are in part handled in the LED package. Coming out of SIL the
prevailing thought was that you should expect COBs in virtually every lighting
application, with lighting manufacturers trading simplicity of product development
for less-precise beam control.
28 LEDS Magazine SPECIAL REPORT
ORIGINALLY PUBLISHED MARCH 26, 2013
Packaged LED market resumes
moderate growth while
the SSL market will enjoy
12% CAGR through 2017
General lighting applications are now the largest market,
measured by revenue, for packaged LEDs, reports MAURY WRIGHT
from the Strategies in Light conference, and the SSL market
has grown to $11.8 billion for lamps and luminaires.
OPENING AND CLOSING the Plenary session at the Strategies in Light (SIL)
conference, Ella Shum and Vrinda Bhandarkar of Strategies Unlimited reported
on the 2012 market for packaged LEDs and SSL products respectively. Packaged
LED revenue hit $13.7 B (billion) in 2012, while solid-state lighting (SSL) revenue
for lamps and luminaires combined reach $11.8 B. Both markets will continue to
grow through 2017 although LED revenue growth will be moderated by falling
component prices even as more LEDs are manufactured.
Shum, director of the LED practice at Strategies Unlimited, reported that the global
market for packaged LEDs in 2012 totaled $13.7 B. That total does not include the
sale of bare die or modular lighting products, but solely packaged LEDs whether the
product in question is a single-emitter LED, a multi-die package, or a chip-on-board
(COB) LED array. The total market was up from $12.5 B in 2011 as we covered in
our SIL report from last year.
29 LEDs Magazine SPECIAL REPORT
Packaged LED market resumes moderate growth while the SSL market will enjoy 12% CAGR
LED market by segments
Shum segments the packaged LED market into backlight (TV/monitor), mobile,
signage, automotive, lighting and other categories. For the first time in 2012, general
lighting became the largest market for packaged LEDs globally at $3.1 B. Fig. 1
depicts the market breakdown by revenue for packaged LEDs across the segments
and shows the growth or decline in the segments from 2011 to 2012.
Shum’s talk was entitled, “The art of war” and
she opened saying, “We have had a bloodbath
in the last few years in the LED industry.”
As she reported last year, there has been an
oversupply of components in the market
driven primarily by a surplus of products
made for the backlight segment. The TV
market has been slower than some expected
to transition from fluorescent to LED
backlights while LED manufacturers sought
to win in that segment.
The result of the surplus has been even lower LED prices than could be justified
by advancements in LED manufacturing technology – especially in low- and
mid-power devices. But the low prices have impacted pricing expectations even
in high-power LEDs designed specifically for lighting applications. And LED
manufacturers have competed tenaciously to win market share, leading to the title of
the presentation.
Manufacturer rankings
Continuing with the battle theme, Shum provided her rankings of the top 10
packaged LED vendors for 2012 (Table 1) and then discussed strategies that
different manufacturers are pursuing and specific challenges that some face. There
was little change in the order of the suppliers relative to 2011, although Shum also
2011
2012
Revenue (US$, B)
Backlight
TV/monitor
Mobile Sign Lighting Automotive Others
2.5
2.0
3.5
3.0
1.5
1.0
0.5
0.0
FIG. 1. Packaged LED revenue growth
segmented by market over 2011 to 2012.
30 LEDs Magazine SPECIAL REPORT
Packaged LED market resumes moderate growth while the SSL market will enjoy 12% CAGR
supplied growth/decline rates by manufacturer that could
foretell future changes.
Samsung was a major mover in terms of growth, although its
overall position in the ranking was unchanged. The growth,
according to Shum, comes from its production of LEDs for
use in Samsung consumer products such as TVs. Likewise,
Lumens entered the rankings in a tie for the tenth spot –
actually making the rankings a top-11 list. And Lumens is another major supplier to
Samsung for consumer products. Samsung, however, seems intent on continuing to
ramp its LED manufacturing numbers, becoming even more vertically integrated in
terms of its consumer products. Toyoda Gosei jumped a spot in the rankings. Shum
said that the company’s 37% growth came thanks to supplying LEDs for Apple
mobile products.
Cree and Philips Lumileds appear to be the most prominent
beneficiaries of the ramp in LEDs used for general
lighting applications. Both experienced growth
in the 20% range. And as we will discuss in more
detail shortly, general lighting is the segment with
the most long-term growth potential.
Shum said that the top 11 companies in her
rankings accounted for 72% of the global
packaged LED revenue. Manufacturers in Japan
led with 30% of the overall market followed by
Korea at 28%, Taiwan and South East Asia at 15% and China at 8% (Fig. 3). It might
be worth noting that Shum has expressed the opinion that China will have a player
in the top ten within five years. Manufacturers in the US and Europe combined
make up 19% of the total market.
1. Nichia 5%
2. Samsung 22%
3. Osram Opto 5%
4. LG Innotek -1%
5. Seoul Semi
Philips Lumileds
14%
21%
7. Cree 18%
8. TG 18%
9. Sharp 14%
10. Everlight
Lumens
-1%
32%
FIG. 2. Nichia’s 757 LED in a QFN
plastic package.
31 LEDs Magazine SPECIAL REPORT
Packaged LED market resumes moderate growth while the SSL market will enjoy 12% CAGR
In terms of strategy, Shum described different
approaches that manufacturers are taking to
differentiate their products and grow their market.
For example, she cited the recent 100W COB LED
announced by Sharp as an example of greater lumen
output through larger size. She noted that Cree has
continued to push performance in terms of efficacy,
specifically mentioning the recently announced 200-
lm/W XLamp MK-R LED. Shum said that Bridgelux
was attempting to simplify luminaire design with its
Vero COB LEDs that separate the LED and plastic holder that can include either
large solder pads or a connector.
Of course lower-component cost is a common goal among LED manufacturers,
although the manufacturers take different approaches to the fact that higher
volumes and maturing manufacturing technology is enabling cost reduction. Cree,
for example, tends to try and keep LED cost relatively constant while offering
higher performance – still providing cost savings at the SSL system level as fewer
LEDs are required. Shum cited Nichia for being at the forefront of LED price drops
and noted the company’s 757 high-power LED family that is packaged more like
a low- or mid-power device (Fig. 2). Nichia packages the 757 LEDs in a plastic
QFN (Quad Flat No-leads) package developed and widely used in the broader
semiconductor market.
Separate from technology strategy, Shum also noted that LED manufacturers
are taking different business and market approaches such as the aforementioned
Samsung strategy of vertical integration. She siad that many companies were
seeking to grow through mergers or alliances mentioning specifically Epistar and
Huga Optotech; Nichia and Citizen; and Toyoda Gosei and Showa Denko. Cree,
Osram, and Philips are all helping to drive the LED component market by pushing
SSL deployment – essentially another approach to vertical integration. Shum
FIG. 3. Packaged LED revenue in
2012 by region.
Source:
Strategies Unlimited
Japan
30%
Korea
28%
US/Europe
19%
Taiwan/
SE Asia
15%
China
8%
32 LEDs Magazine SPECIAL REPORT
Packaged LED market resumes moderate growth while the SSL market will enjoy 12% CAGR
did not have positive thoughts for the small- and mid-size LED manufacturers
essentially predicting that most will not survive as independent LED manufacturers.
Market segment details
Getting back to market segments, Shum discussed each in depth. The 2012 sales
were broken down by SSL at 23%, backlights for TVs and monitors at 22%, mobile
at 19%, signage at 13%, automotive at 10%, and other at 13 %. Referring back To Fig.
1, it’s clear that most of the segments are saturated or are moving quickly toward
that position, with the exception of lighting. The lighting segment experienced
tremendous growth from just over $1.5 B in 2011 to the $3.1 B number in 2012.
Still all of the segments are substantial in terms of LEDs consumed and warrant
further examination starting with the backlight segment that had been the largest
growth segment for LEDs prior to 2012. Last year at SIL, Shum predicted that a new
class of low-cost, direct-backlit TVs were headed to market and that the trend could
greatly impact LED sales. At that time no companies were actually producing what
Shum calls chubby TVs. She said that from March to December of 2012, however,
there were around 20 million such TVs sold globally.
The driver behind thicker TVs is lower cost. Making the TV thicker allows the
TV manufacturer to use fewer brighter LEDs to effectively backlight the screen.
That may seem completely ironic given that the value proposition of LED-based
TVs has been either super-slim edge-lit models, or direct-lit models that greatly
enhanced picture quality via large numbers of LEDs and local dimming. But now
LED backlighting can be a low-cost play for TV manufacturers at the lower end of
their portfolio.
TV trends
Shum predicts that the chubby TVs will represent an increasingly larger portion
of the market over the course of the next five years. Fig. 4 depicts both the revenue
value of the LEDs used in different types of TVs on the left axis and the number of
33 LEDs Magazine SPECIAL REPORT
Packaged LED market resumes moderate growth while the SSL market will enjoy 12% CAGR
LEDs that the types of TVs will consume.
You can clearly see the impact of reductions
in LED prices going forward as the TV
segment will consume more LEDs while the
market value of those LEDs declines.
There are a number of factors that
could yet impact the forecast. At the
Consumer Electronics Show back
in January, for example, a number of
companies demonstrated what are being called Ultra HD or 4k TVs that feature
4000×2000-pixel resolution – four times the resolution of today’s best HDTVs. It
remains to be seen how fast those sets come to market or if consumers will pay a
premium price for them. But they will use significantly more LEDs. Such TVs will
almost universally use a direct-backlight scheme with local dimming. Shum said
each set could consume more than 5000 7030-package LEDs.
Energy regulatory issues could also come into play including the Energy Star
program administered by the US Environmental Protection Agency and at the
state level by programs such as California Title 20. For example, Energy Star 6.0
requires that TV sets larger than 55 inches consume no more power than 55-inch
sets. Direct-backlit designs with local dimming consume less power because the
backlight LEDs for much of the display may be dimmed at any given time. So such
regulations could increase the use of local dimming, or TV manufacturers could
use the chubby model and further reduce the number of LEDs used and maximum
light levels that TVs are capable of delivering.
Mobile, auto, and signage applications
Just behind the backlight market in terms of revenue, the mobile segment remains
significant, consuming more than $2.5 B in LEDs and is comprised of both phones
and tablets. The phone segment alone totaled $1.4 B in 2012. There are two factors
FIG. 4. LED revenue in the TV market segment
by the backlighting scheme used.
Source:
Strategies Unlimited
3.0
2.5
2.0
1.5
1.0
0.5
0.0
160
140
120
100
80
60
40
20
0
2011
Revenue (US$, B)
Edge lit w/o dimming
Edge lit with dimming
Direct backlight
Low-cost backlit
2012 2013 2014 2015 2016 2017
Units (M)
Edge lit w/o dimming
Edge lit with dimming
Direct backlight
Low-cost backlit
34 LEDs Magazine SPECIAL REPORT
Packaged LED market resumes moderate growth while the SSL market will enjoy 12% CAGR
driving more LED sales – the transition
to smartphones requiring more and better
backlights and the broad inclusion of an
LED as a camera flash on phones.
Fig. 5 shows Shum’s market projection for
the mobile phone space over the next five
years. Sales into the flash usage are the only
place where she sees revenues rising. But the
rising penetration of smart phones will to a
degree mitigate the impact of falling LED prices. The tablet market is less certain
at this point, although Shum did note the overall trend of an increase in tablet sales
relative to decline in notebook computer sales.
The auto market includes both interior lighting and exterior lighting including
headlamps. The latter promises to be the growth sub segment. It is being enabled
by what Shum termed the magic bullet – new optics. Manufacturers are developing
total internal reflection optics (TIR) that can enable a number of different headlamp
types that will ultimately allow auto manufacturers to move to LED-based designs
across their entire fleet.
At the low end of the auto market you will see reflector-type designs with a
transition to projector-type headlamps that use TIRs on higher-priced vehicles.
At the high end, there are products classified as direct-projection headlamps that
have multiple LED/optic elements for different illumination angles that can go far
beyond the legacy low- and high-beam settings in terms of beam control.
The total market for LEDs used in exterior auto lighting applications in 2012 was
$737 million. Fig. 6 details the total exterior lighting market broken up by how the
LEDs are used projected through 2017. The daytime running lamps (DRL) usage
has been the largest consumer of LEDs although that will give way to headlamps in
FIG. 5. LED revenue in mobile phones
segmented by usage in the phone.
Source:
Strategies Unlimited
Revenue (US$, M)
0
700
600
500
400
300
200
100
2011 2012 2013 2014
Flash
Smart phone
display
Feature phones
display
Keypad
RGB multichips
ringer
2015 2016 2017
35 LEDs Magazine SPECIAL REPORT
Packaged LED market resumes moderate growth while the SSL market will enjoy 12% CAGR
the 2014-2015 timeframe. And the headlamp
usage is growing at a CAGR of 36% based
on LED revenue. Shum projects a relatively
flat market for LEDs used in interior
applications. More LEDs will be utilized in
more ways than ever, including as backlights
for what are becoming almost ubiquitous
video panels. But LED component price
drops will keep the market flat from an LED
revenue perspective.
The signage market is one that is fully saturated in terms of using SSL technology.
Still, Shum projects steady, although unspectacular, growth for the segment. In
2012, LED revenue for the segment totaled $1.7 B and Shum projects that it will
cross $2 B in 2015.
LEDs in lighting
Coming full circle, the real growth in LED sales will come in general SSL
applications. Shum projects that LED revenue from lighting to grow from the
previously mentioned $3.1 B in 2012 to $4.4 B in 2017, representing a CAGR
of 7% (Fig. 7).
The projected growth is especially impressive
if you consider the rate at which prices
are dropping. Fig. 8 depicts the increase
in efficacy over the past five years plotted
against the decrease in dollar per kilo lumen
($/klm) – the latter a metric that the US
Department of Energy (DOE) tracks and
projects in its SSL program. Indeed in the
DOE’s latest SSL Multi-Year Program Plan
FIG. 6. LED revenue in auto exterior lighting
showing that growth will come in headlamps.
Source:
Strategies Unlimited
Revenue (US$, M)
0
350
300
450
400
250
200
150
100
50
2011 2012 2013 2014
DRL
Headlamp
CHMSL
Stop/tail
2 wheel vehicles
Trucks, buses,
warning signals
After market
Headlamp
5 year CAGR
36%
Others
2015 2016 2017
FIG. 7. LED revenue in general lighting
segmented by application.
Source:
Strategies Unlimited
Revenue (US$, B)
Off-grid
Outdoor area
Industrial
Commercial
Retail display
Other lighting
Emergency lighting
Consumer portable
Residential
Entertainment
Architectural
Replacement lamps
0.0
3.5
3.0
4.5
4.0
2.5
2.0
1.5
1.0
0.5
2012 2013 2014 2015 2016 2017
CAGR
7%
$3.1B
$4.4B
36 LEDs Magazine SPECIAL REPORT
Packaged LED market resumes moderate growth while the SSL market will enjoy 12% CAGR
published in April 2012, the agency projected
that it would be after 2013 before packaged
LED prices dropped to the $3/klm level
and after 2015 before prices hit $2/klm. The
$3.45/klm number in Fig. 8 represents the
average for the year 2012. At SIL, Shum said
she thinks the figure has already dropped to
$2/klm via products such as the Nichia 757
mentioned earlier.
Later in the Plenary session Bhandarkar, director of research for LED lighting at
Strategies Unlimited, presented data on the actual market for lighting products.
Bhandarkar said replacement lamp revenue grew from $2.1 B in 2011 to $2.58
B in 2012. The largest jump came in Japan where energy concerns caused by
the earthquake and tsunami that occurred in 2011 knocking out major energy-
generation facilities.
In the luminaire sector, revenue grew from $7.2 B in 2011 to $9.2 B in 2012. The
commercial market segment is leading the adoption of SSL, representing 23%
of the market. Growth in luminaires is fairly consistent across the globe. For the
first time, Bhandarkar also reported on another category that includes products
such as flexible strings, furniture lighting,
airplane lighting, toys and other products
that totaled $2.75 B bring the overall market
total to $14.5 B.
Bhandarkar also addressed some specific
types of products. She said, “LED downlights
became a commodity market in 2012 – more
than 50% of products sold in Japan were
LEDs.” Looking forward, she said “Troffers
FIG. 8. LED efficacy is steeply rising while
price measured by $/klm is dropping.
Source:
Strategies Unlimited
Average lm/1W pkgPrice/klm
2007 2008
$32
$22
$16
$13
130
120
110
98
77
70
$6.25
$3.45
2009 2010 2011 2012
FIG. 9. LED revenues across all applications
will rise gently driven by lighting.
Source:
Strategies Unlimited
Revenue (US$, B)
0
12
10
16
14
8
6
4
2
2012
$13.7B
20132011 2014 2015 2016 2017
$15B
CAGR
1.8%
Backlight TV/
monitor
Mobile
Sign
Lighting
Automotive
Others
37 LEDs Magazine SPECIAL REPORT
Packaged LED market resumes moderate growth while the SSL market will enjoy 12% CAGR
will be the next major wave of SSL deployment starting this year.” She expects the
troffer market to be strong in 2014 and going into 2015.
Overall, the SSL market will enjoy a CAGR of 12% through 2017. Bhandarkar
projects that SSL luminaire revenue will exceed $20 B in 2017.
Projecting the packaged LED market
Given the push that packaged LEDs are getting from lighting applications, where are
we headed you might ask? The news was better than last year. At SIL in 2012, Shum
projected a slight increase in packaged LED revenue in 2013 followed by a -0.2%
CAGR through 2016. Given the continuing price drop in components, the revenue
forecast hasn’t changed tremendously but the five-year CAGR projected this year is
positive at 1.8% as depicted in Fig. 9.
Lighting will continue to grow and drive the
market. Shum predicts that packaged LED
revenue will hit $15 B by 2017. For the first
time, Shum also showed a chart reflecting
the number of packaged LEDs sold (Fig. 10).
We include it here to make the point that in
terms of unit volumes, the industry is still in
a tremendous growth mode. But as Shum
pointed out, the numbers can be misleading
because the units sold include everything
from single-die packages to COBs that have dozens of emitters in a package. A chart
that showed LED die unit volume would show even steeper growth.
FIG. 10. The unit volume of packaged LEDs
produced is on a steep growth path.
Source:
Strategies Unlimited
Units (B)
0
250
200
350
300
450
500
400
150
100
50
2012 2013 2014 2015 2016 2017
RGB
InGaAlP High power
InGaAlP Mid power
InGaAlP Low power
InGaN Super high power
InGaN High power
InGaN Mid power
InGaN Low power

More Related Content

What's hot

Sustainability in Telecoms
Sustainability in TelecomsSustainability in Telecoms
Sustainability in Telecoms
Luis Orozco
 
Kodak annualReport05
Kodak annualReport05Kodak annualReport05
Kodak annualReport05
finance24
 
ARC 2008 Annual Report
ARC 2008 Annual ReportARC 2008 Annual Report
ARC 2008 Annual Report
Lee Flanagin
 
Big Telecom Revenue Project prepared by Lance Heaps
Big Telecom Revenue Project prepared by Lance HeapsBig Telecom Revenue Project prepared by Lance Heaps
Big Telecom Revenue Project prepared by Lance Heaps
Lance Heaps
 

What's hot (18)

Industry Report: Consumer electronics
Industry Report: Consumer electronicsIndustry Report: Consumer electronics
Industry Report: Consumer electronics
 
Deloitte winners report technology_fast_50_2010
Deloitte winners report technology_fast_50_2010Deloitte winners report technology_fast_50_2010
Deloitte winners report technology_fast_50_2010
 
BCI likely to purchase Christmas 2013
BCI likely to purchase Christmas 2013BCI likely to purchase Christmas 2013
BCI likely to purchase Christmas 2013
 
Corning, inc. GLW fin
Corning, inc. GLW finCorning, inc. GLW fin
Corning, inc. GLW fin
 
Httpool Digital Audio Advertising Report 2021
Httpool Digital Audio Advertising Report 2021Httpool Digital Audio Advertising Report 2021
Httpool Digital Audio Advertising Report 2021
 
Posterscope Media Digest October 2012
Posterscope Media Digest October 2012Posterscope Media Digest October 2012
Posterscope Media Digest October 2012
 
NEW AGE AD TRENDS - 2021
 NEW AGE AD TRENDS - 2021 NEW AGE AD TRENDS - 2021
NEW AGE AD TRENDS - 2021
 
I-Bytes Technology Industry
I-Bytes Technology IndustryI-Bytes Technology Industry
I-Bytes Technology Industry
 
KPIT Announces Q2 FY14 Results - Registers 44.7% Y-o-Y growth in Net Profits
KPIT Announces Q2 FY14 Results - Registers 44.7% Y-o-Y growth in Net ProfitsKPIT Announces Q2 FY14 Results - Registers 44.7% Y-o-Y growth in Net Profits
KPIT Announces Q2 FY14 Results - Registers 44.7% Y-o-Y growth in Net Profits
 
Sustainability in Telecoms
Sustainability in TelecomsSustainability in Telecoms
Sustainability in Telecoms
 
Kodak annualReport05
Kodak annualReport05Kodak annualReport05
Kodak annualReport05
 
Global Entertainment and Media Outlook 2014-2018
Global Entertainment and Media Outlook 2014-2018Global Entertainment and Media Outlook 2014-2018
Global Entertainment and Media Outlook 2014-2018
 
E+ opportunities & winning strategies
E+ opportunities & winning strategiesE+ opportunities & winning strategies
E+ opportunities & winning strategies
 
Arrowinsight Quarterly: IT Trends
Arrowinsight Quarterly: IT TrendsArrowinsight Quarterly: IT Trends
Arrowinsight Quarterly: IT Trends
 
T Bytes IoT & AR
T Bytes IoT & ART Bytes IoT & AR
T Bytes IoT & AR
 
Consumer Electronics | Daxue Consulting
Consumer Electronics | Daxue ConsultingConsumer Electronics | Daxue Consulting
Consumer Electronics | Daxue Consulting
 
ARC 2008 Annual Report
ARC 2008 Annual ReportARC 2008 Annual Report
ARC 2008 Annual Report
 
Big Telecom Revenue Project prepared by Lance Heaps
Big Telecom Revenue Project prepared by Lance HeapsBig Telecom Revenue Project prepared by Lance Heaps
Big Telecom Revenue Project prepared by Lance Heaps
 

Similar to LEDs Magazine Special Report

Future_of_Lighting-White_Paper_Clarus
Future_of_Lighting-White_Paper_ClarusFuture_of_Lighting-White_Paper_Clarus
Future_of_Lighting-White_Paper_Clarus
Peter Haydon
 
CF-Bag Electronics
CF-Bag ElectronicsCF-Bag Electronics
CF-Bag Electronics
BS Praveen
 
Lighting the Way - Perspectives on the Global Lighting Market (McKinsey 04-Ma...
Lighting the Way - Perspectives on the Global Lighting Market (McKinsey 04-Ma...Lighting the Way - Perspectives on the Global Lighting Market (McKinsey 04-Ma...
Lighting the Way - Perspectives on the Global Lighting Market (McKinsey 04-Ma...
Patrick Smith
 
smart lighting & control market
smart lighting & control marketsmart lighting & control market
smart lighting & control market
BIS Research Inc.
 
Mocvdledmarketoutlook 100715010717 Phpapp02
Mocvdledmarketoutlook 100715010717 Phpapp02Mocvdledmarketoutlook 100715010717 Phpapp02
Mocvdledmarketoutlook 100715010717 Phpapp02
Bigmamagrubb
 
Andrews Annual Report
Andrews Annual ReportAndrews Annual Report
Andrews Annual Report
Paul Crane
 

Similar to LEDs Magazine Special Report (20)

Future_of_Lighting-White_Paper_Clarus
Future_of_Lighting-White_Paper_ClarusFuture_of_Lighting-White_Paper_Clarus
Future_of_Lighting-White_Paper_Clarus
 
Leds lightning the market for investors
Leds lightning the market for investorsLeds lightning the market for investors
Leds lightning the market for investors
 
BGL Building Products Research Report - LED Lighting the Way
BGL Building Products Research Report - LED Lighting the WayBGL Building Products Research Report - LED Lighting the Way
BGL Building Products Research Report - LED Lighting the Way
 
CF-Bag Electronics
CF-Bag ElectronicsCF-Bag Electronics
CF-Bag Electronics
 
Lighting the way perspectives on global lighting market 2011
Lighting the way perspectives on global lighting market 2011Lighting the way perspectives on global lighting market 2011
Lighting the way perspectives on global lighting market 2011
 
Lighting the Way - Perspectives on the Global Lighting Market (McKinsey 04-Ma...
Lighting the Way - Perspectives on the Global Lighting Market (McKinsey 04-Ma...Lighting the Way - Perspectives on the Global Lighting Market (McKinsey 04-Ma...
Lighting the Way - Perspectives on the Global Lighting Market (McKinsey 04-Ma...
 
Article - News from the Chinese lighting industry 2019
Article - News from the Chinese lighting industry 2019Article - News from the Chinese lighting industry 2019
Article - News from the Chinese lighting industry 2019
 
smart lighting & control market
smart lighting & control marketsmart lighting & control market
smart lighting & control market
 
Smart Lighting Market Research : A Global Analysis
Smart Lighting Market Research : A Global AnalysisSmart Lighting Market Research : A Global Analysis
Smart Lighting Market Research : A Global Analysis
 
Mocvdledmarketoutlook 100715010717 Phpapp02
Mocvdledmarketoutlook 100715010717 Phpapp02Mocvdledmarketoutlook 100715010717 Phpapp02
Mocvdledmarketoutlook 100715010717 Phpapp02
 
Andrews Annual Report
Andrews Annual ReportAndrews Annual Report
Andrews Annual Report
 
Oled and led lighting scenarios sep 2011 HCL
Oled and led lighting scenarios sep 2011 HCLOled and led lighting scenarios sep 2011 HCL
Oled and led lighting scenarios sep 2011 HCL
 
Global led lamp market trends, competitive analysis, research report 2024
Global led lamp market trends, competitive analysis, research report 2024Global led lamp market trends, competitive analysis, research report 2024
Global led lamp market trends, competitive analysis, research report 2024
 
Global led lamp market trends, competitive analysis, research report 2024
Global led lamp market trends, competitive analysis, research report 2024Global led lamp market trends, competitive analysis, research report 2024
Global led lamp market trends, competitive analysis, research report 2024
 
Forecast of Global Power Distribution Units (PDU) Market 2024
Forecast of Global Power Distribution Units (PDU) Market 2024Forecast of Global Power Distribution Units (PDU) Market 2024
Forecast of Global Power Distribution Units (PDU) Market 2024
 
Onword to 2020
Onword to 2020Onword to 2020
Onword to 2020
 
Optical Coating Market Global Trends & Forecasts
Optical Coating Market Global Trends & ForecastsOptical Coating Market Global Trends & Forecasts
Optical Coating Market Global Trends & Forecasts
 
Global led strip market research report 2017
Global led strip market research report 2017Global led strip market research report 2017
Global led strip market research report 2017
 
Lighting the way perspectives on global lighting market 2012
Lighting the way perspectives on global lighting market 2012Lighting the way perspectives on global lighting market 2012
Lighting the way perspectives on global lighting market 2012
 
Power Packaging Technology Trends and Market Expectations
Power Packaging Technology Trends and Market ExpectationsPower Packaging Technology Trends and Market Expectations
Power Packaging Technology Trends and Market Expectations
 

LEDs Magazine Special Report

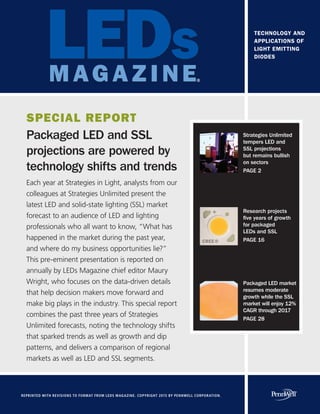
  • 1. SPECIAL REPORT Packaged LED and SSL projections are powered by technology shifts and trends Each year at Strategies in Light, analysts from our colleagues at Strategies Unlimited present the latest LED and solid-state lighting (SSL) market forecast to an audience of LED and lighting professionals who all want to know, “What has happened in the market during the past year, and where do my business opportunities lie?” This pre-eminent presentation is reported on annually by LEDs Magazine chief editor Maury Wright, who focuses on the data-driven details that help decision makers move forward and make big plays in the industry. This special report combines the past three years of Strategies Unlimited forecasts, noting the technology shifts that sparked trends as well as growth and dip patterns, and delivers a comparison of regional markets as well as LED and SSL segments. REPRINTED WITH REVISIONS TO FORMAT FROM LEDS MAGAZINE. COPYRIGHT 2015 BY PENNWELL CORPORATION. TECHNOLOGY AND APPLICATIONS OF LIGHT EMITTING DIODES Packaged LED market resumes moderate growth while the SSL market will enjoy 12% CAGR through 2017 PAGE 28 Research projects five years of growth for packaged LEDs and SSL PAGE 16 Strategies Unlimited tempers LED and SSL projections but remains bullish on sectors PAGE 2
  • 2. 2 LEDS Magazine SPECIAL REPORT ORIGINALLY PUBLISHED APRIL 23, 2015 Strategies Unlimited tempers LED and SSL projections but remains bullish on sectors Analysts led off the Plenary Session on each day of Strategies in Light, reports MAURY WRIGHT, with growth projections for both packaged LEDs and lighting products slightly lowered relative to the 2014 presentations. THE STRATEGIES IN Light (SIL) 2015 conference, held Feb. 24-26 in Las Vegas, NV, featured Plenary Sessions anchored by Strategies Unlimited market-research presentations on each of the two main-conference days. Senior analyst Stephanie Pruitt reported that packaged LED revenue hit $15.4B (billion) in 2014 and projected growth to $22.1B in 2019. Philip Smallwood, co-chair of SIL and director of research at Strategies Unlimited, reported that LEDs penetrated 5% of the lamps market in 2014 and projected 52% penetration by 2022 based on units shipped. Smallwood reported LED penetration in luminaires at 33% in 2014 and projected 69% penetration by 2022. Generally, the market projections were positive, but growth rates in terms of revenue were slightly down from the 2014 data. We will discuss the new data in detail including reasons for changes that range from packaged LED prices dropping faster than expected to new methods of modeling the lighting market that have been instigated by Smallwood in the research program. Packaged LEDs The packaged LED presentation is directly comparable to the data presented last year as the methodology remained consistent in the component area. Still, there is one caveat. Pruitt presented preliminary data. The actual data will not be finalized
  • 3. Strategies Unlimited tempers LED and SSL projections but remains bullish on sectors 3 LEDs Magazine SPECIAL REPORT until April when the report is due for sale (after this article was written). So beware of some changes, although we’d expect them to be minor. Pruitt took the stage on day two of SIL (Fig. 1) and compared data in the most recent years. In 2014, Strategies Unlimited projected a 13% compound annual growth rate (CAGR) for LED revenue through 2018. Pruitt said the new data suggests an 8% CAGR through 2019. The lower growth, however, is not in any way indicative of the research team expecting fewer LEDs to be sold. But LED component prices are eroding faster than expected. Moreover, parts of the LED forecast are driven by research on the lighting market, and Pruitt said the new forecast is “more conservative than last year due to lighting research”–in part the new models mentioned earlier. Indeed, we can already see slower growth in revenue numbers reported for 2014. Pruitt said LED revenue grew from $14.5B in 2013 to $15.4B in 2014. That’s far lower than the 13% projection from last year. In fact, the 6% growth from 2013 even lags behind the new projection going out to 2019. But before we delve into more details, let’s discuss the methodology of the packaged LED research. As with previous years, the scope includes all packaged LEDs but not bare LED die or chips. It certainly does include package-light LEDs such as products based on chip-scale packages (CSPs). We covered the CSP trend in our report from the Light+Building event in Frankfurt last year, and there is much more in our conference keynote coverage in this issue. FIG. 1. Senior Strategies Unlimited analyst Stephanie Pruitt presented the research firm’s latest data on the packaged LED market.
  • 4. Strategies Unlimited tempers LED and SSL projections but remains bullish on sectors 4 LEDs Magazine SPECIAL REPORT The research is focused on revenue and not number of LEDs shipped or sold. The report covers products ranging from very-low-cost, low- and mid-power LEDs to the high-power LEDs that have been most prominently used in lighting until recently when mid-power LEDs entered that space. The scope also includes super-high- power LEDs, primarily chip-on-board (COB) products. Strategies Unlimited now also publishes dedicated COB LED research. The segmentation of the packaged LED market also remains largely consistent with prior years. The 0.5W dividing line between the mid- and high-power segments remains. But that line may create ambiguity in some of the data where applications are dissected relative to the types of LEDs used. Many LEDs that look like traditional mid-power devices in plastic packages with no secondary optics can be driven at levels of 1W and higher today. Application segments The projected 8% CAGR through 2019 will lead to a packaged LED segment that totals $22.1B. Let’s look at the applications that will drive such growth and the near- and long-term prospects and trends for each. The primary application segments include: • Displays/backlights • Mobile • Signs • Automotive • Lighting Fig. 2 depicts the segments and the recent growth or decline in each segment from 2013 to 2014. As you might expect, lighting will remain the largest growth segment for the foreseeable future. Two years ago, Strategies Unlimited reported that general lighting had become the largest consumer of LEDs by revenue. Previously, the display- backlight sector had consumed more LEDs by revenue. Still, all of the applications listed above consume copious amounts of packaged LEDs.
  • 5. Strategies Unlimited tempers LED and SSL projections but remains bullish on sectors 5 LEDs Magazine SPECIAL REPORT Display backlights Indeed, the display-backlight market for TVs and computer monitors remains robust and likely consumes more individual LED components that any other application. But the LEDs utilized are generally low- or mid-power LEDs and are among the most- commoditized products in the packaged LED space. In terms of revenue, the display sector is already in decline from $2.6B in 2014, as detailed in Fig. 3, with a -5% CAGR projected through 2019. The display sector will not suffer from the same type of saturation as the lighting sector that we will discuss later. Now the backlight segment is fully saturated, but consumers continue to buy new and better TVs or monitors. Still, LEDs used in displays will continue to fall in price. At the same time LEDs get brighter, resulting in fewer LEDs being required per display in some cases. Packaged LED revenues ($B) LED industry grew 6% from 2013 to 2014 0 1 2 3 4 5 6 Lighting Automotive lighting Signage Mobile devices Backlight in displays & monitors Others 2014 2013 $14.6B 2014 $15.4B 2013 15% 10% 10% -8.7% -0.4% 8% 0.0 0.5 1.0 1.5 2.0 2.5 3.0 Video walls Monitors TVs 2019201820172016201520142013 LED revenues for TVs/monitors/displays ($B) Others Mobile phones Mobile computing devices 2019201820172016201520142013 0.0 0.5 1.0 1.5 2.0 2.5 3.0 3.5 Revenues for LEDs in mobile devices ($B) FIG. 4. LED revenue related to mobile devices is declining with falling LED prices. FIG. 3. The display-backlight market for LEDs is in decline but is still significant. FIG. 2. The packaged LED market grew by $800M from 2013 to 2014 with lighting applications leading the charge.
  • 6. Strategies Unlimited tempers LED and SSL projections but remains bullish on sectors 6 LEDs Magazine SPECIAL REPORT Pruitt noted, however, that technology innovation in the TV space could significantly impact the projection. Specifically, a larger-than-expected transition to 4k-pixel TVs, sometimes called ultrahigh-definition TVs (UHDTV), could result in more LEDs being sold into the application. Such higher-end TVs would almost assuredly rely on local-dimming implementations where individual LEDs light a smaller area of the overall screen to provide optimum contrast ratio. Conversely, were an OLED manufacturer to solve the manufacturing issues with large screens, allowing that technology to drop in price, fewer LEDs might be sold into backlighting. Mobile devices Moving to LED revenue in mobile devices, we find yet another application in decline. Fig. 4 depicts the details of the -5% CAGR projected by Pruitt through 2019. Still, the raw numbers are impressive. Mobile devices consumed $2.8B worth of LEDs in 2014 and the projection calls for around $2.1B in 2019. The reasons for the decline in mobile are in part similar to the decline in displays, but OLED technology plays a larger role. The mobile market is nearly saturated, but the upgrade cycle continues to drive the sale of new devices. However, price erosion is heavy in the LEDs used in mobile devices for backlighting or lighting the keypad. Moreover, OLED technology is already being used broadly by vendors such as Samsung in smartphones. LED revenue specifically for the phone market will go from $1.3B in 2014 to less than $1B in 2019. Declines in tablets and other mobile computing devices will be shallower. Last year, we reported that expanded camera functionality in mobile devices was driving the need for more and higher-quality LEDs for both forward- and rear- facing camera-flash functionality. Indeed, we covered that technology trend in our report on the conference sessions at SIL 2014. Pruitt did not address the flash sub-
  • 7. Strategies Unlimited tempers LED and SSL projections but remains bullish on sectors 7 LEDs Magazine SPECIAL REPORT segment in her SIL presentation, but that data will likely be included in the final LED market report due in April. Pruitt also suggested that as with the display market, a transition to higher-resolution screens in mobile devices could positively impact the revenue for LEDs in the mobile segment. There will be some level of penetration of UHDTV technology even in the smaller devices as screen technology continues to improve. Automotive and signage Moving to areas of growth, automotive is probably the packaged-LED application with the greatest growth potential outside of general lighting. As Fig. 2 indicates, the sector experienced 10% growth between 2013 and 2014. Moreover, Pruitt projects 10% CAGR through 2019 as depicted in Fig. 5, with revenue going from $1.8B in 2014 to $2.9B in 2019. 0.0 0.5 1.0 1.5 2.0 2.5 3.0 Exterior lighting Interior lighting 2019201820172016201520142013 Revenues for LEDs in automotive lighting ($B) 15% CAGR Others 24% Others 37% Front turn 4% Front turn 5% Stop/tail 13% Stop/tail 10% Headlamps 42% Headlamps 22% DRL 17% DRL 26% Automotive exterior revenues 20192014 2014 Revenues for LEDs in lighting $5.3B Other Residential Outdoor Industrial Commercial Replacement lamps FIG. 7. Lighting, and specifically general illumination, holds the greatest revenue potential for packaged LEDs. In 2014, general illumination accounted for 75% of the lighting market. FIG. 6. Exterior applications, especially in headlamps, will drive the growth of LED revenue in automotive. FIG. 5. The interior sub-segment of LED usage in automotive is saturated, but great growth potential awaits on the exterior.
  • 8. Strategies Unlimited tempers LED and SSL projections but remains bullish on sectors 8 LEDs Magazine SPECIAL REPORT The automotive application includes both exterior and interior lighting. The dashboard sub-segment of interior automotive lighting is fully saturated. We will see more in-cabin use of LEDs for ambience including color-tunable lighting products. We covered an Osram Opto Semiconductors product designed for just such applications more than a year ago. But the LEDs used in automotive interiors will mostly be commodity products and falling component prices will keep interior revenue relatively flat. The exterior automotive application, however, still has a lot of room to grow with penetration remaining relatively low in headlamps. Moreover, the value proposition is twofold. Automakers will adopt LEDs for headlamps in mainstream cars to leverage the low power and long life inherent in LEDs. High-end vehicles will carry LED headlamps with functionality such as steered beams that can’t be realized with legacy sources. Fig. 6 shows that LED revenue is projected to grow by 15% through 2019 in the exterior sub-segment with LED revenue in just that sub-segment exceeding $2B by 2019. The biggest growth will come in headlamps with that specific application consuming nearly $1B by 2019. Stop- and tail-light revenue will be the other high- growth area as automobile manufacturers add functionality in that application. Signage is yet another LED application that is projected to grow. Pruitt reported that LED revenue in the application totaled $1.7B in 2014. Projection of an 11% CAGR will take the market to $2.9B in 2019. General illumination Lighting–specifically general illumination–however, will provide the real lift in LED revenue for the next five years. LED revenue in the lighting application totaled $5.3B in 2014 with 75% of that total dedicated to general illumination (Fig. 7). Retrofit lamps account for nearly half of the 2014 LED revenue in lighting. Pruitt projects a 14% CAGR through 2019, consuming more than $10B in LEDs for lighting.
  • 9. Strategies Unlimited tempers LED and SSL projections but remains bullish on sectors 9 LEDs Magazine SPECIAL REPORT Fig. 8 provides more details on the projection with general illumination accounting for 86% of the LED revenue by 2019. At the end of the projection, LED revenue for replacement lamps will grow to $6.6B with that application remaining well over half of the lighting consumption base. The other or non-general- illumination segment is the next largest in aggregate at $1.5B in 2019. That category, however, comprises a wide variety of small sub-segments including entertainment, architectural, retail display, consumer portable, safety and security, off-grid, and strip and string lighting. Outdoor is the second largest general- illumination sub-segment today and in 2019 growing to consume $815M (million) in LEDs. LED types in lighting Pruitt dug deeper into the LED market data relative to lighting applications. For example, Fig. 9 breaks down the total lighting application by types of LEDs used FIG. 10. All classes of power LEDs will see growth in replacement lamps. FIG. 9. The high-power LED segment will decline as a percentage of the total revenues of all LED classes. FIG. 8. The Strategies Unlimited forecast states that 86% of the lighting market will be general illumination in 2019, and replacement lamps are expected to be the top consumer of LEDs by a wide margin. Revenues for LEDs in lighting ($B) 0 2 4 6 8 10 12 Replacement lamps Commercial Industrial Outdoor Residential Other ’19’18’17’16’15’14’13 14% CAGR $5.3B $10.2B Low power (<0.1W) Mid power (0.1W – 0.5W) High power (>0.5W – <5W) Super-high power (>5W) RGB Percentage of revenues for LEDs in lighting 0 20 40 60 80 100 2019201820172016201520142013 0 1 2 3 4 5 6 7 Super-high power High power Mid power Low power 2019201820172016201520142013 Revenues for LEDs in replacement lamps ($B) 20% CAGR
  • 10. Strategies Unlimited tempers LED and SSL projections but remains bullish on sectors 10 LEDs Magazine SPECIAL REPORT through the five-year forecast. The details rely on the aforementioned categorization of LEDs by power rating. At first glance, the data is surprising. We’ve been hearing for several years about the rise of mid-power LEDs in a greater number of lighting applications. But the forecast projects that the mid-power share remains near-constant as a percentage of the total market. Still, the escalating overall market will take mid-power revenue from $1B in 2014 to $1.8B in 2019. But why doesn’t mid-power represent a bigger share percentage-wise? The answer is that many LEDs that are based on typical mid- power technology platforms operate well in excess of 0.5W today and are actually captured in the high-power segment. Despite the inclusion of some super-charged mid-power LEDs in the high-power category, that high-power segment will decline as a percentage of the total, as you can see in the chart. The super-high-power category composed primarily of COB LEDs will enjoy the biggest gains percentage-wise. That gain is due to a couple of primary factors. Price erosion is much lower in both high- and super-high-power LEDs relative to low- and mid-power LEDs. And COBs are much simpler for many lighting manufacturers to work with given that the LEDs have a single electrical interface and can be more simply mounted in a design. Moreover, optics manufacturers have made great progress in lenses for the relatively-larger COB LEDs, as was evident in a recent feature article on optics. FIG. 12. LED revenue will continue to ramp in outdoor applications with the most growth coming in chip-on-board (COB) LEDs. FIG. 11. Mid-power LEDs will do especially well in commercial luminaires and specifically the troffer application. Revenues for LEDs in commercial luminaires ($M) 0 100 200 300 400 500 Super-high power High power Mid power Low power ’19’18’17’16’15’14’13 14% CAGR 0 200 400 600 800 1000 ’19’18’17’16’15’14’13 Revenues for LEDs in outdoor luminaires ($M) Super-high power High power 12% CAGR
  • 11. Strategies Unlimited tempers LED and SSL projections but remains bullish on sectors 11 LEDs Magazine SPECIAL REPORT In her SIL presentation, Pruitt also characterized types of LEDs used in specific applications, and a couple are of particular interest. Fig. 10 depicts the LED segments relative to replacement lamps, including A-lamps, directional lamps, and tubes. Arguably, replacement lamps are the most cost-sensitive portion of the general illumination market. Yet in terms of percentage of the LED market, high- power LEDs will remain predominant in the application. Moreover, COB revenue will grow at a higher rate than either the commodity mid- or low-power LEDs. Mid-power LEDs will make the greatest gains in the commercial sector, as documented by Fig. 11. Ceiling troffers are widely used in the commercial sector. And LED-based luminaires that are focused on the traditional rectilinear troffer form factors are a good match to mid-power LEDs. The LEDs are applied in a linear fashion with the components closely spaced for even illumination. The outdoor segment is one where COBs will really shine, according to Pruitt’s forecast. Fig. 12 shows high-power LED usage remaining relatively flat in outdoor applications while COBs ramp considerably. We’d speculate that the improved COB optics mentioned earlier will be a driver for the success of COBs in outdoor applications. In the past, luminaires that used COB LEDs relied on reflector-based designs for beam control. The new lenses can enable far superior beam control that had been only achievable with smaller sources. Lighting market data Now let’s transition to an examination of market data centered on lighting products presented in the Plenary by Smallwood on day one of SIL (Fig. 13). The presentation was entitled “How big can the LED lighting market get?” Smallwood addressed both the lamps and luminaires markets. Smallwood moved into a leadership position in the Strategies Unlimited lighting practice in late 2013. He has since revamped the approach that the firm takes to characterize the lighting market. The research has been expanded to cover lighting
  • 12. Strategies Unlimited tempers LED and SSL projections but remains bullish on sectors 12 LEDs Magazine SPECIAL REPORT products based on all types of light sources–not just LED-based products. The data is segmented for form factors and applications. And Smallwood has led development of a market model that can yield regional geographical segmentation of the market. Smallwood also said the new approach will enable more accurate prediction of saturation by long-life, LED-based products and the coincident shrinking of market potential. Starting with the lamps market, Smallwood said there are around 45B installed lamp sockets in the world with that number only growing incrementally in the coming years (Fig. 14). Today, 9B incandescent products are installed in those sockets with that number projected to fall to less than 2B by 2022. Smallwood’s projection shows that linear fluorescent and compact fluorescent (CFL) technologies will remain prevalent through 2022. Primarily, LED-based replacement lamps will replace the incandescent incumbent with some displacement of fluorescent and halogen technologies. Recognize, however, that there is a vast difference between the installed base and shipments of lamps throughout the forecast period; Strategies Unlimited’s new model allows the analysts to report both, and by region or globally. For example, Fig. 15 depicts the difference in the North America region specific to A-lamps. The installed base chart on the left of Fig. 15 shows a strong presence of incandescent products, whereas shipments of such products will drop precipitously as LED lamp shipments continue to rise. FIG. 13. Philip Smallwood of Strategies Unlimited presented lamp and luminaire market research at Strategies in Light.
  • 13. Strategies Unlimited tempers LED and SSL projections but remains bullish on sectors 13 LEDs Magazine SPECIAL REPORT Smallwood reported that LED lamps represented 5% of the overall 2014 market globally. He projects that penetration to rise to 28% in 2018 and to 52% in 2022. Those numbers may sound low, but remember the total lamp market includes tubes, and fluorescent technology will remain a major player. Indeed, Smallwood projects that fluorescent tubes will still account for more than 20% of lamp shipments in 2022. Ironically, Smallwood also reported a very bullish outlook for LED-based replacement tubes as he broke the data down by type of lamp. Smallwood admitted that he never believed the concept of an LED-based replacement tube to be a very good idea relative to products such as integral, LED- based luminaires. But the research indicates that the market will heavily rely on such tube products primarily because of the ease of retrofit. Smallwood projects a 29% CAGR for tube shipments through 2022, although the growth will flatten at the end of that period as sockets are saturated. FIG. 14. The global installed base of lamps will remain a mix in terms of light-source technology through 2022. FIG. 15. The installed base of incandescent A-lamps in North America will decline slowly, whereas new shipments of such products have already plummeted as LED-lamp shipments rise. Incandescent LED replacement Halogen Fluorescent CFL Global lamp installed base (billions of units) 0 10 20 30 40 50 Incandescent units 2014 = 9B 2022 = <2B ’22’21’20’19’18’17’16’15’14 NA residential installed base of A-lamps (billions of units) A-lamp shipments (millions of units) 0 1 2 3 4 5 ’22’21’20’19’18’17’16’15’14 ’22’21’20’19’18’17’16’15 900 800 700 600 500 400 300 200 100 0 LED replacement Incandescent Halogen CFL
  • 14. Strategies Unlimited tempers LED and SSL projections but remains bullish on sectors 14 LEDs Magazine SPECIAL REPORT Overall saturation will be felt far more acutely. Total lamp shipments will decline by 44% through 2022. Other than the tube market, all of the other lamp types will be in decline in terms of units shipped by the end of this decade. Still, the lamp market will remain sizeable in terms of revenue. Fig. 16 shows the lamp market charted by revenue and segmented by light-source technology. Revenue will peak at $21B in 2018 but still reach a hefty $16B value in 2022. Smallwood also covered the luminaires space. And the Strategies Unlimited team has developed a far more granular model for the broad luminaires segment. The team is now segmenting the market by different types of fixtures including: • Downlights • Troffers • High bays • Suspended pendants • Tracklights • Street lights Moreover, the new model includes the ability to sort the data by application including retail, office, hospitality, and more. The two types of segmentation can be applied individually or together. And in terms of LED-based fixtures, Strategies Unlimited is separately tracking fixtures that use LED-based replacement lamps and fixtures based on integral, LED-based designs. In 2014, the combination of both types of LED fixtures represented less than 4% of the total luminaire market in terms of the installed base. But again installed base and shipments differ. Fig. 17 provides an excellent picture of both market size and the light-source technologies that will ship in luminaires. Luminaire revenue will only ramp from $59B in 2014 to $66B in 2022. But as mentioned at the beginning of the article, 69% of the luminaires will be LED-based in 2022.
  • 15. Strategies Unlimited tempers LED and SSL projections but remains bullish on sectors 15 LEDs Magazine SPECIAL REPORT Smallwood closed his presentation with some interesting thoughts. He said, “The lighting world has accepted that LEDs are the future.” Still, he characterized the transition as an evolution from the filament to LED sources. He added, however, that there is a revolution afoot in addition to the changing light sources. Smallwood said, “The revolution is the ancillary products and technologies such as networks and controls that are coming along with LED lighting.” Smart lighting based on sensor-driven autonomous or programmatic controls is a good example. Smallwood also suggested that the revolution will deliver “lighting with a purpose.” He said lighting will specifically target needs such as human wellbeing, productivity, security, and safety. Smallwood asked the audience, “Would you ever have thought Cisco would present a keynote at Strategies in Light?” Indeed, that company did. FIG. 17. The global luminaire market will grow slowly through 2022, but LED-based products will represent an increasingly large share of that revenue. FIG. 16. Global lamp revenue will peak in about four years as socket saturation with long-life LED- based products takes place. Global lamp revenue ($B) 0 5 10 15 20 25 ’22’21’20’19’18’17’16’15’14 LED replacement $18B $21B $16B Incandescent Halogen Fluorescent CFL Global luminaire market forecast LED replacement LED integrated Incandescent HID Halogen Fluorescent CFL 2022 $66B2017 $64B2014 $59B
  • 16. 16 LEDS Magazine SPECIAL REPORT ORIGINALLY PUBLISHED APRIL 22, 2014 Research projects five years of growth for packaged LEDs and SSL Bracketing the keynote presentations at Strategies in Light, Strategies Unlimited analysts reported positive developments in the LED component and lighting markets, reports MAURY WRIGHT, with both projected at double-digit growth through 2018. THE PLENARY SESSION at the Strategies in Light (SIL) 2014 conference held February 25–27 in Santa Clara, California again featured analysts from Strategies Unlimited presenting their most recent research on the packaged LED component and LED-based general lighting markets. Packaged LED revenue was reported at $14.4B (billion) for 2013 with projection that the total will reach $25.9B in 2018. The general lighting market will grow even more steeply. The SIL presentation focused on LED replacement lamps, with that segment alone generating $4.8B in 2013 and projected to reach $12.2B in 2018. In both cases, the revenue growth will come amongst price decreases with the next five years being an exciting time in the maturing solid-state lighting (SSL) space. FIG. 1. Cree announced the CXA1310 (pictured), CXA1850, and CXA2590 COB LED arrays leading up to Strategies in Light.
  • 17. Research projects five years of growth for packaged LEDs and SSL 17 LEDs Magazine SPECIAL REPORT The LED research was focused on packaged components, as it has been in the past. It does not include the sale of bare die. It also excludes products such as infrared (IR) and ultraviolet (UV) LEDs that are sold into industrial, security, and other applications. The LED research does include chip-on-board (COB) LEDs such as the recently announced Cree CXA1310 pictured in Fig. 1. Analyst Katya Evstratyeva made the point during her presentation that the line between such COB LEDs and other light engine or modular products is blurring. Indeed, many companies use the COB term to describe larger light engines based on printed circuit boards in a variety of form factors. Conversely, some modules look more like a COB LED than a module, such as the new Xicato XTM module. Evstratyeva said that the research firm is planning a report to address the modules and light engine space. The universe of manufacturers of modular products will be significantly broader than that of packaged LEDs, and that research will surely be of interest. LEDs by regions Diving into the packaged LED revenue research, Evstratyeva first broke down the revenue by region and compared 2012 and 2013 data (Fig. 2). There was modest 7% growth in 2013, although as we mentioned previously the ramp will be steeper — projected at 13% CAGR (compound annual growth rate) — going forward. Companies based in Japan remain responsible for the largest sum of global LED revenue. Certainly, market leader Nichia is in part responsible for that country’s position, although Strategies Unlimited FIG. 2. Packaged LED revenue grew 7% in 2013 with Japan remaining in the top spot in revenue production. Source: Strategies Unlimited 2012 Industry revenues $13.3 B 2013 Industry revenues $14.397 B Taiwan/ SE Asia 16% Taiwan/ SE Asia 14% USA 13% USA 12% Europe 8% Europe 8% China 10% China 8% Japan 27%Japan 32% Korea 27% Korea 26%
  • 18. Research projects five years of growth for packaged LEDs and SSL 18 LEDs Magazine SPECIAL REPORT tracks the five largest LED makers in Japan. The analysts also track five companies in Korea that in aggregate earn the second highest revenues. Outside of Japan and Korea, however, the story is far more interesting. In the US, for instance, the revenue is generated by only three companies and in Europe only one is tracked. In contrast, Strategies Unlimited tracks 13 companies in Taiwan and nine in China. Those numbers are indicative of the upstarts attempting to win space in what is already a crowded market. Application segments Now let’s discuss the application segments for packaged LEDs. The Strategies Unlimited team has long broken the market into five segments plus a catchall other category: • Backlights for displays, monitors, and TVs • Mobile devices • Automotive lighting • Signage • General lighting • Other Fig. 3 depicts these market segments and the contribution of LED revenue that is attributable to each segment. Clearly, the general lighting segment will drive the LED component market going forward. Indeed, general lighting displaced backlighting as the growth driver, as we reported in our SIL coverage last year. Still, all of the segments are significant and worth further discussion. FIG. 3. Packaged LED revenue growth segment by application projected through 2018. Revenues (US$B) $14.4B $25.9B CAGR 13% 0 5 10 15 20 25 30 ’12 ’13 ’14 ’15 ’16 ’17 ’18 Others Lighting Signage Automotive lighting Mobile devices Backlight in displays and monitors
  • 19. Research projects five years of growth for packaged LEDs and SSL 19 LEDs Magazine SPECIAL REPORT Given that backlighting has been such a significant market, let’s begin in that application. Strategies Unlimited is projecting in a decline in the segment at a 7.74% CAGR from 2013 to 2018. There are several factors that are combining to portend the decline. First of all, the application segment is virtually fully saturated with a transition to LED backlights at this point. Second, brighter LED components mean that in many cases fewer LEDs will be needed to backlight a screen. Third, the price drop in LED components has been especially acute in the mid- and low-power LED space and those are the predominant LEDs used in the application. Fig. 4 details the backlight segment. The peak in the 2011 to 2012 timeframe came as there were still legacy fluorescent-based backlights in use and more potential for market share gains for LEDs. Still, the projected $1.7B in 2018 is a very significant market. Mobile applications Moving to mobile, Strategies Unlimited primarily focuses on mobile phones, including smartphones, and tablets. The mobile sector is projected in a more moderate 2.36% decline (Fig. 5). As with the backlight segment, lower LED prices and brighter components are part of the story. FIG. 4. LED revenue in the backlight application will decline going forward, driven by lower component prices and brighter LEDs. Revenues (US$B) 0.5 0.0 1.0 1.5 2.0 2.5 3.0 ’10 ’11 ’12 ’13 ’14 ’15 ’16 ’17 ’18 Monitors Video walls TVs $2.6B $1.7B CAGR -7.74% FIG. 5. The mobile segment is in a gradual decline in terms of LED revenue, although the camera flash sub-segment lessened the impact of lower-cost LEDs. Revenues (US$B) 0.5 0.0 1.0 1.5 2.0 2.5 3.0 3.5 ’10 ’11 ’12 ’13 ’14 ’15 ’16 ’17 ’18 Others Mobile computing devices Mobile phone revenues $2.6B $2.3B CAGR -2.36%
  • 20. Research projects five years of growth for packaged LEDs and SSL 20 LEDs Magazine SPECIAL REPORT There are market dynamics, however, that have made the revenue decline for mobile more shallow than for backlight. In many cases, mobile devices have displaced dedicated digital cameras as the primary camera used by consumers. Higher pixel counts in image sensors and lower cost have enabled better cameras in mobile devices. And now the market is demanding better LED-based flash for cameras. We discuss the trend in the companion story on the SIL conference. In many cases, mobile device makers are including an LED-based flash on both the forward- and rear-facing cameras in mobile devices. Evstratyeva said LED revenue sold into flash applications is in the $700M (million) range in 2013. Moreover, she said that sub-segment will continue to rise in revenue through 2018, albeit not at a rate that will eliminate the aggregate projected decline. Automotive lighting Now we will transition into growth segments including automotive lighting and signage. There are a number of factors that will keep LED revenue on the rise in the automotive segment. For starters, the market is far from saturated. LED exterior lighting including headlamps has been primarily limited to luxury-level vehicles. But that situation is changing. Evstratyeva noted that Toyota is moving to LED-based headlamps on its Corolla model, which is a smaller economy vehicle. LED headlamps are also moving beyond stylish cars. Ford recently announced that its best-selling F-150 light-duty truck will get LED headlamps across the model. Ford noted that the durability of LED lighting technology was a good match to the work truck market. Indeed, the company said it fired stones at the headlamp unit in tests. But the FIG. 6. The automotive segment for LED lighting is far from saturated and is expected to deliver growth in terms of LED revenue. Revenues (US$B) 0.5 0.0 1.0 1.5 2.0 2.5 ’12 ’13 ’14 ’15 ’16 ’17 ’18 $1.4B $2.3BCAGR 10.16% Exterior lighting Interior lighting
  • 21. Research projects five years of growth for packaged LEDs and SSL 21 LEDs Magazine SPECIAL REPORT company also noted a styling angle and the LED-lit light guide implemented around the perimeter of the unit that the company said will offer a signature look. Fig. 6 details the interior and exterior sub-segments of the automotive market. The exterior segment will remain the larger of the two, primarily because of the number of different ways that LEDs are used in headlamps, turn signals, brake lights, and other functions. Still, Evstratyeva pointed out the in-cabin potential. She said auto makers are increasingly using LED lighting with features such as color tunability to add styling inside the cabin and to help drive sales. Signage is also a growth market that totaled $1.8B in LED revenue in 2013 with growth projected to $2.4B in 2018 (Fig. 7). The bulk of the sign manufacturing is taking place in China, so that region is driving the LED purchases. The sign market itself will grow from $4.7B in 2013 to $6.1B in 2018 and that would indicate a market that is far from saturation. General lighting And now let’s get to general lighting and the largest market for LEDs going forward. Here we will look at both LED revenue trends and at lighting revenues. Moreover, we will consider the types of LEDs being used in general lighting and how specific LED manufacturers are faring in the segment. The chart in Fig. 8 is a complex one that depicts the revenue forecast for packaged LEDs relative to specific sub-segments of the lighting market. While we regularly write about — and presentations at conferences such as SIL support — the premise that LEDs will fundamentally change the lighting market, presumably the bulb FIG. 7. Signage will remain a growing source of LED revenue for the next five years. Revenues (US$B) 0.5 0.0 1.0 1.5 2.0 2.5 ’12 ’13 ’14 ’15 ’16 ’17 ’18 Channel letters and others LED multi-color LED single-color LED full-color CAGR 5.72% $2.4B $1.8B
  • 22. Research projects five years of growth for packaged LEDs and SSL 22 LEDs Magazine SPECIAL REPORT form will begin to disappear in favor of luminaires with integral LEDs or modular SSL engines. And these new luminaires will truly leverage the compact size of LED light sources and the ability to distribute LEDs in arrays to cover large areas. Examples of revolutionary new designs include the planar fixtures based on light guides that are edge lit with LEDs. LEDs may indeed yet revolutionize lighting product design. But Fig. 8 makes it clear that through 2018 the replacement lamp will be the most widely deployed lighting product consuming LEDs. The graph tells an interesting story. Lamps trailed the aggregate luminaire segment in 2013, although the overall lamps LED revenue was an impressive $1.5B. But soon lamps will account for half of the LED revenue for components sold into lighting. Ironically, socket saturation will happen in the lamps space toward the end of the projection window, and once again luminaires will become the larger sub-segment for LED revenues. It is worth noting that the replacement lamps segment includes products sold into both residential and commercial applications. Strategies Unlimited includes LED- based linear tubes in the category, for example, and those products target industrial and commercial applications. Likewise, the MR16 sub-segment is mostly based on business customers whereas A-lamps are more prominent in residential applications. LED lamp market Taking a deeper look at the lamp market, Philip Smallwood, director of research at Strategies Unlimited, addressed the end product market at SIL. He presented the adoption graph depicted in Fig. 9 that pretty much confirms the LED research data FIG. 8. The lighting market will consume the most LEDs by revenue, and the replacement lamps sub- segment will be the largest consumer through 2018. ’13 ’14 ’15 ’16 ’17 ’18 Revenues (US$B) $4.4B $14.9B $0.5B $0.8B $1.4B $2.3B $3.5B $4.3B $1.5B $2.5B $4.0B $5.0B $6.6B $7.3B 0 2 4 6 8 10 12 14 16 Replacement lamps Strips and strings Outdoor area Industrial Architectural Commercial Residential Consumer portable Entertainment Retail display Off-grid Safety/security
  • 23. Research projects five years of growth for packaged LEDs and SSL 23 LEDs Magazine SPECIAL REPORT in Fig. 8, the blue arrow standing for the penetration of LED lamps with regard to the total global installed base. The LED lamp market today is at the earliest stages in terms of technology adoption. Smallwood asserted that we haven’t even reached the early adopter stage at this point. Still, the lamp market has racked up some impressive revenues. In aggregate lamps revenue totaled $4.8B in 2013. Smallwood projected growth to $12.2B in 2018 — a 21% CAGR (Fig. 10). What you may find surprising is that the MR16 segment is the largest segment at the moment and will continue to be so until A-lamps catch up in the 2015 to 2016 timeframe. There are several factors at play in the size of the MR16 sub-segment. For starters, the lamps are primarily deployed in business applications, as mentioned before. And businesses have adopted LED lighting more quickly than residential consumers. There also have been many low-quality MR16 lamps made in China and sold into markets such as Russia. Smallwood said as many as 50M MR16 lamps were sold in Russia in 2013. FIG. 9. In terms of the consumption of LED retrofit lamps, the market is still not at the early adopter stage. Market share (%) Innovators 2.5% Early majority 34% Late majority 34% Laggards 16% Early adopters 13.5% 100 75 50 25 0 FIG. 10. LED replacement lamp revenue is on a steep 21% growth path over the next five years. Revenues (US$B) ’13 ’14’12 ’15 ’16 ’17 ’18 0 2 4 6 8 10 12 14 Reflector MR16 LFT Decorative/other A-19 2013 $4.8B 2018 $12.2B CAGR 21% Revenues (US$B) 0.5 0.0 1.0 1.5 2.0 2.5 3.0 3.5 ’13 ’14’12 ’15 ’16 ’17 ’18 2013 $1.7B 2018 $3.2BCAGR 13% FIG. 11. MR16 LED lamps will be impacted by socket saturation earlier than other sub-segments.
  • 24. Research projects five years of growth for packaged LEDs and SSL 24 LEDs Magazine SPECIAL REPORT The MR16 sub-segment is also instructive of what will happen across the lamps market because it is a year or two in front of the other sub-segments in terms of adoption. Fig. 11 shows that in the 2017–2018 timeframe socket saturation will impact MR16 lamps sales with a decline in revenue inevitable. Conversely, Smallwood projects A-lamp revenue at $5.2B in 2018, exceeding MR16 revenue and still on a growth path at that point. But saturation will happen soon after, and with the long LED lifetime the lamps market will decline considerably. Smallwood said that North America has been consuming 1.1 replacement lamp per year based on legacy incandescent and compact-fluorescent technology. That per- year unit volume will be slashed by LED lifetime. Smallwood also had an interesting outlook on the LED-based tube market, which as Fig. 10 shows is substantial but probably not as large as the participants in that space would hope based on the huge installed base of linear fluorescent lamps around the globe. While many prognosticators, including the US Department of Energy (DOE), have questioned the lighting quality produced by LED tubes, Smallwood based his thoughts on the incumbent technology. He said T8 and T5 fluorescent tubes perform well and the efficiency advantage of LEDs is not significant enough to spur a broad retrofit wave. LED luminaires Let’s briefly consider the state of the LED luminaire market. While comparing lamps and luminaires in terms of packaged LED revenue revealed that lamps were the larger segment, the opposite is true in terms of revenue of the lighting products. Consider Fig. 12. Luminaire revenues totaled $11.7B in 2013 and will grow to $21.3B in five years. Luminaires are simply much more complex products with more expensive subsystems such as driver electronics and housings. And LEDs with dropping component prices represent an increasingly smaller portion of the bill of materials cost for both lamps and luminaires.
  • 25. Research projects five years of growth for packaged LEDs and SSL 25 LEDs Magazine SPECIAL REPORT The luminaire market is predominantly driven by four sub- segments. Architectural or façade lighting outdoors has been an early area of success due to both the energy savings associated with LEDs and dynamic color capabilities. Outdoor street and area lighting is a prime sub-segment because those products burn all night, and energy and maintenance savings are critical. Likewise, the commercial and industrial sub-segments are very focused on energy and maintenance savings and, more recently, the quality of light that LED sources can deliver relative to fluorescent and high-intensity discharge (HID) sources. Success in lighting Having covered the lighting products, let’s return to a final discussion focused on LEDs relative to lighting applications. First, we will look at how well the LED manufacturers are penetrating the general lighting market. Strategies Unlimited does not break such data out per individual LED manufacturers, but we can make some inferences based on Fig. 13, and the discussion we had based around Fig. 2 and the number of LED makers that Strategies Unlimited tracks in each region. In perhaps a surprising fact, Evstratyeva reported that LED makers in the US accounted for the majority of the LED revenue sold into lighting in 2013. The bulk of that revenue is surely attributable to Cree. While the company is only the sixth-largest LED supplier based on revenue for FIG. 12. LED luminaire revenue is much higher than lamps due to the complexity of the products. ’13 ’14’12 ’15 ’16 ’17 ’18 Revenues (US$B) 0 5 10 15 20 25 Emergency Outdoor Industrial Architectural Commercial Residential Consumer portable Entertainment Retail display Off-grid 2013 $11.7B 2018 $21.3B CAGR 12.3% US$4.47B Japan 21% Korea 15% China 11% Taiwan 18% USA 31% Europe 4% FIG. 13. US LED suppliers are leading the way in the lighting application.
  • 26. Research projects five years of growth for packaged LEDs and SSL 26 LEDs Magazine SPECIAL REPORT 2013, Cree is perhaps the top supplier in lighting applications and has taken good advantage of its early focus on the lighting application segment. The real question is how the lighting market will proceed going forward. And much of that discussion could hinge on the types of LEDs used in various lighting products. Strategies Unlimited continues to segment the LED market into low- power, mid-power, high-power, and super-high-power sub-segments. The key differentiating point has been the line in the middle where mid-power LEDs are operated at 0.5W and below and high-power LEDs in the 0.5W to 5W range. High- power LEDs have been dominant in lighting applications. LED categorization The boundary between mid- and high-power LEDs has also been neatly aligned with plastic or hybrid-plastic packages used in the lower-end LEDs and more-reliable ceramic packages being used in higher-power devices. But the boundary lines are being crossed from every perspective. Mid-power LEDs are being operated at power levels above 0.5W and increasingly include architectural elements that were developed first in high-power LEDs. For example, Philips just announced high-voltage mid-power LEDs, and added epoxy-molded- compound packages that should deliver better reliability. Cree continues to push ceramic packages into smaller footprints — smaller than mid-power LEDs — while delivering the luminous flux of larger high-power LEDs. Evstratyeva readily admitted in her SIL presentation that new thinking was needed in the area of segmenting the LED market by type of device. Still, she presented ’13 ’14 ’15 ’16 ’17 ’18 Revenues (US$B) 0 1 2 3 4 5 6 7 8 Super-high power High power Medium power Low power FIG. 14. The replacement lamps market will consume LEDs across the power sub-segment categorization.
  • 27. Research projects five years of growth for packaged LEDs and SSL 27 LEDs Magazine SPECIAL REPORT some projections based on the conventional segmentation tied to power level. And the results were surprising to some in the audience. For example, consider the replacement lamps market depicted in Fig. 14 segmented by LED type. Strategies Unlimited projects high-power LEDs to remain dominant in terms of revenue in the retrofit lamps segment. A number of attendees at SIL questioned that projection in networking events after the Plenary session. We’d speculate, however, that the devil is in the details. If you stick with a categorization based on power level, then LEDs packaged in a plastic or hybrid- composition package, and that operate above the 0.5W level, are in the high-power category. Moreover, remember that the breakdown is based on LED revenue and not unit volume. High-power LEDs sell at higher price levels; therefore, the products that use high-power LEDs will contribute more to the high-power category measured by revenue. The surprising angle to the category-based breakdown is the increasing prominence of COB LEDs across many different lighting applications. Some in the industry have the mistaken idea that COBs deliver more uniform light. In reality a careful optical design can almost always deliver better optical performance with discrete emitters. The fact is that COBs are easier to design into products. Driving the COBs is easier and the thermals are in part handled in the LED package. Coming out of SIL the prevailing thought was that you should expect COBs in virtually every lighting application, with lighting manufacturers trading simplicity of product development for less-precise beam control.
  • 28. 28 LEDS Magazine SPECIAL REPORT ORIGINALLY PUBLISHED MARCH 26, 2013 Packaged LED market resumes moderate growth while the SSL market will enjoy 12% CAGR through 2017 General lighting applications are now the largest market, measured by revenue, for packaged LEDs, reports MAURY WRIGHT from the Strategies in Light conference, and the SSL market has grown to $11.8 billion for lamps and luminaires. OPENING AND CLOSING the Plenary session at the Strategies in Light (SIL) conference, Ella Shum and Vrinda Bhandarkar of Strategies Unlimited reported on the 2012 market for packaged LEDs and SSL products respectively. Packaged LED revenue hit $13.7 B (billion) in 2012, while solid-state lighting (SSL) revenue for lamps and luminaires combined reach $11.8 B. Both markets will continue to grow through 2017 although LED revenue growth will be moderated by falling component prices even as more LEDs are manufactured. Shum, director of the LED practice at Strategies Unlimited, reported that the global market for packaged LEDs in 2012 totaled $13.7 B. That total does not include the sale of bare die or modular lighting products, but solely packaged LEDs whether the product in question is a single-emitter LED, a multi-die package, or a chip-on-board (COB) LED array. The total market was up from $12.5 B in 2011 as we covered in our SIL report from last year.
  • 29. 29 LEDs Magazine SPECIAL REPORT Packaged LED market resumes moderate growth while the SSL market will enjoy 12% CAGR LED market by segments Shum segments the packaged LED market into backlight (TV/monitor), mobile, signage, automotive, lighting and other categories. For the first time in 2012, general lighting became the largest market for packaged LEDs globally at $3.1 B. Fig. 1 depicts the market breakdown by revenue for packaged LEDs across the segments and shows the growth or decline in the segments from 2011 to 2012. Shum’s talk was entitled, “The art of war” and she opened saying, “We have had a bloodbath in the last few years in the LED industry.” As she reported last year, there has been an oversupply of components in the market driven primarily by a surplus of products made for the backlight segment. The TV market has been slower than some expected to transition from fluorescent to LED backlights while LED manufacturers sought to win in that segment. The result of the surplus has been even lower LED prices than could be justified by advancements in LED manufacturing technology – especially in low- and mid-power devices. But the low prices have impacted pricing expectations even in high-power LEDs designed specifically for lighting applications. And LED manufacturers have competed tenaciously to win market share, leading to the title of the presentation. Manufacturer rankings Continuing with the battle theme, Shum provided her rankings of the top 10 packaged LED vendors for 2012 (Table 1) and then discussed strategies that different manufacturers are pursuing and specific challenges that some face. There was little change in the order of the suppliers relative to 2011, although Shum also 2011 2012 Revenue (US$, B) Backlight TV/monitor Mobile Sign Lighting Automotive Others 2.5 2.0 3.5 3.0 1.5 1.0 0.5 0.0 FIG. 1. Packaged LED revenue growth segmented by market over 2011 to 2012.
  • 30. 30 LEDs Magazine SPECIAL REPORT Packaged LED market resumes moderate growth while the SSL market will enjoy 12% CAGR supplied growth/decline rates by manufacturer that could foretell future changes. Samsung was a major mover in terms of growth, although its overall position in the ranking was unchanged. The growth, according to Shum, comes from its production of LEDs for use in Samsung consumer products such as TVs. Likewise, Lumens entered the rankings in a tie for the tenth spot – actually making the rankings a top-11 list. And Lumens is another major supplier to Samsung for consumer products. Samsung, however, seems intent on continuing to ramp its LED manufacturing numbers, becoming even more vertically integrated in terms of its consumer products. Toyoda Gosei jumped a spot in the rankings. Shum said that the company’s 37% growth came thanks to supplying LEDs for Apple mobile products. Cree and Philips Lumileds appear to be the most prominent beneficiaries of the ramp in LEDs used for general lighting applications. Both experienced growth in the 20% range. And as we will discuss in more detail shortly, general lighting is the segment with the most long-term growth potential. Shum said that the top 11 companies in her rankings accounted for 72% of the global packaged LED revenue. Manufacturers in Japan led with 30% of the overall market followed by Korea at 28%, Taiwan and South East Asia at 15% and China at 8% (Fig. 3). It might be worth noting that Shum has expressed the opinion that China will have a player in the top ten within five years. Manufacturers in the US and Europe combined make up 19% of the total market. 1. Nichia 5% 2. Samsung 22% 3. Osram Opto 5% 4. LG Innotek -1% 5. Seoul Semi Philips Lumileds 14% 21% 7. Cree 18% 8. TG 18% 9. Sharp 14% 10. Everlight Lumens -1% 32% FIG. 2. Nichia’s 757 LED in a QFN plastic package.
  • 31. 31 LEDs Magazine SPECIAL REPORT Packaged LED market resumes moderate growth while the SSL market will enjoy 12% CAGR In terms of strategy, Shum described different approaches that manufacturers are taking to differentiate their products and grow their market. For example, she cited the recent 100W COB LED announced by Sharp as an example of greater lumen output through larger size. She noted that Cree has continued to push performance in terms of efficacy, specifically mentioning the recently announced 200- lm/W XLamp MK-R LED. Shum said that Bridgelux was attempting to simplify luminaire design with its Vero COB LEDs that separate the LED and plastic holder that can include either large solder pads or a connector. Of course lower-component cost is a common goal among LED manufacturers, although the manufacturers take different approaches to the fact that higher volumes and maturing manufacturing technology is enabling cost reduction. Cree, for example, tends to try and keep LED cost relatively constant while offering higher performance – still providing cost savings at the SSL system level as fewer LEDs are required. Shum cited Nichia for being at the forefront of LED price drops and noted the company’s 757 high-power LED family that is packaged more like a low- or mid-power device (Fig. 2). Nichia packages the 757 LEDs in a plastic QFN (Quad Flat No-leads) package developed and widely used in the broader semiconductor market. Separate from technology strategy, Shum also noted that LED manufacturers are taking different business and market approaches such as the aforementioned Samsung strategy of vertical integration. She siad that many companies were seeking to grow through mergers or alliances mentioning specifically Epistar and Huga Optotech; Nichia and Citizen; and Toyoda Gosei and Showa Denko. Cree, Osram, and Philips are all helping to drive the LED component market by pushing SSL deployment – essentially another approach to vertical integration. Shum FIG. 3. Packaged LED revenue in 2012 by region. Source: Strategies Unlimited Japan 30% Korea 28% US/Europe 19% Taiwan/ SE Asia 15% China 8%
  • 32. 32 LEDs Magazine SPECIAL REPORT Packaged LED market resumes moderate growth while the SSL market will enjoy 12% CAGR did not have positive thoughts for the small- and mid-size LED manufacturers essentially predicting that most will not survive as independent LED manufacturers. Market segment details Getting back to market segments, Shum discussed each in depth. The 2012 sales were broken down by SSL at 23%, backlights for TVs and monitors at 22%, mobile at 19%, signage at 13%, automotive at 10%, and other at 13 %. Referring back To Fig. 1, it’s clear that most of the segments are saturated or are moving quickly toward that position, with the exception of lighting. The lighting segment experienced tremendous growth from just over $1.5 B in 2011 to the $3.1 B number in 2012. Still all of the segments are substantial in terms of LEDs consumed and warrant further examination starting with the backlight segment that had been the largest growth segment for LEDs prior to 2012. Last year at SIL, Shum predicted that a new class of low-cost, direct-backlit TVs were headed to market and that the trend could greatly impact LED sales. At that time no companies were actually producing what Shum calls chubby TVs. She said that from March to December of 2012, however, there were around 20 million such TVs sold globally. The driver behind thicker TVs is lower cost. Making the TV thicker allows the TV manufacturer to use fewer brighter LEDs to effectively backlight the screen. That may seem completely ironic given that the value proposition of LED-based TVs has been either super-slim edge-lit models, or direct-lit models that greatly enhanced picture quality via large numbers of LEDs and local dimming. But now LED backlighting can be a low-cost play for TV manufacturers at the lower end of their portfolio. TV trends Shum predicts that the chubby TVs will represent an increasingly larger portion of the market over the course of the next five years. Fig. 4 depicts both the revenue value of the LEDs used in different types of TVs on the left axis and the number of
  • 33. 33 LEDs Magazine SPECIAL REPORT Packaged LED market resumes moderate growth while the SSL market will enjoy 12% CAGR LEDs that the types of TVs will consume. You can clearly see the impact of reductions in LED prices going forward as the TV segment will consume more LEDs while the market value of those LEDs declines. There are a number of factors that could yet impact the forecast. At the Consumer Electronics Show back in January, for example, a number of companies demonstrated what are being called Ultra HD or 4k TVs that feature 4000×2000-pixel resolution – four times the resolution of today’s best HDTVs. It remains to be seen how fast those sets come to market or if consumers will pay a premium price for them. But they will use significantly more LEDs. Such TVs will almost universally use a direct-backlight scheme with local dimming. Shum said each set could consume more than 5000 7030-package LEDs. Energy regulatory issues could also come into play including the Energy Star program administered by the US Environmental Protection Agency and at the state level by programs such as California Title 20. For example, Energy Star 6.0 requires that TV sets larger than 55 inches consume no more power than 55-inch sets. Direct-backlit designs with local dimming consume less power because the backlight LEDs for much of the display may be dimmed at any given time. So such regulations could increase the use of local dimming, or TV manufacturers could use the chubby model and further reduce the number of LEDs used and maximum light levels that TVs are capable of delivering. Mobile, auto, and signage applications Just behind the backlight market in terms of revenue, the mobile segment remains significant, consuming more than $2.5 B in LEDs and is comprised of both phones and tablets. The phone segment alone totaled $1.4 B in 2012. There are two factors FIG. 4. LED revenue in the TV market segment by the backlighting scheme used. Source: Strategies Unlimited 3.0 2.5 2.0 1.5 1.0 0.5 0.0 160 140 120 100 80 60 40 20 0 2011 Revenue (US$, B) Edge lit w/o dimming Edge lit with dimming Direct backlight Low-cost backlit 2012 2013 2014 2015 2016 2017 Units (M) Edge lit w/o dimming Edge lit with dimming Direct backlight Low-cost backlit
  • 34. 34 LEDs Magazine SPECIAL REPORT Packaged LED market resumes moderate growth while the SSL market will enjoy 12% CAGR driving more LED sales – the transition to smartphones requiring more and better backlights and the broad inclusion of an LED as a camera flash on phones. Fig. 5 shows Shum’s market projection for the mobile phone space over the next five years. Sales into the flash usage are the only place where she sees revenues rising. But the rising penetration of smart phones will to a degree mitigate the impact of falling LED prices. The tablet market is less certain at this point, although Shum did note the overall trend of an increase in tablet sales relative to decline in notebook computer sales. The auto market includes both interior lighting and exterior lighting including headlamps. The latter promises to be the growth sub segment. It is being enabled by what Shum termed the magic bullet – new optics. Manufacturers are developing total internal reflection optics (TIR) that can enable a number of different headlamp types that will ultimately allow auto manufacturers to move to LED-based designs across their entire fleet. At the low end of the auto market you will see reflector-type designs with a transition to projector-type headlamps that use TIRs on higher-priced vehicles. At the high end, there are products classified as direct-projection headlamps that have multiple LED/optic elements for different illumination angles that can go far beyond the legacy low- and high-beam settings in terms of beam control. The total market for LEDs used in exterior auto lighting applications in 2012 was $737 million. Fig. 6 details the total exterior lighting market broken up by how the LEDs are used projected through 2017. The daytime running lamps (DRL) usage has been the largest consumer of LEDs although that will give way to headlamps in FIG. 5. LED revenue in mobile phones segmented by usage in the phone. Source: Strategies Unlimited Revenue (US$, M) 0 700 600 500 400 300 200 100 2011 2012 2013 2014 Flash Smart phone display Feature phones display Keypad RGB multichips ringer 2015 2016 2017
  • 35. 35 LEDs Magazine SPECIAL REPORT Packaged LED market resumes moderate growth while the SSL market will enjoy 12% CAGR the 2014-2015 timeframe. And the headlamp usage is growing at a CAGR of 36% based on LED revenue. Shum projects a relatively flat market for LEDs used in interior applications. More LEDs will be utilized in more ways than ever, including as backlights for what are becoming almost ubiquitous video panels. But LED component price drops will keep the market flat from an LED revenue perspective. The signage market is one that is fully saturated in terms of using SSL technology. Still, Shum projects steady, although unspectacular, growth for the segment. In 2012, LED revenue for the segment totaled $1.7 B and Shum projects that it will cross $2 B in 2015. LEDs in lighting Coming full circle, the real growth in LED sales will come in general SSL applications. Shum projects that LED revenue from lighting to grow from the previously mentioned $3.1 B in 2012 to $4.4 B in 2017, representing a CAGR of 7% (Fig. 7). The projected growth is especially impressive if you consider the rate at which prices are dropping. Fig. 8 depicts the increase in efficacy over the past five years plotted against the decrease in dollar per kilo lumen ($/klm) – the latter a metric that the US Department of Energy (DOE) tracks and projects in its SSL program. Indeed in the DOE’s latest SSL Multi-Year Program Plan FIG. 6. LED revenue in auto exterior lighting showing that growth will come in headlamps. Source: Strategies Unlimited Revenue (US$, M) 0 350 300 450 400 250 200 150 100 50 2011 2012 2013 2014 DRL Headlamp CHMSL Stop/tail 2 wheel vehicles Trucks, buses, warning signals After market Headlamp 5 year CAGR 36% Others 2015 2016 2017 FIG. 7. LED revenue in general lighting segmented by application. Source: Strategies Unlimited Revenue (US$, B) Off-grid Outdoor area Industrial Commercial Retail display Other lighting Emergency lighting Consumer portable Residential Entertainment Architectural Replacement lamps 0.0 3.5 3.0 4.5 4.0 2.5 2.0 1.5 1.0 0.5 2012 2013 2014 2015 2016 2017 CAGR 7% $3.1B $4.4B
  • 36. 36 LEDs Magazine SPECIAL REPORT Packaged LED market resumes moderate growth while the SSL market will enjoy 12% CAGR published in April 2012, the agency projected that it would be after 2013 before packaged LED prices dropped to the $3/klm level and after 2015 before prices hit $2/klm. The $3.45/klm number in Fig. 8 represents the average for the year 2012. At SIL, Shum said she thinks the figure has already dropped to $2/klm via products such as the Nichia 757 mentioned earlier. Later in the Plenary session Bhandarkar, director of research for LED lighting at Strategies Unlimited, presented data on the actual market for lighting products. Bhandarkar said replacement lamp revenue grew from $2.1 B in 2011 to $2.58 B in 2012. The largest jump came in Japan where energy concerns caused by the earthquake and tsunami that occurred in 2011 knocking out major energy- generation facilities. In the luminaire sector, revenue grew from $7.2 B in 2011 to $9.2 B in 2012. The commercial market segment is leading the adoption of SSL, representing 23% of the market. Growth in luminaires is fairly consistent across the globe. For the first time, Bhandarkar also reported on another category that includes products such as flexible strings, furniture lighting, airplane lighting, toys and other products that totaled $2.75 B bring the overall market total to $14.5 B. Bhandarkar also addressed some specific types of products. She said, “LED downlights became a commodity market in 2012 – more than 50% of products sold in Japan were LEDs.” Looking forward, she said “Troffers FIG. 8. LED efficacy is steeply rising while price measured by $/klm is dropping. Source: Strategies Unlimited Average lm/1W pkgPrice/klm 2007 2008 $32 $22 $16 $13 130 120 110 98 77 70 $6.25 $3.45 2009 2010 2011 2012 FIG. 9. LED revenues across all applications will rise gently driven by lighting. Source: Strategies Unlimited Revenue (US$, B) 0 12 10 16 14 8 6 4 2 2012 $13.7B 20132011 2014 2015 2016 2017 $15B CAGR 1.8% Backlight TV/ monitor Mobile Sign Lighting Automotive Others
  • 37. 37 LEDs Magazine SPECIAL REPORT Packaged LED market resumes moderate growth while the SSL market will enjoy 12% CAGR will be the next major wave of SSL deployment starting this year.” She expects the troffer market to be strong in 2014 and going into 2015. Overall, the SSL market will enjoy a CAGR of 12% through 2017. Bhandarkar projects that SSL luminaire revenue will exceed $20 B in 2017. Projecting the packaged LED market Given the push that packaged LEDs are getting from lighting applications, where are we headed you might ask? The news was better than last year. At SIL in 2012, Shum projected a slight increase in packaged LED revenue in 2013 followed by a -0.2% CAGR through 2016. Given the continuing price drop in components, the revenue forecast hasn’t changed tremendously but the five-year CAGR projected this year is positive at 1.8% as depicted in Fig. 9. Lighting will continue to grow and drive the market. Shum predicts that packaged LED revenue will hit $15 B by 2017. For the first time, Shum also showed a chart reflecting the number of packaged LEDs sold (Fig. 10). We include it here to make the point that in terms of unit volumes, the industry is still in a tremendous growth mode. But as Shum pointed out, the numbers can be misleading because the units sold include everything from single-die packages to COBs that have dozens of emitters in a package. A chart that showed LED die unit volume would show even steeper growth. FIG. 10. The unit volume of packaged LEDs produced is on a steep growth path. Source: Strategies Unlimited Units (B) 0 250 200 350 300 450 500 400 150 100 50 2012 2013 2014 2015 2016 2017 RGB InGaAlP High power InGaAlP Mid power InGaAlP Low power InGaN Super high power InGaN High power InGaN Mid power InGaN Low power