Titan global market letter march 2016
•
0 likes•61 views

The basic message from the study is that when the market has declined in the months of January and February, the rest of the year has been choppy and volatile.

Recommended
Recommended
More Related Content
What's hot
What's hot (20)
Viewers also liked
Viewers also liked (19)
Similar to Titan global market letter march 2016
Similar to Titan global market letter march 2016 (20)
Recently uploaded
Recently uploaded (20)
Titan global market letter march 2016
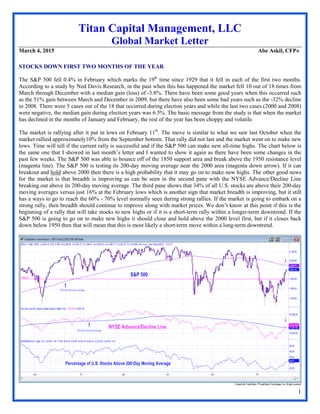
- 1. 1 Titan Capital Management, LLC Global Market Letter March 4, 2015 Abe Askil, CFP® STOCKS DOWN FIRST TWO MONTHS OF THE YEAR The S&P 500 fell 0.4% in February which marks the 19th time since 1929 that it fell in each of the first two months. According to a study by Ned Davis Research, in the past when this has happened the market fell 10 out of 18 times from March through December with a median gain (loss) of -3.8%. There have been some good years when this occurred such as the 51% gain between March and December in 2009, but there have also been some bad years such as the -32% decline in 2008. There were 5 cases out of the 18 that occurred during election years and while the last two cases (2000 and 2008) were negative, the median gain during election years was 6.5%. The basic message from the study is that when the market has declined in the months of January and February, the rest of the year has been choppy and volatile. The market is rallying after it put in lows on February 11th . The move is similar to what we saw last October when the market rallied approximately10% from the September bottom. That rally did not last and the market went on to make new lows. Time will tell if the current rally is successful and if the S&P 500 can make new all-time highs. The chart below is the same one that I showed in last month’s letter and I wanted to show it again as there have been some changes in the past few weeks. The S&P 500 was able to bounce off of the 1850 support area and break above the 1950 resistance level (magenta line). The S&P 500 is testing its 200-day moving average near the 2000 area (magenta down arrow). If it can breakout and hold above 2000 then there is a high probability that it may go on to make new highs. The other good news for the market is that breadth is improving as can be seen in the second pane with the NYSE Advance/Decline Line breaking out above its 200-day moving average. The third pane shows that 34% of all U.S. stocks are above their 200-day moving averages versus just 16% at the February lows which is another sign that market breadth is improving, but it still has a ways to go to reach the 60% - 70% level normally seen during strong rallies. If the market is going to embark on a strong rally, then breadth should continue to improve along with market prices. We don’t know at this point if this is the beginning of a rally that will take stocks to new highs or if it is a short-term rally within a longer-term downtrend. If the S&P 500 is going to go on to make new highs it should close and hold above the 2000 level first, but if it closes back down below 1950 then that will mean that this is most likely a short-term move within a long-term downtrend.
- 2. 2 FINANCIAL STRESS INDEX RISING The financial sector tends to have leading tendencies for the broad stock market. When the financials are strong relative to the market it is generally bullish and when they are weak it is bearish. The S&P 500 financial sector was down 23% off of its highs on February 11th which put financials officially in bear market territory. The financials have rallied with the market over the past few weeks and are currently down 13% from their highs. Strength or weakness in the financials often indicates future strength or weakness in the market so this is an important sector to monitor. The chart below, retrieved from the Fed Bank of St. Louis, shows the Cleveland Financial Stress Index (CFSI) which is designed to track distress in the U.S. financial system. The CFSI tracks stress in six different markets: credit markets, equity markets, foreign exchange markets, interbank markets, real estate markets, and securitization markets. The CFSI is currently at 1.79 (blue line, left scale) which according to the Fed Bank of Cleveland indicates Moderate Stress. A reading above 1.82 is indicative of Significant Stress, it reached as high as 1.88 on February 16th . The last time two times the CFSI was near current levels the Fed unleashed Operation Twist in 2011 and QE1 in 2009. The financial sector may continue to rise and the CFSI may fall into the Normal Stress area between -0.73 and 0.54, which should be positive for the market. If the CFSI continues to rise indicating high levels of financial stress, I am concerned about how effective the Fed will be on the issue given that they are pretty much out of bullets. THE BOTTOM LINE Our Alpha and Omega trend models are both negative at this time, but if the market action continues to improve they could turn positive in the next few days or weeks. The long-term risks for the global markets that I have been writing about for more than a year still exist, but the consequences could be delayed a little longer as the global central banks are doing everything they can to prop up the markets. Our goal is to stay in harmony with the major trends and not fight the tape, so if the market continues to rise and our models turn positive we will get back into stocks comforted with the fact that we have an exit strategy and will move into the safety of bonds and cash if the markets turn down once again. The content of this letter is provided for informational purposes only and is not advice or a recommendation for the purchase or sale of any security. Furthermore, we do not warrant or represent that the information contained in this newsletter is correct, complete, accurate or timely. This information reflects the views of Titan Capital Management, LLC on the date made and may change without notice. We will not be responsible for any investment decisions, damages or other losses resulting from or related to the use of the information we provide. 1500 J Street Modesto, CA 95354 Bus: (209) 529-3089 Toll Free: (888) 378-0777 Fax: (209) 529-3081