Download to read offline


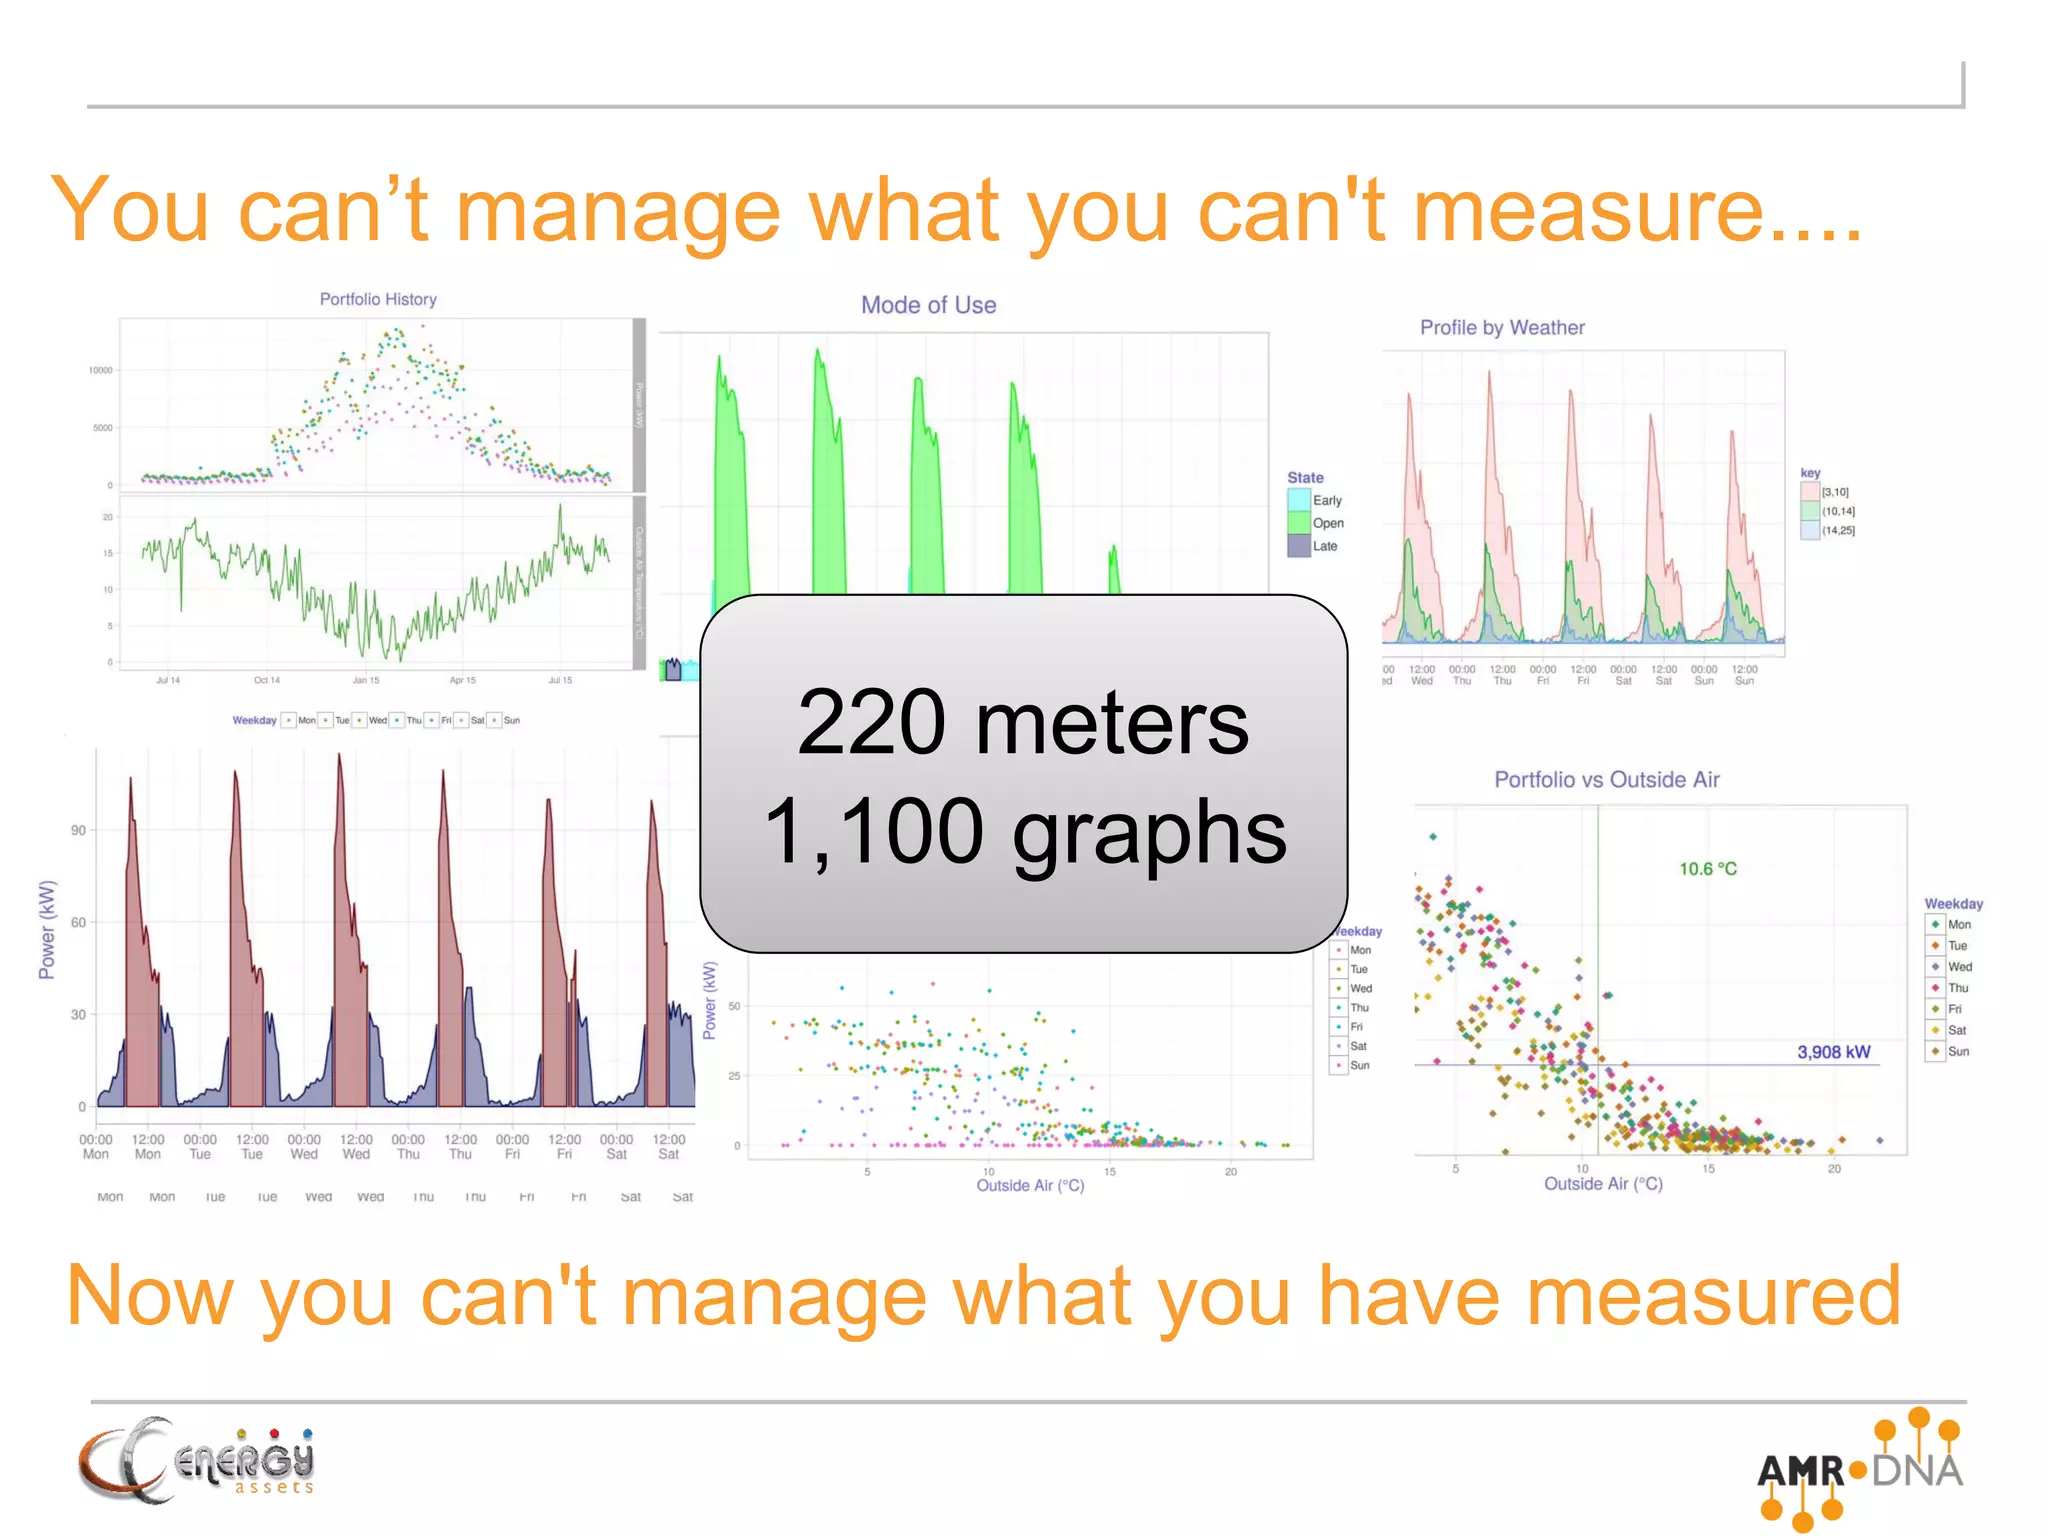
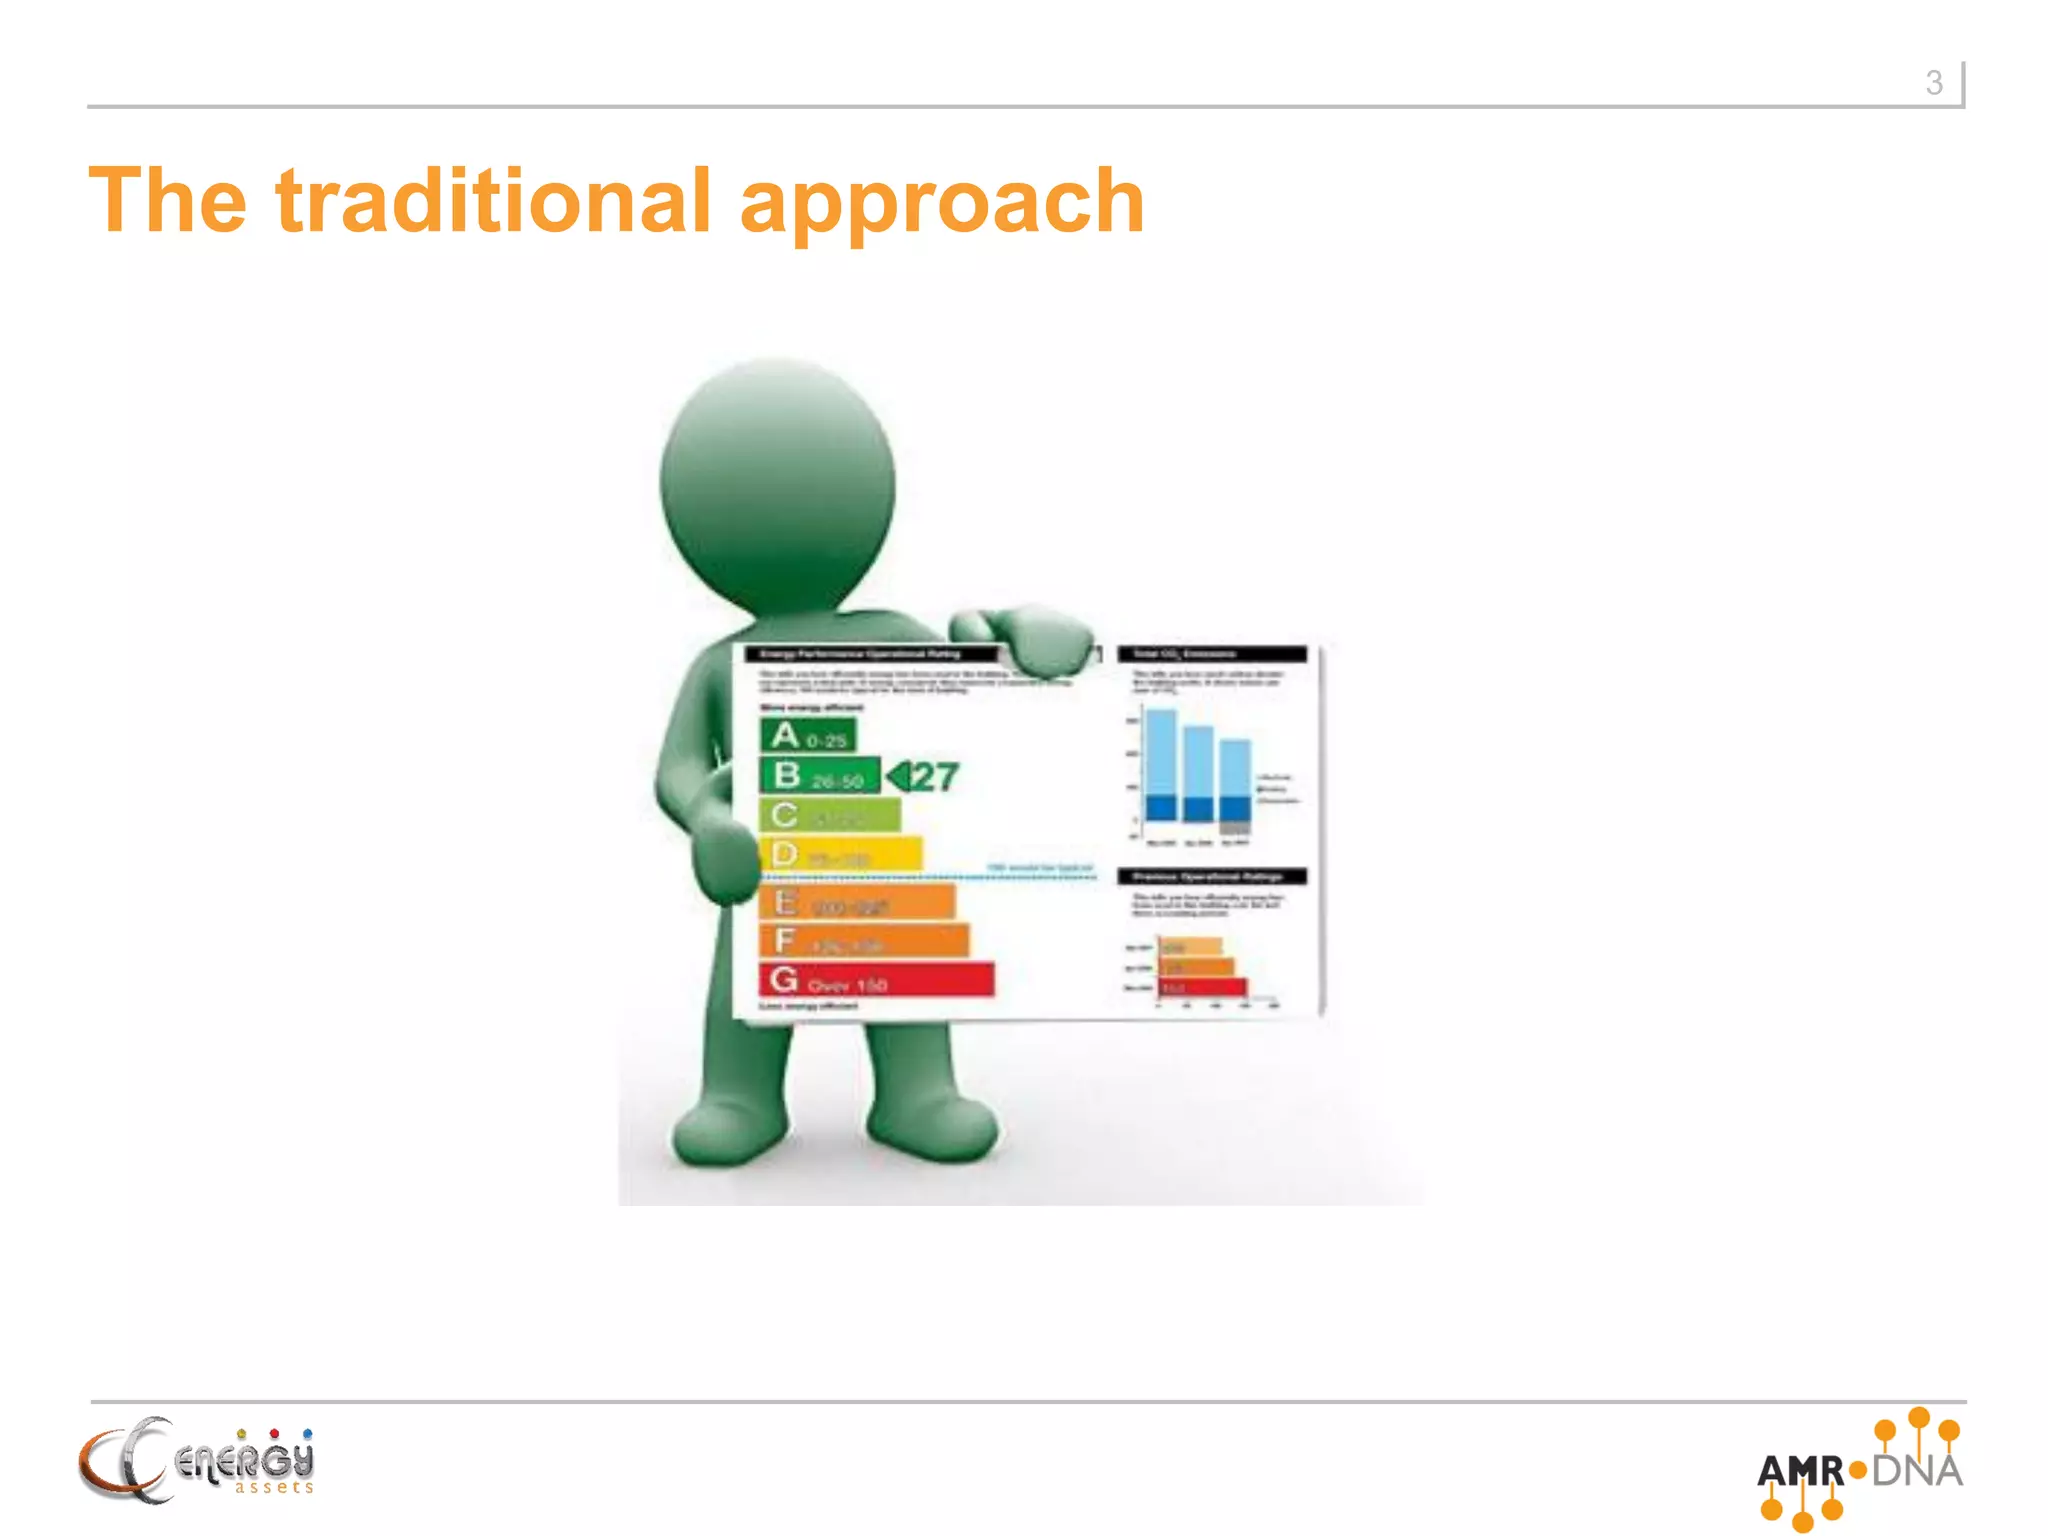
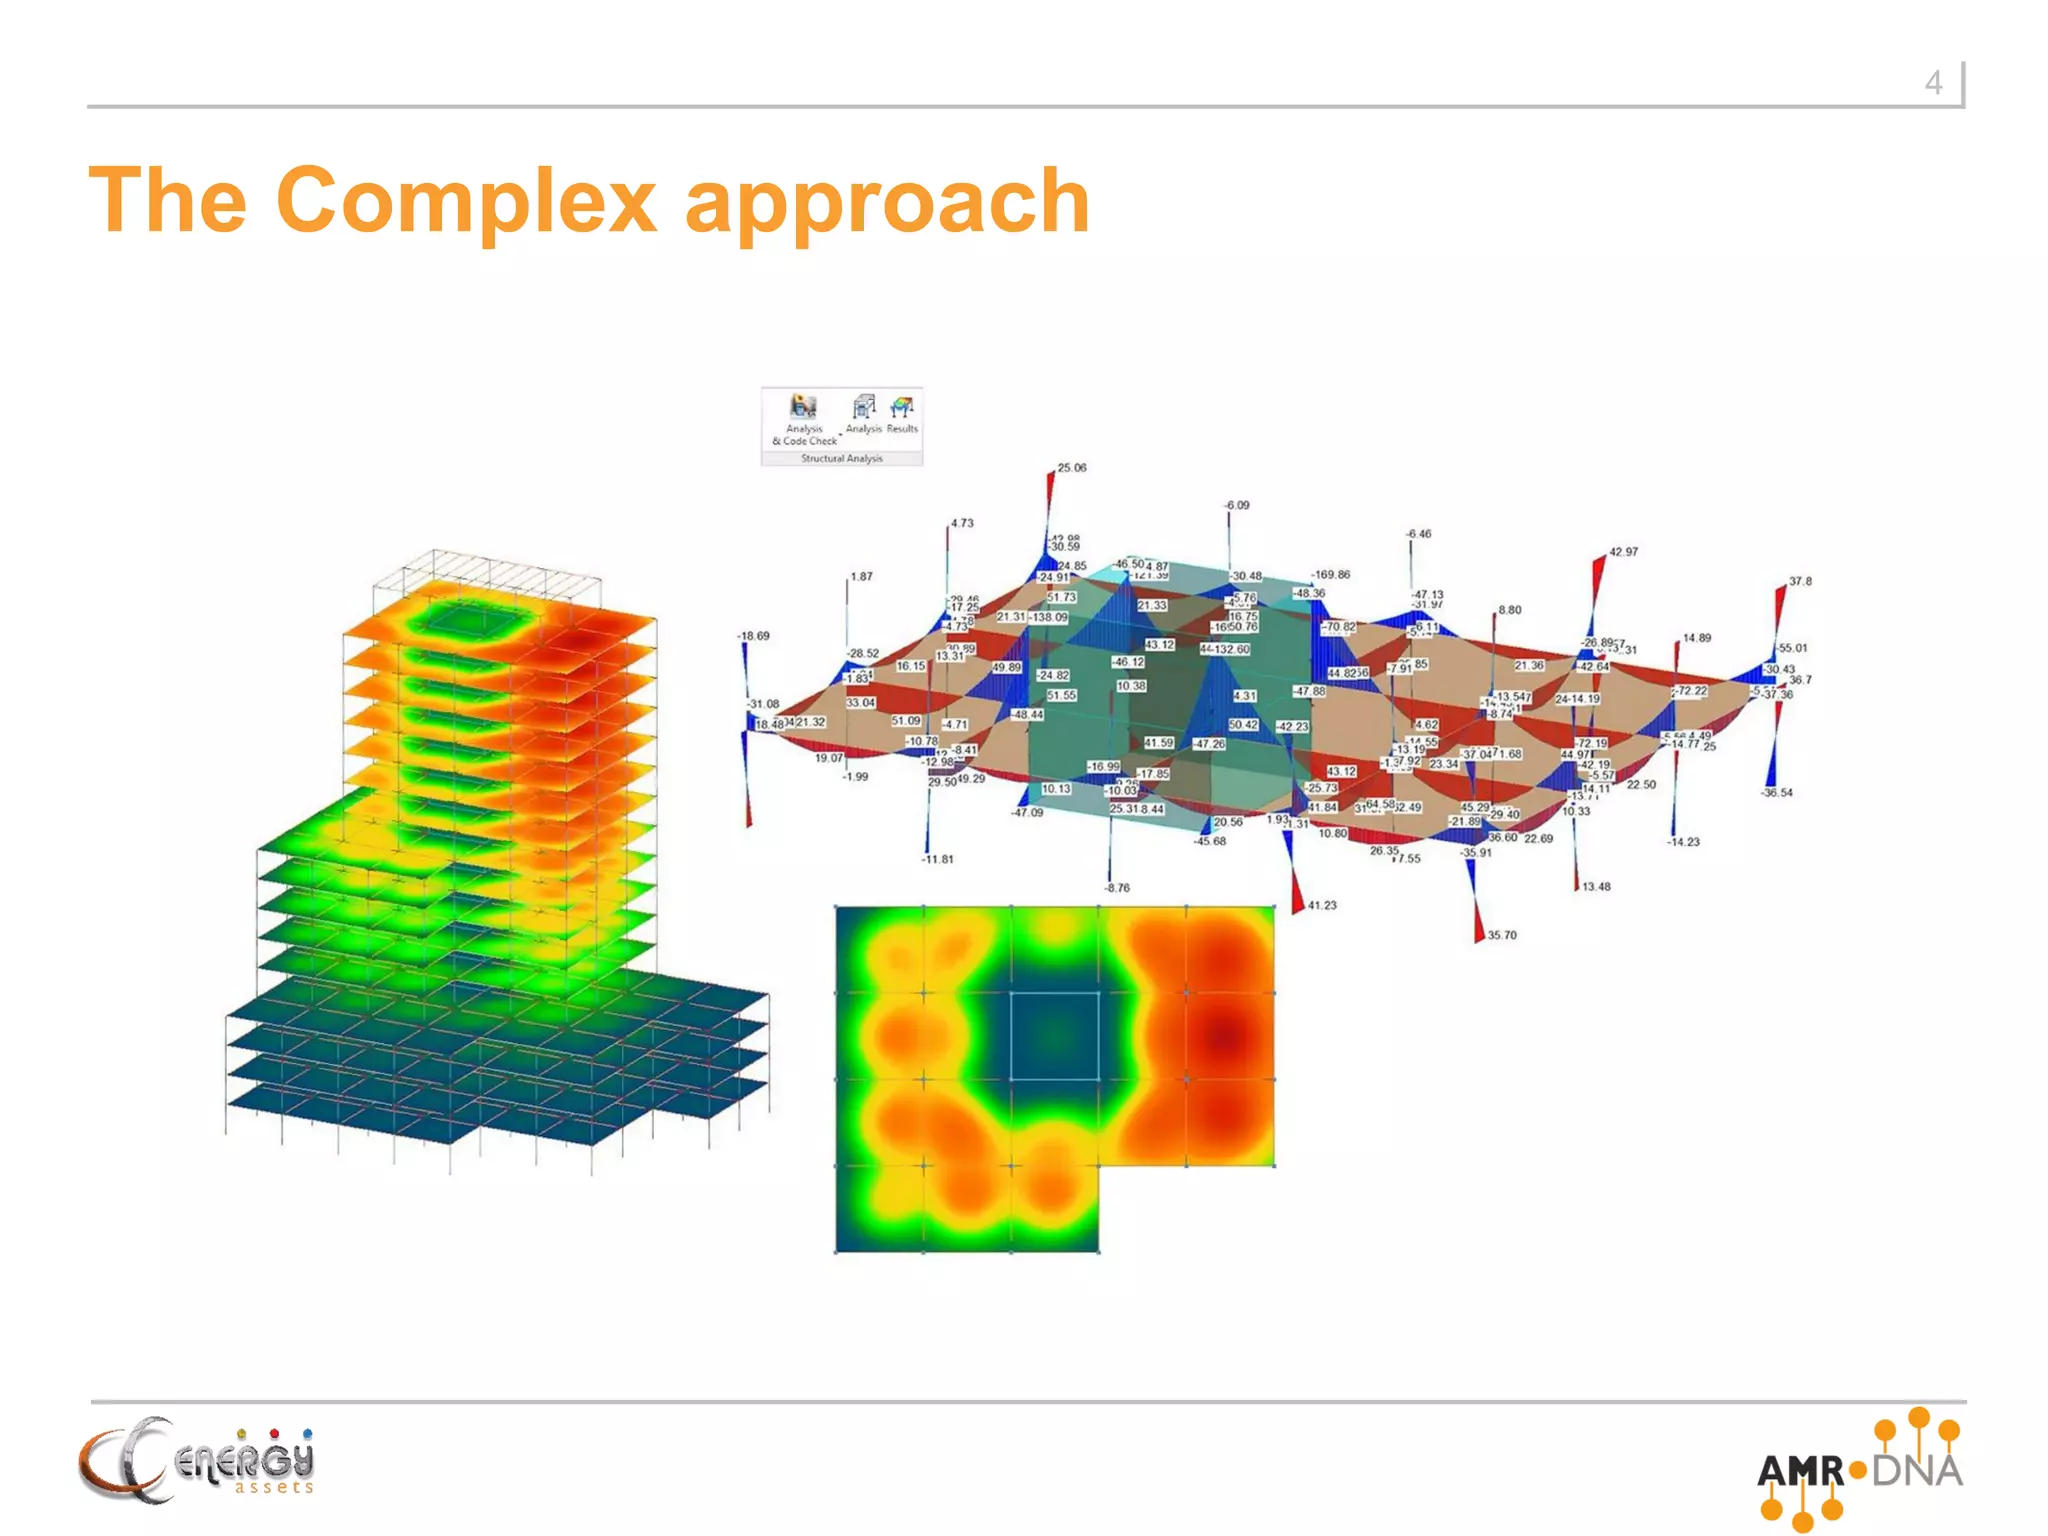
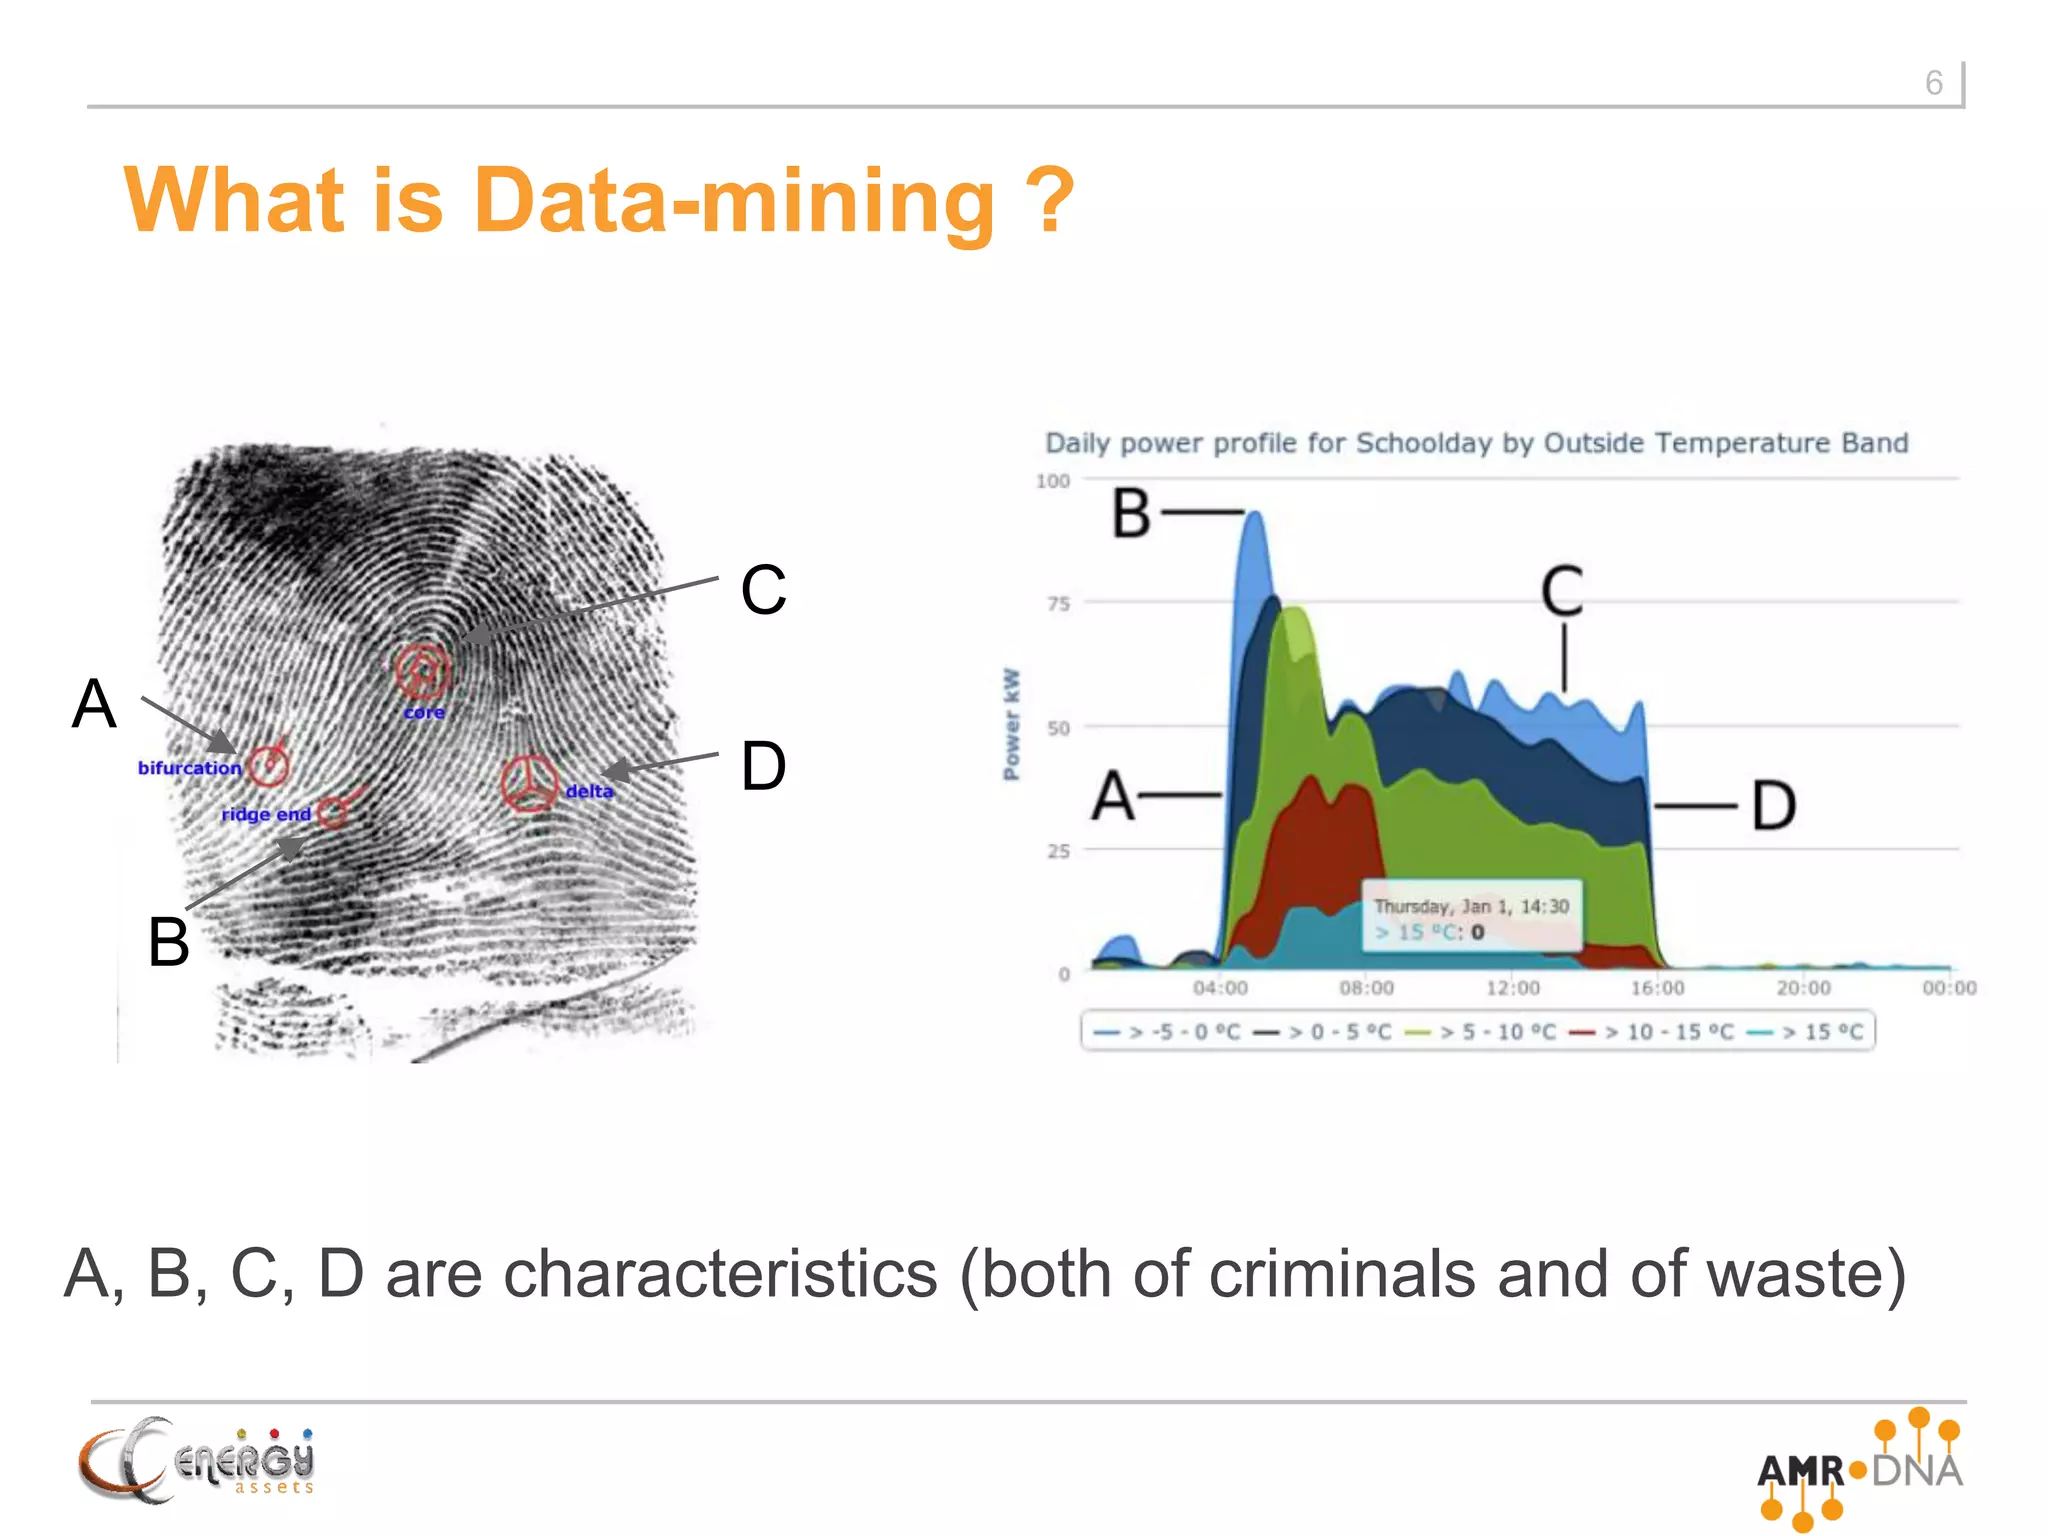
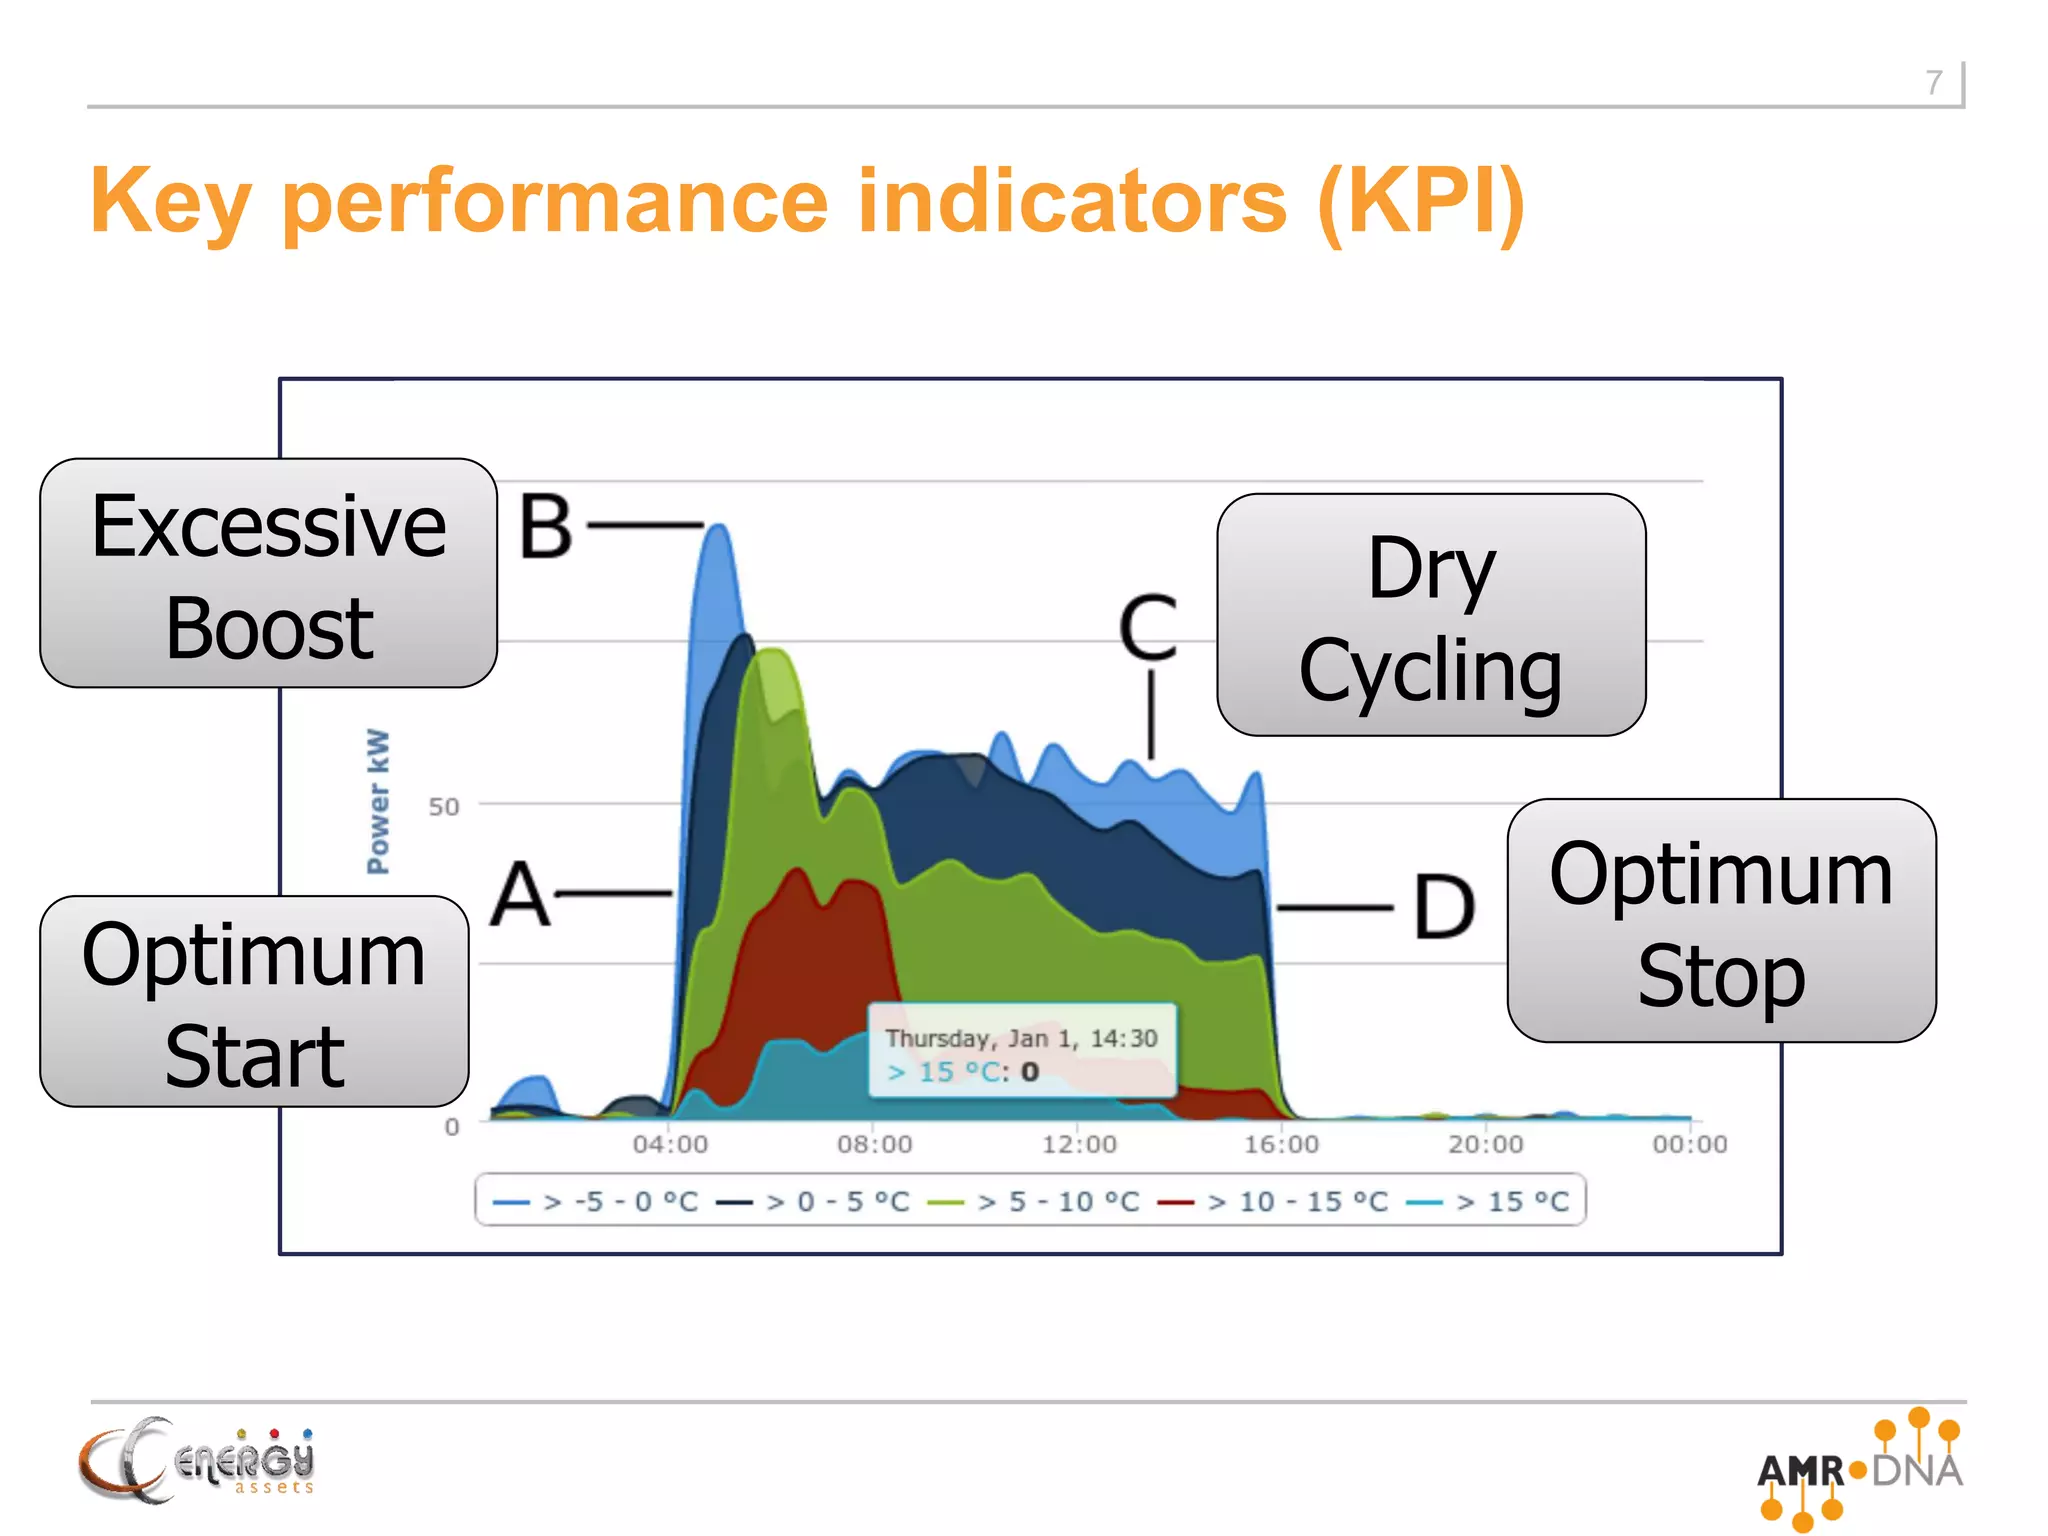
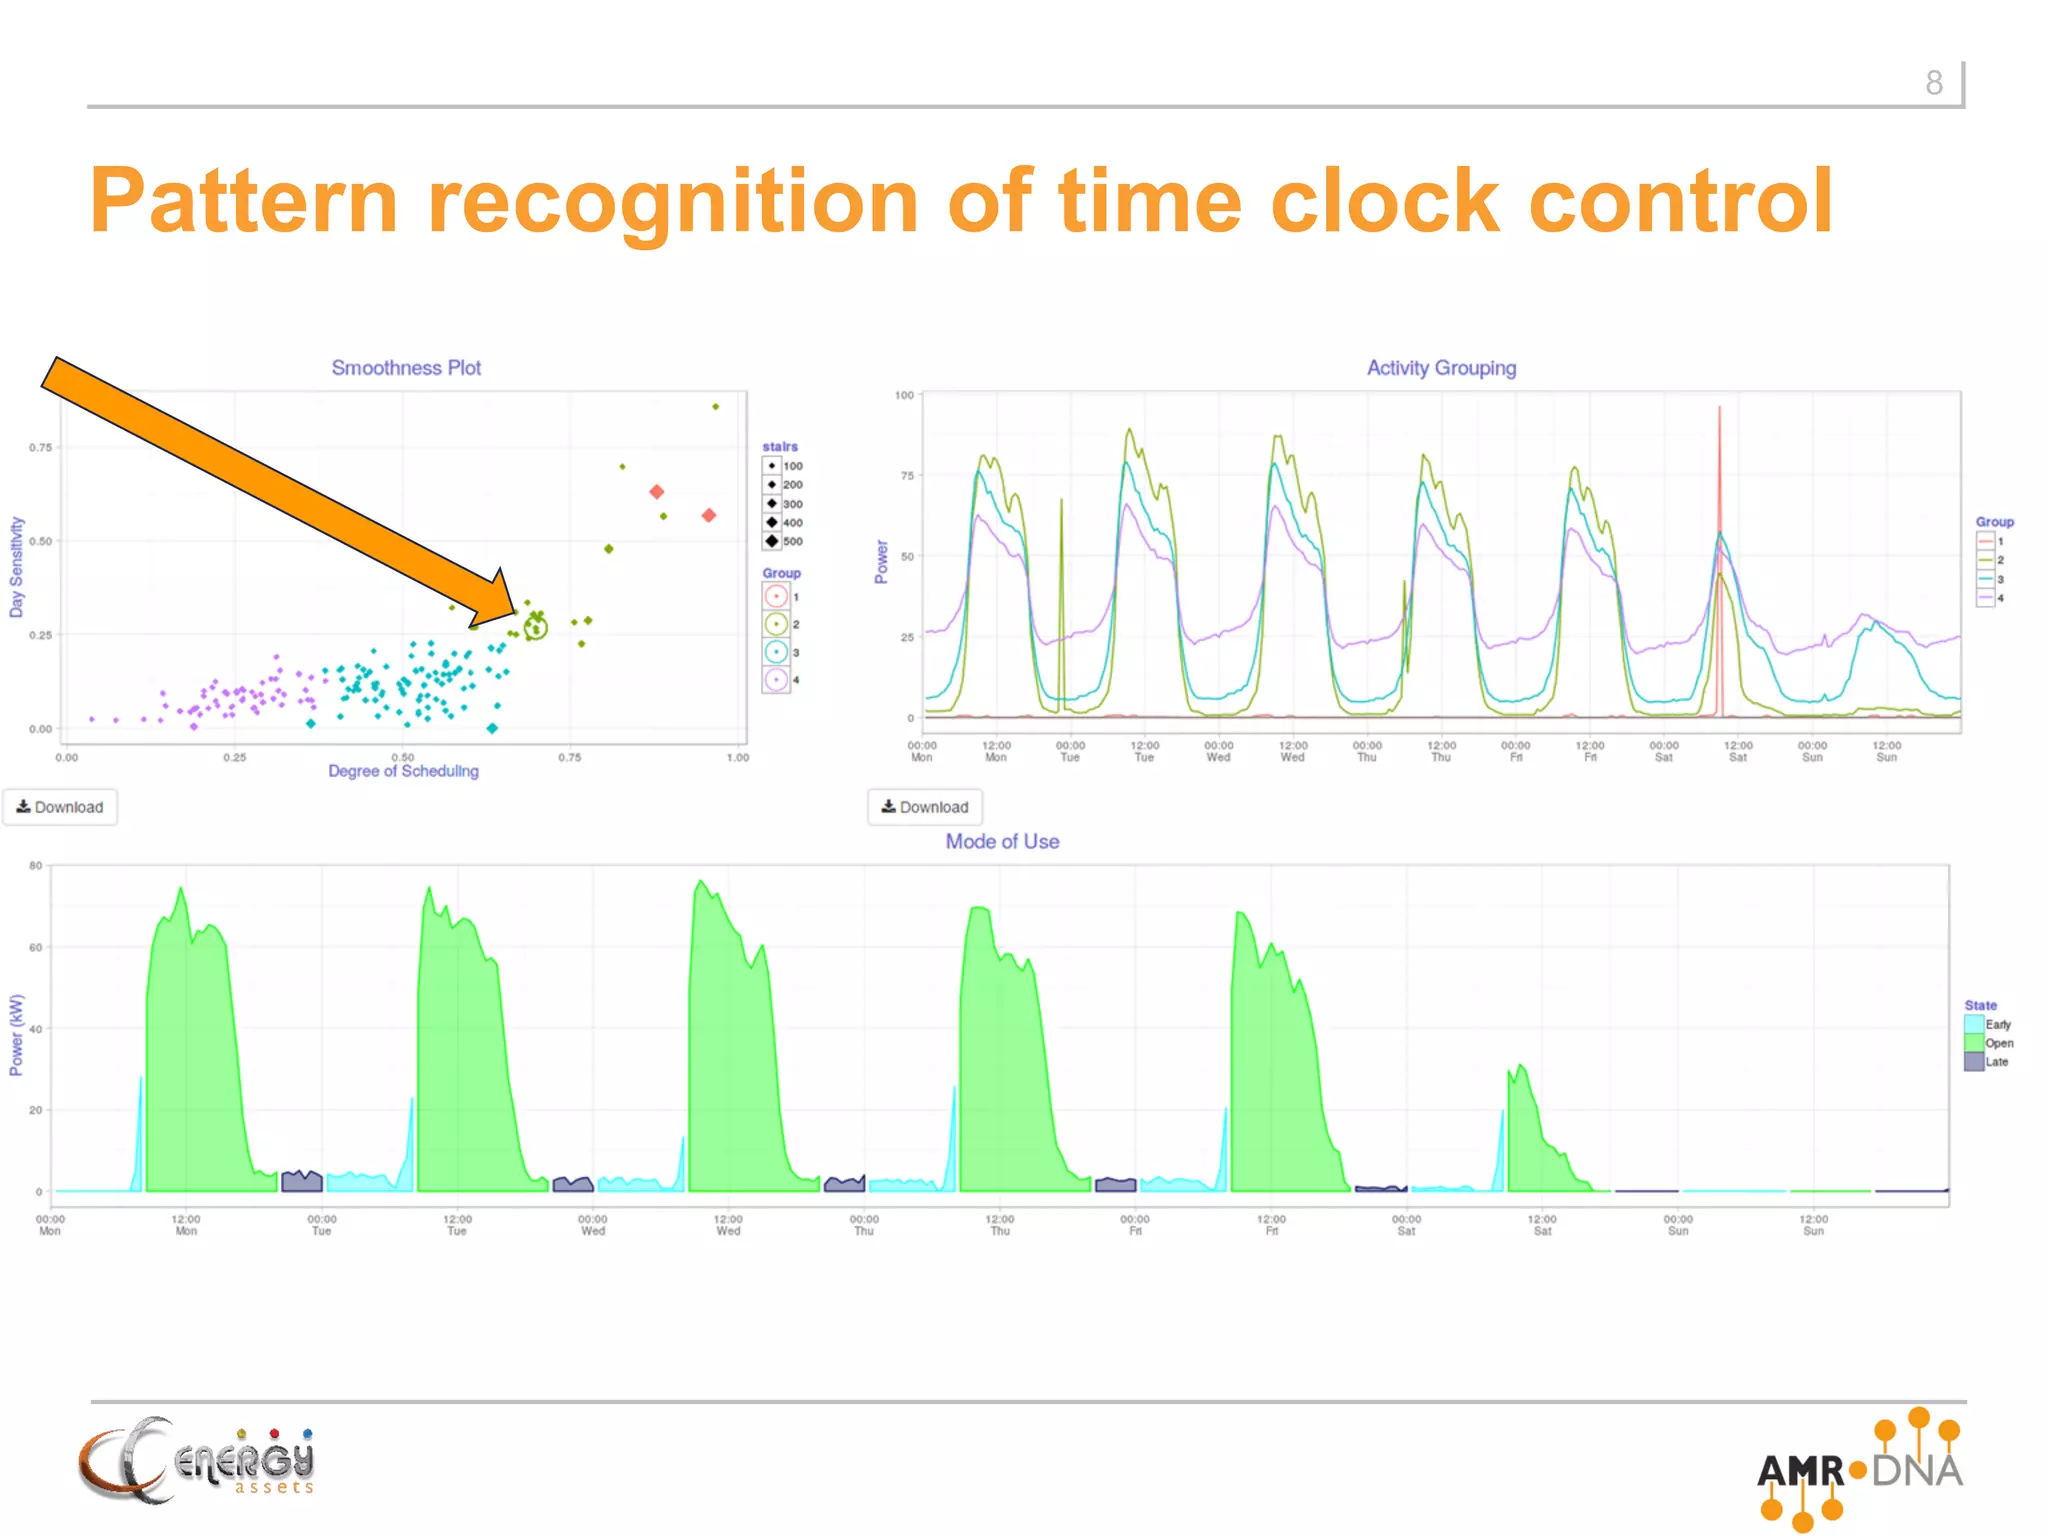
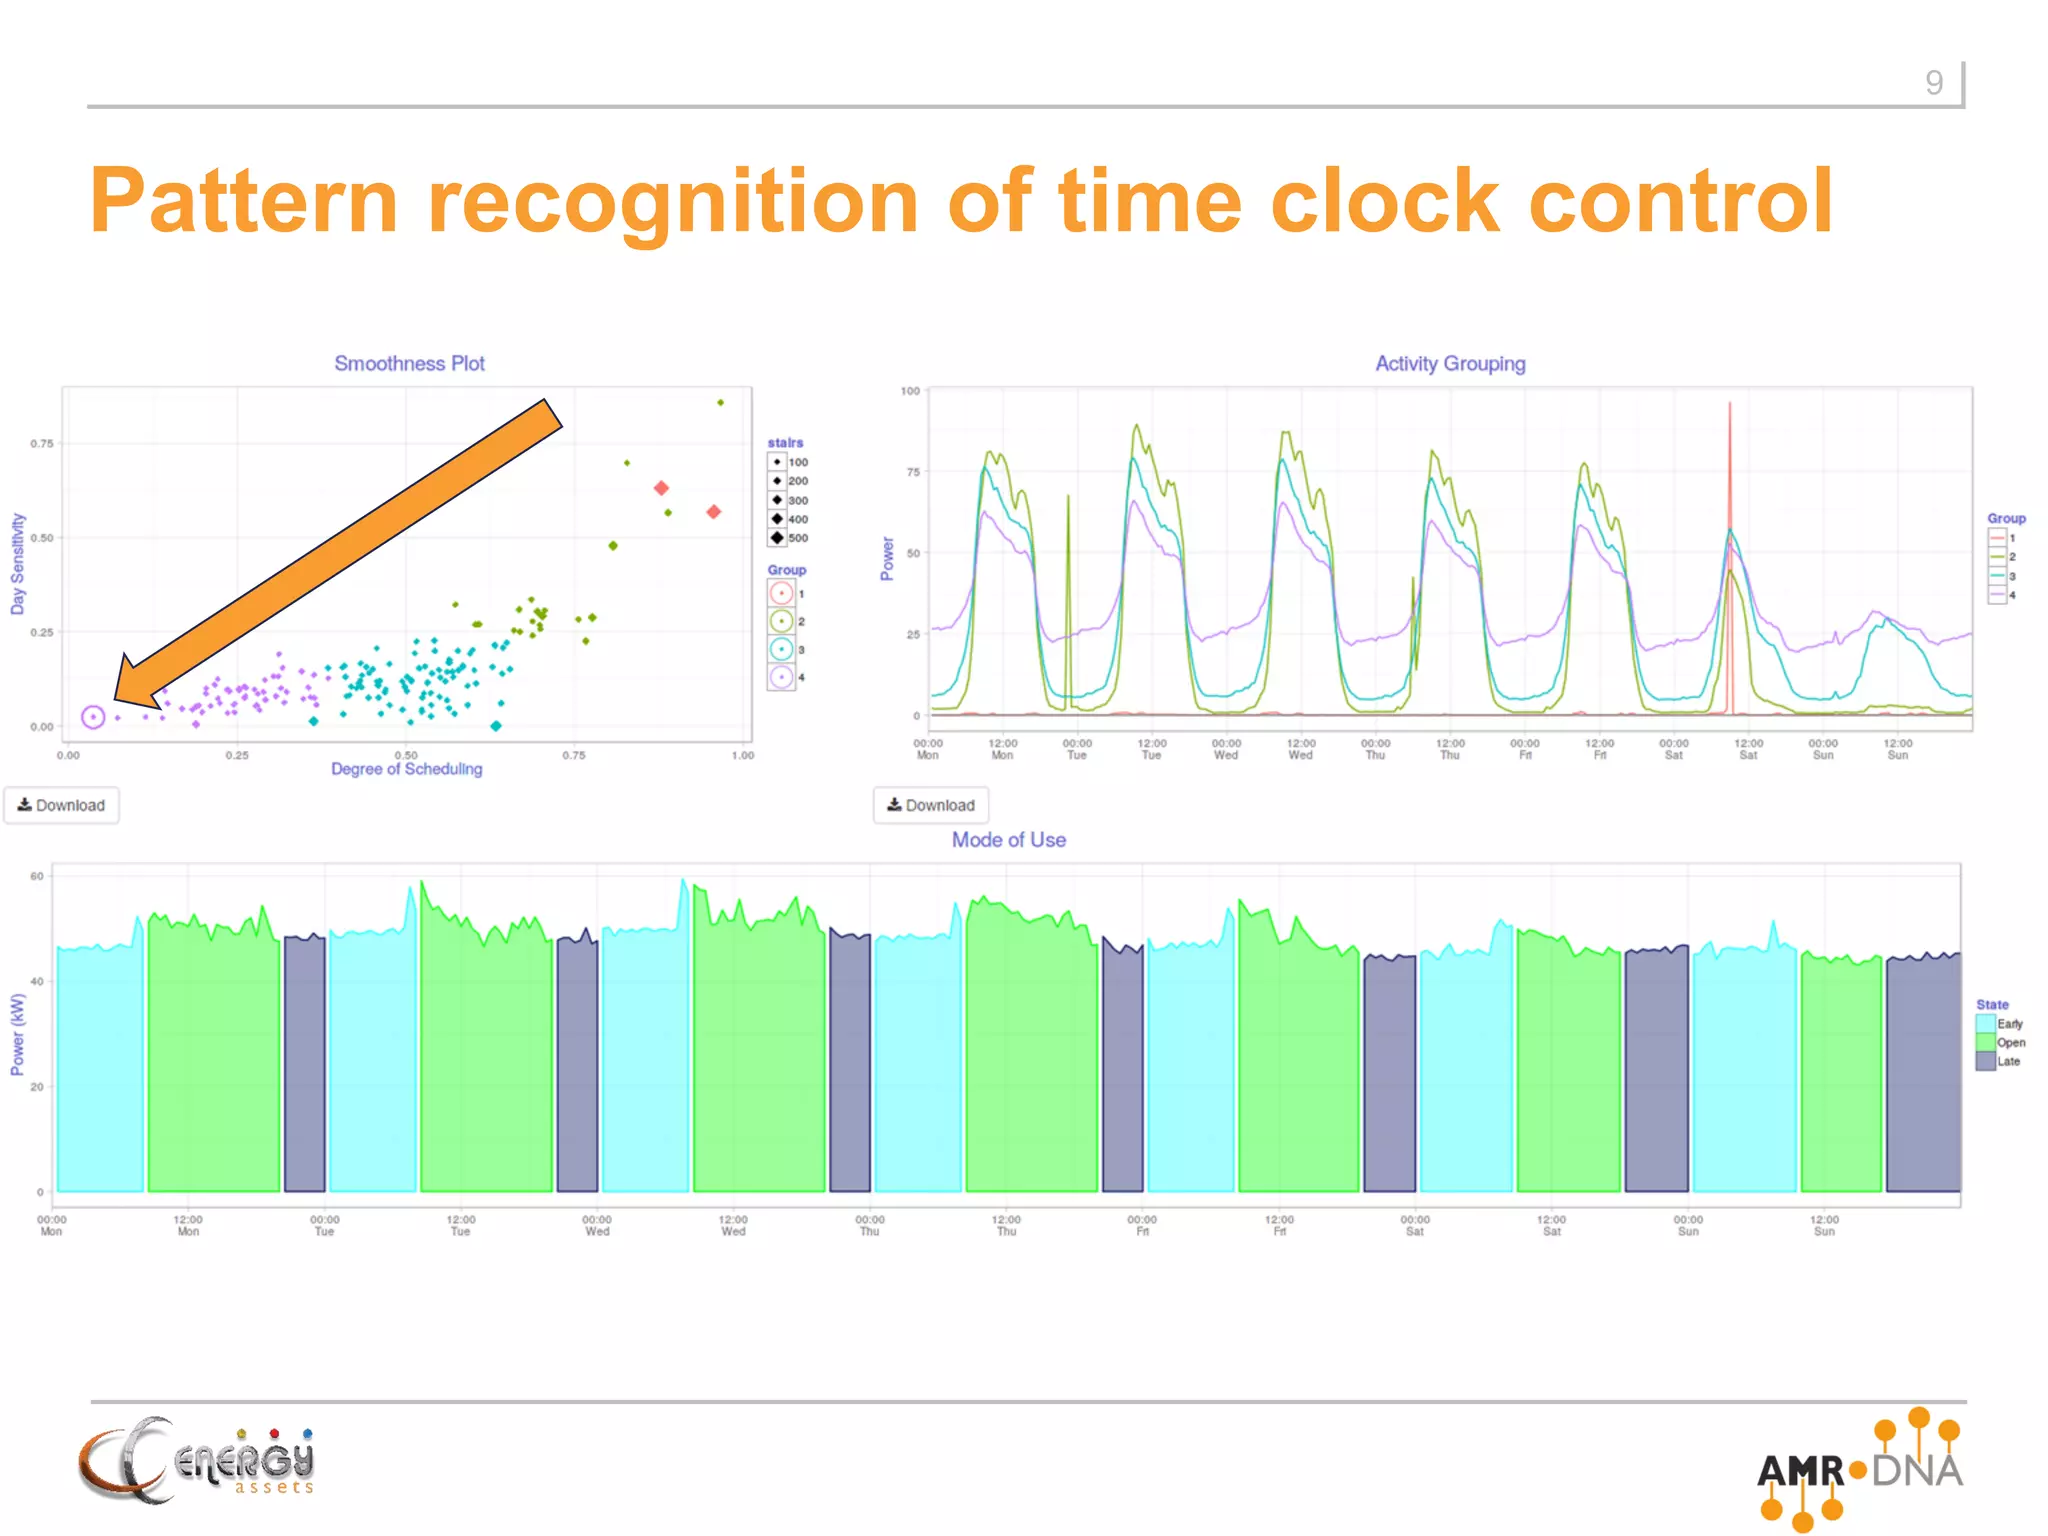

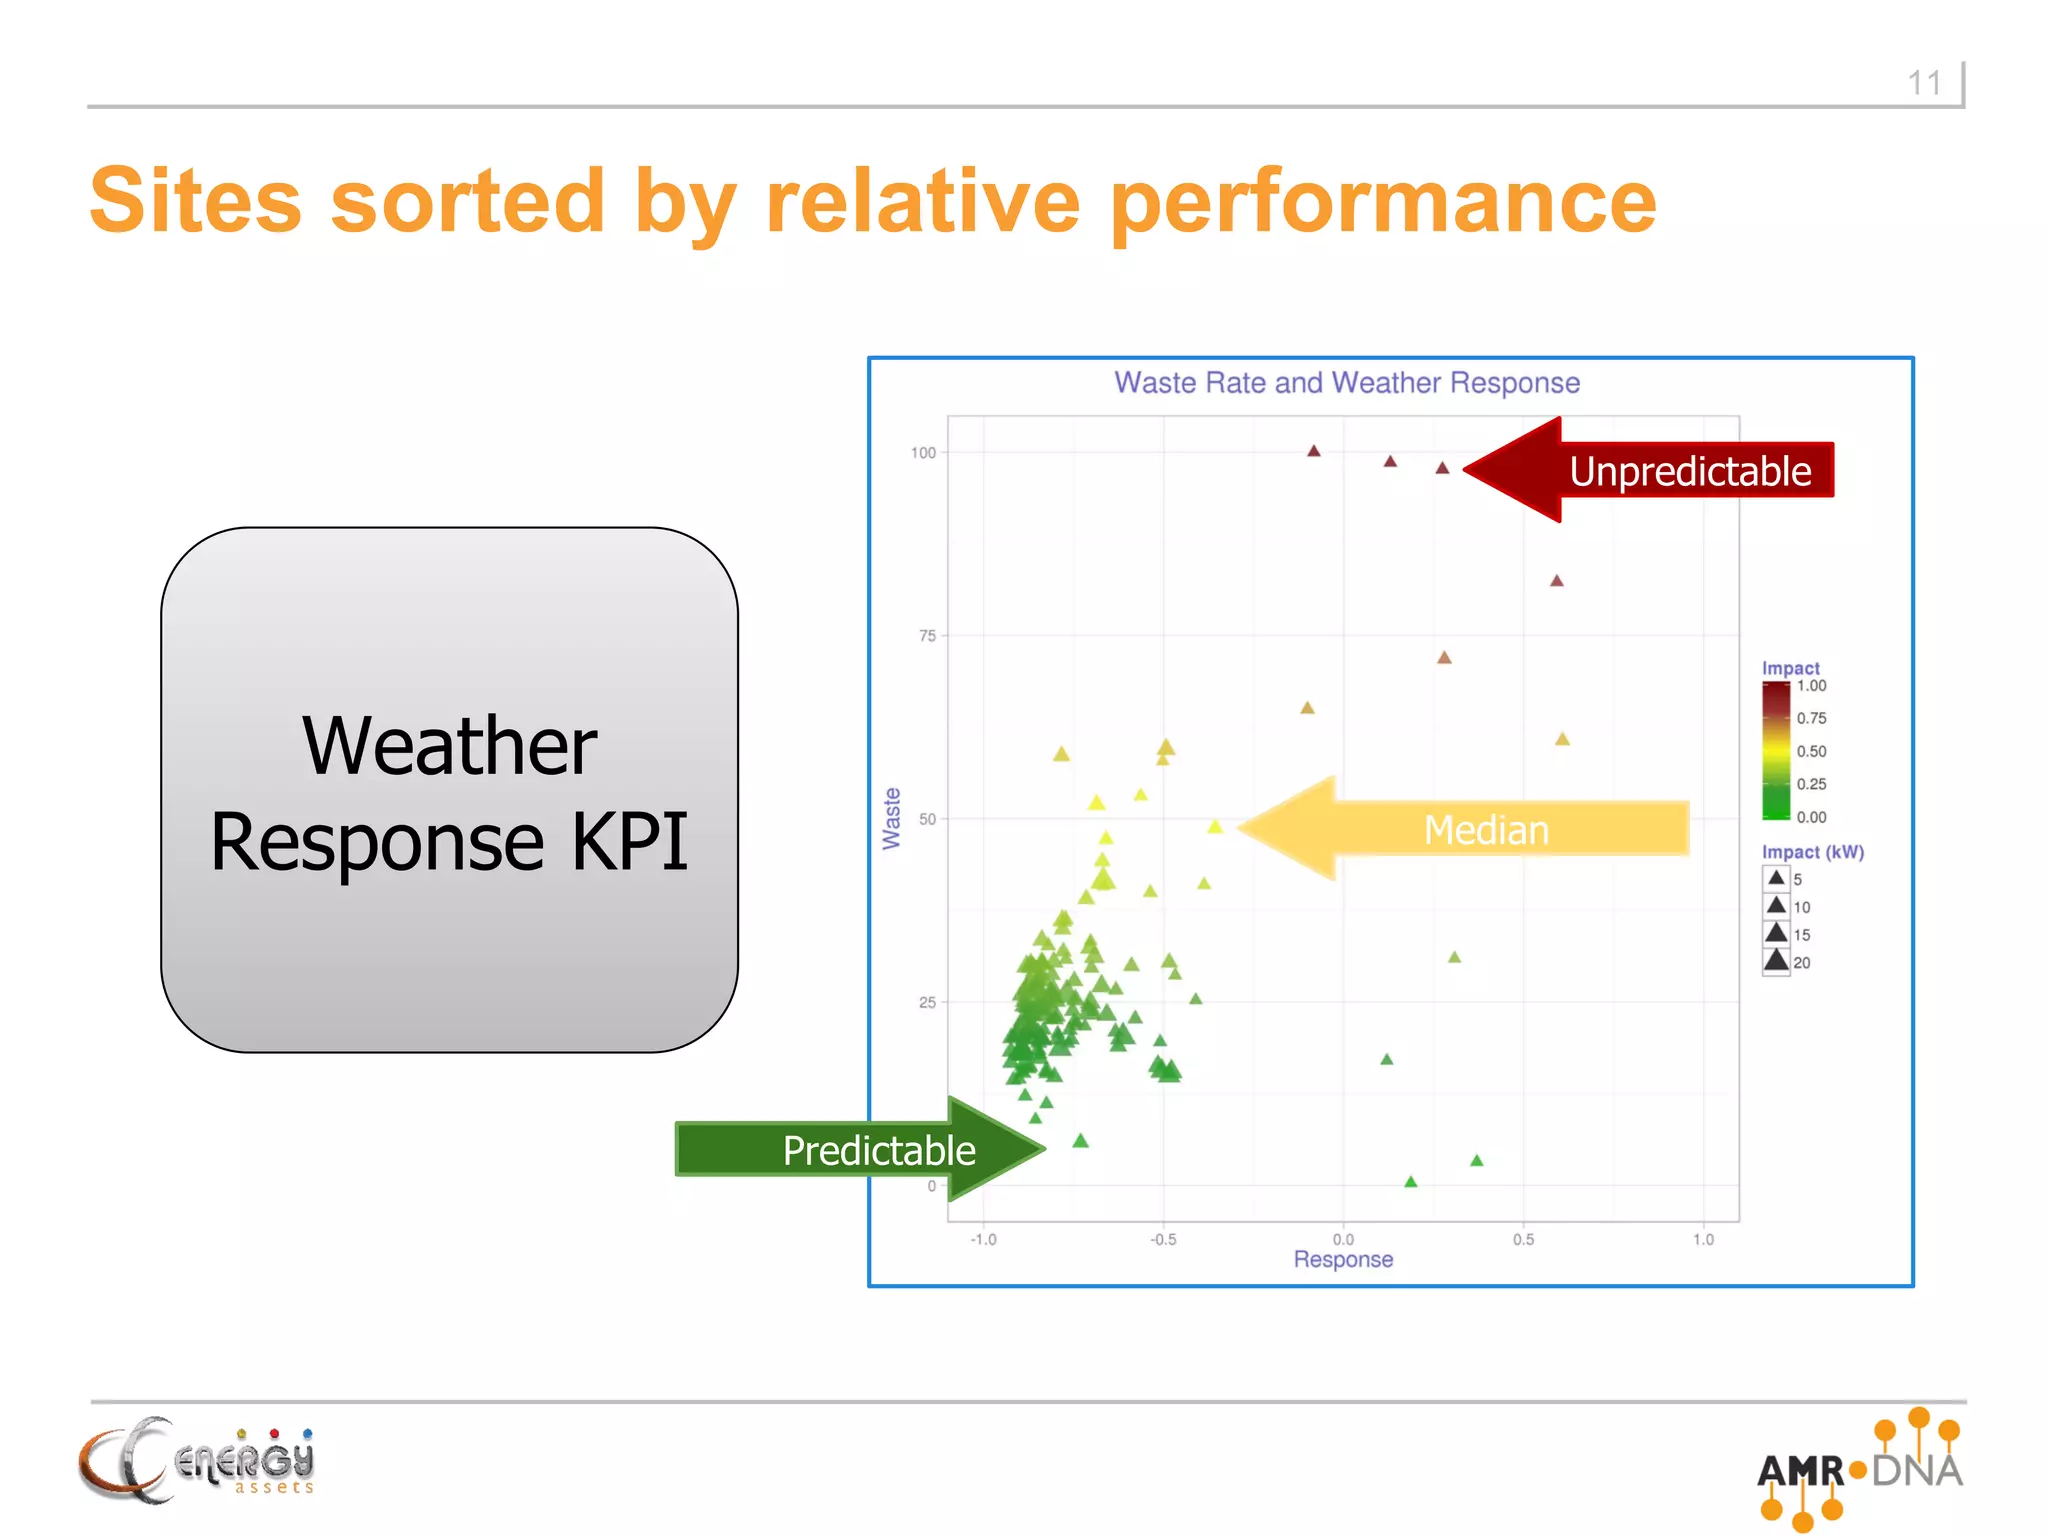
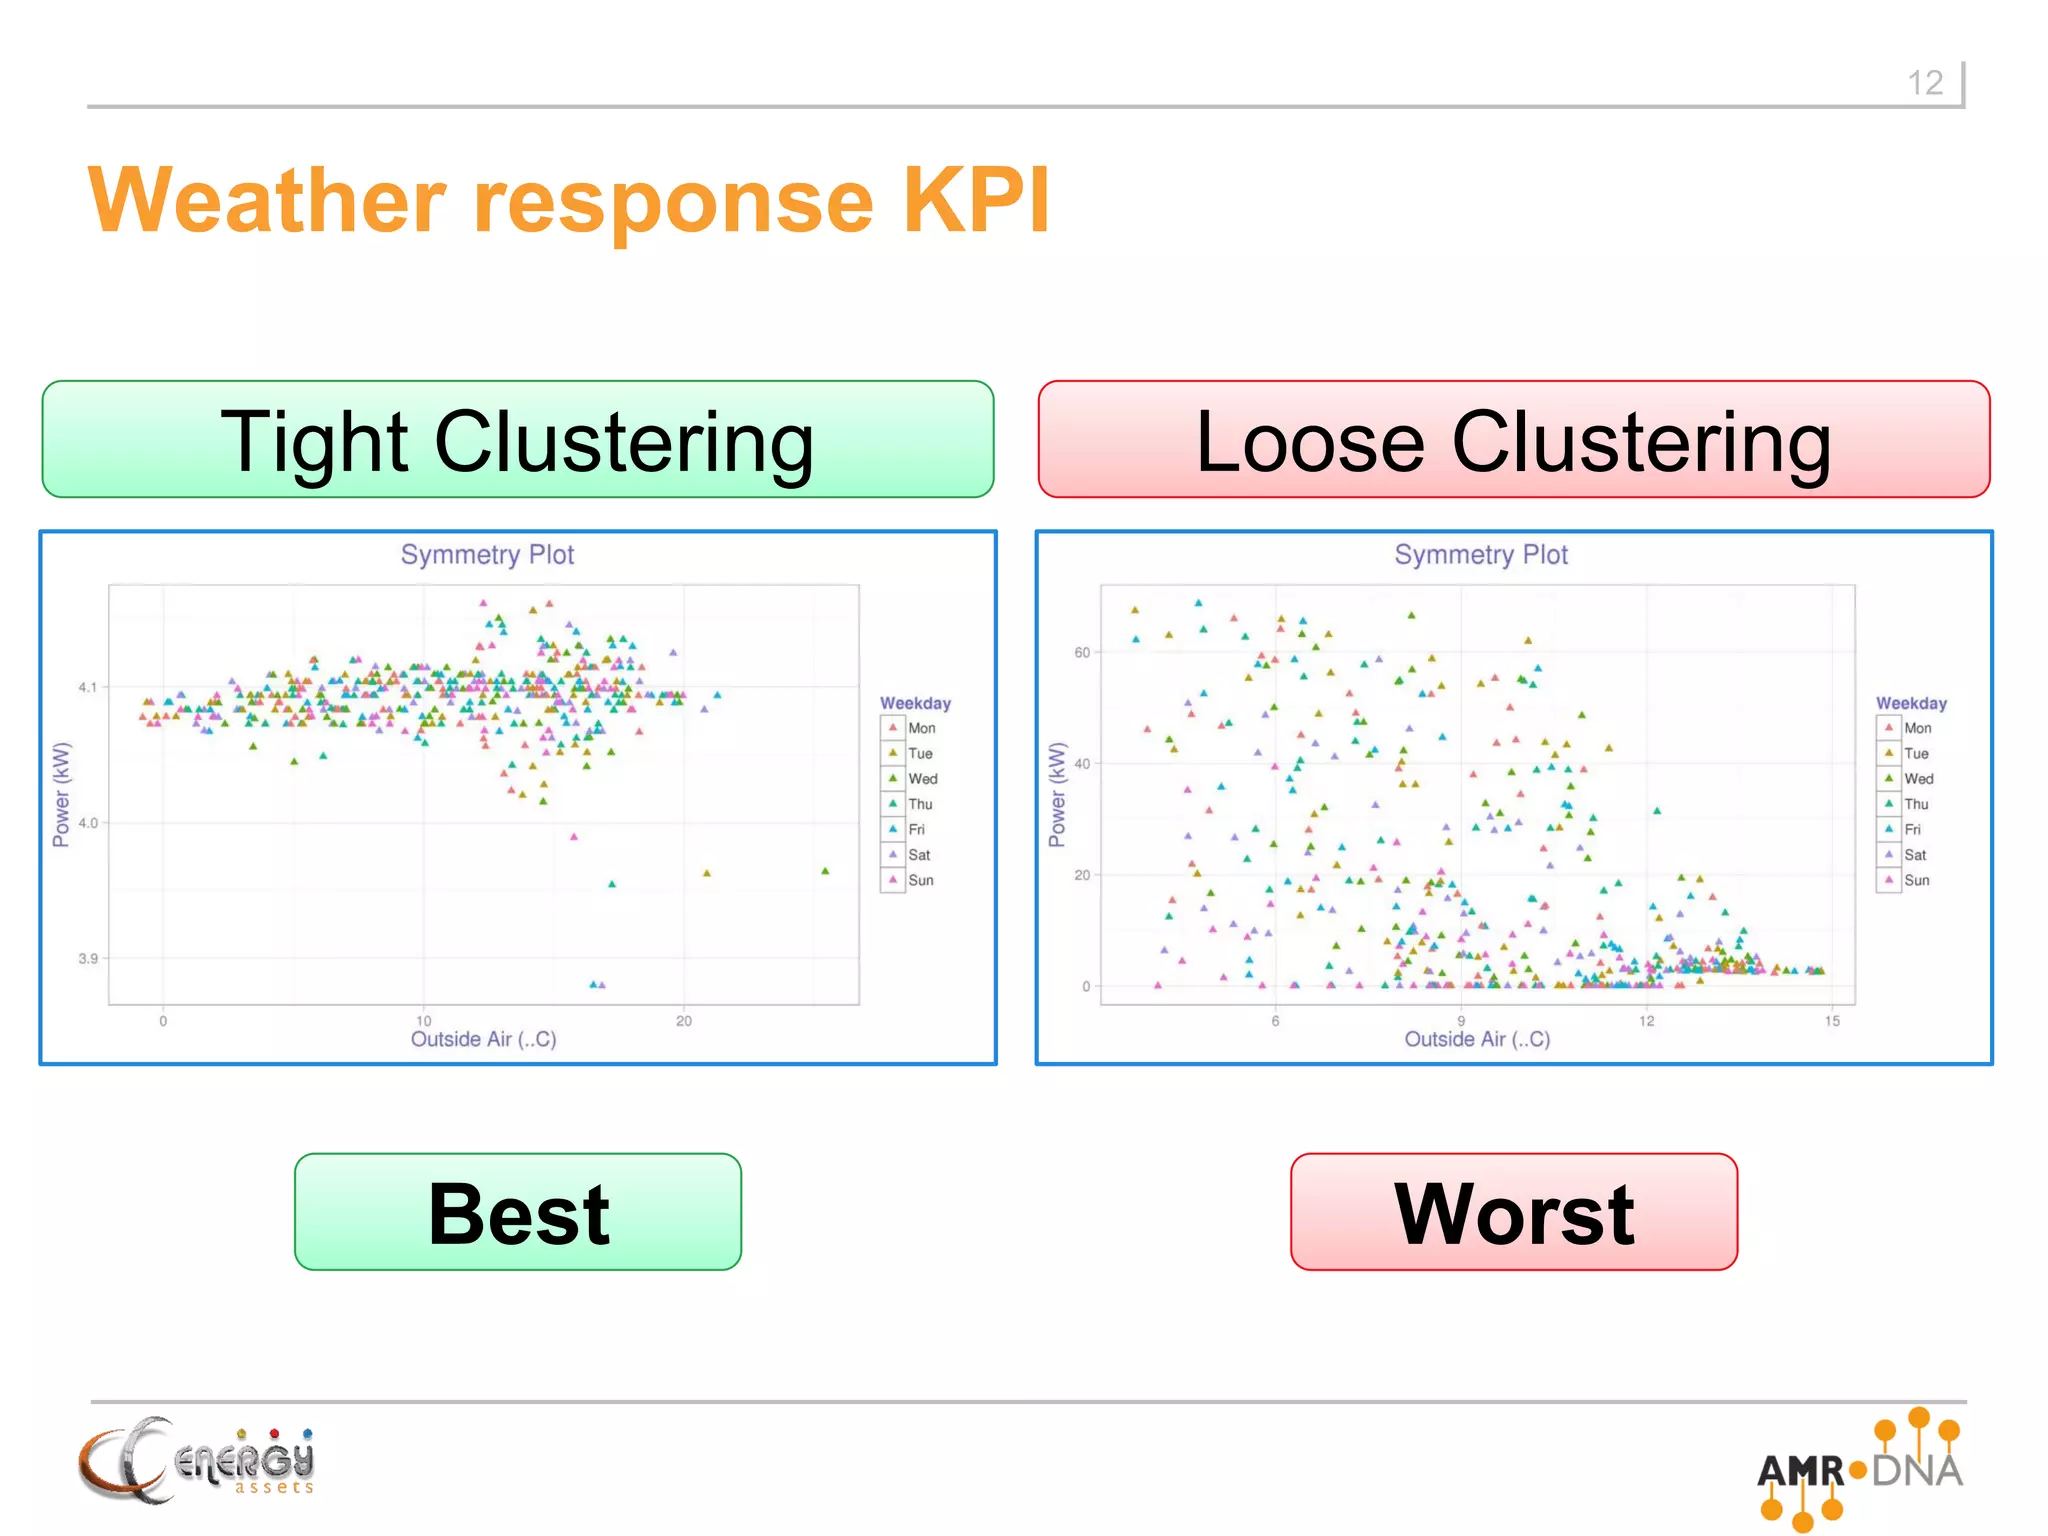
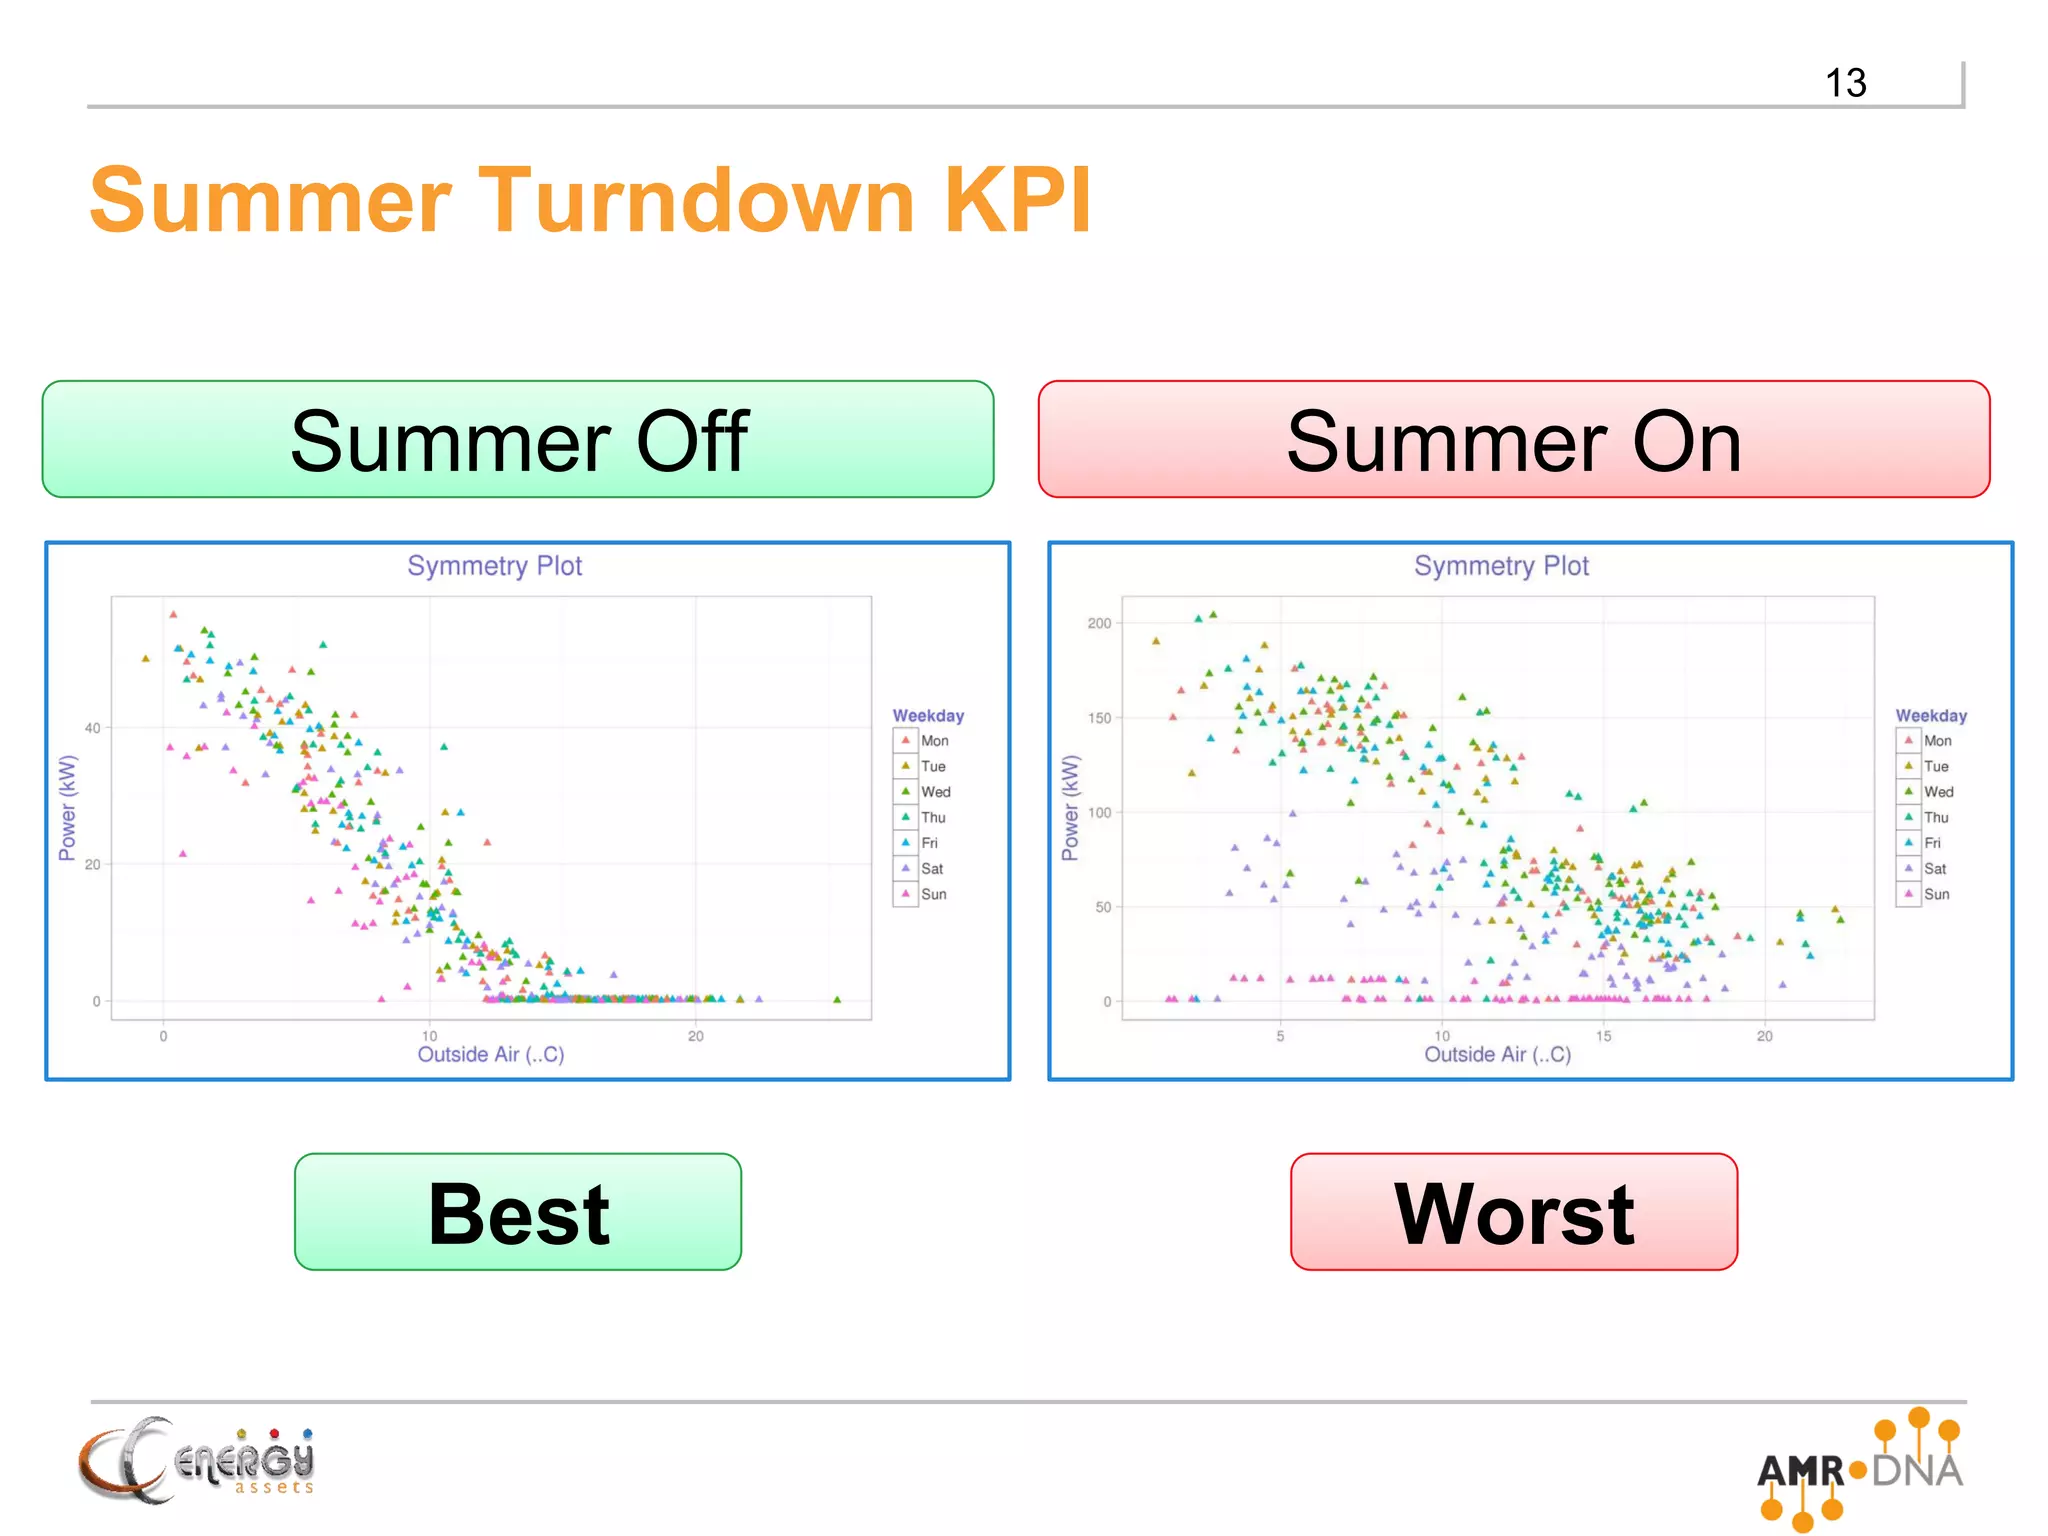
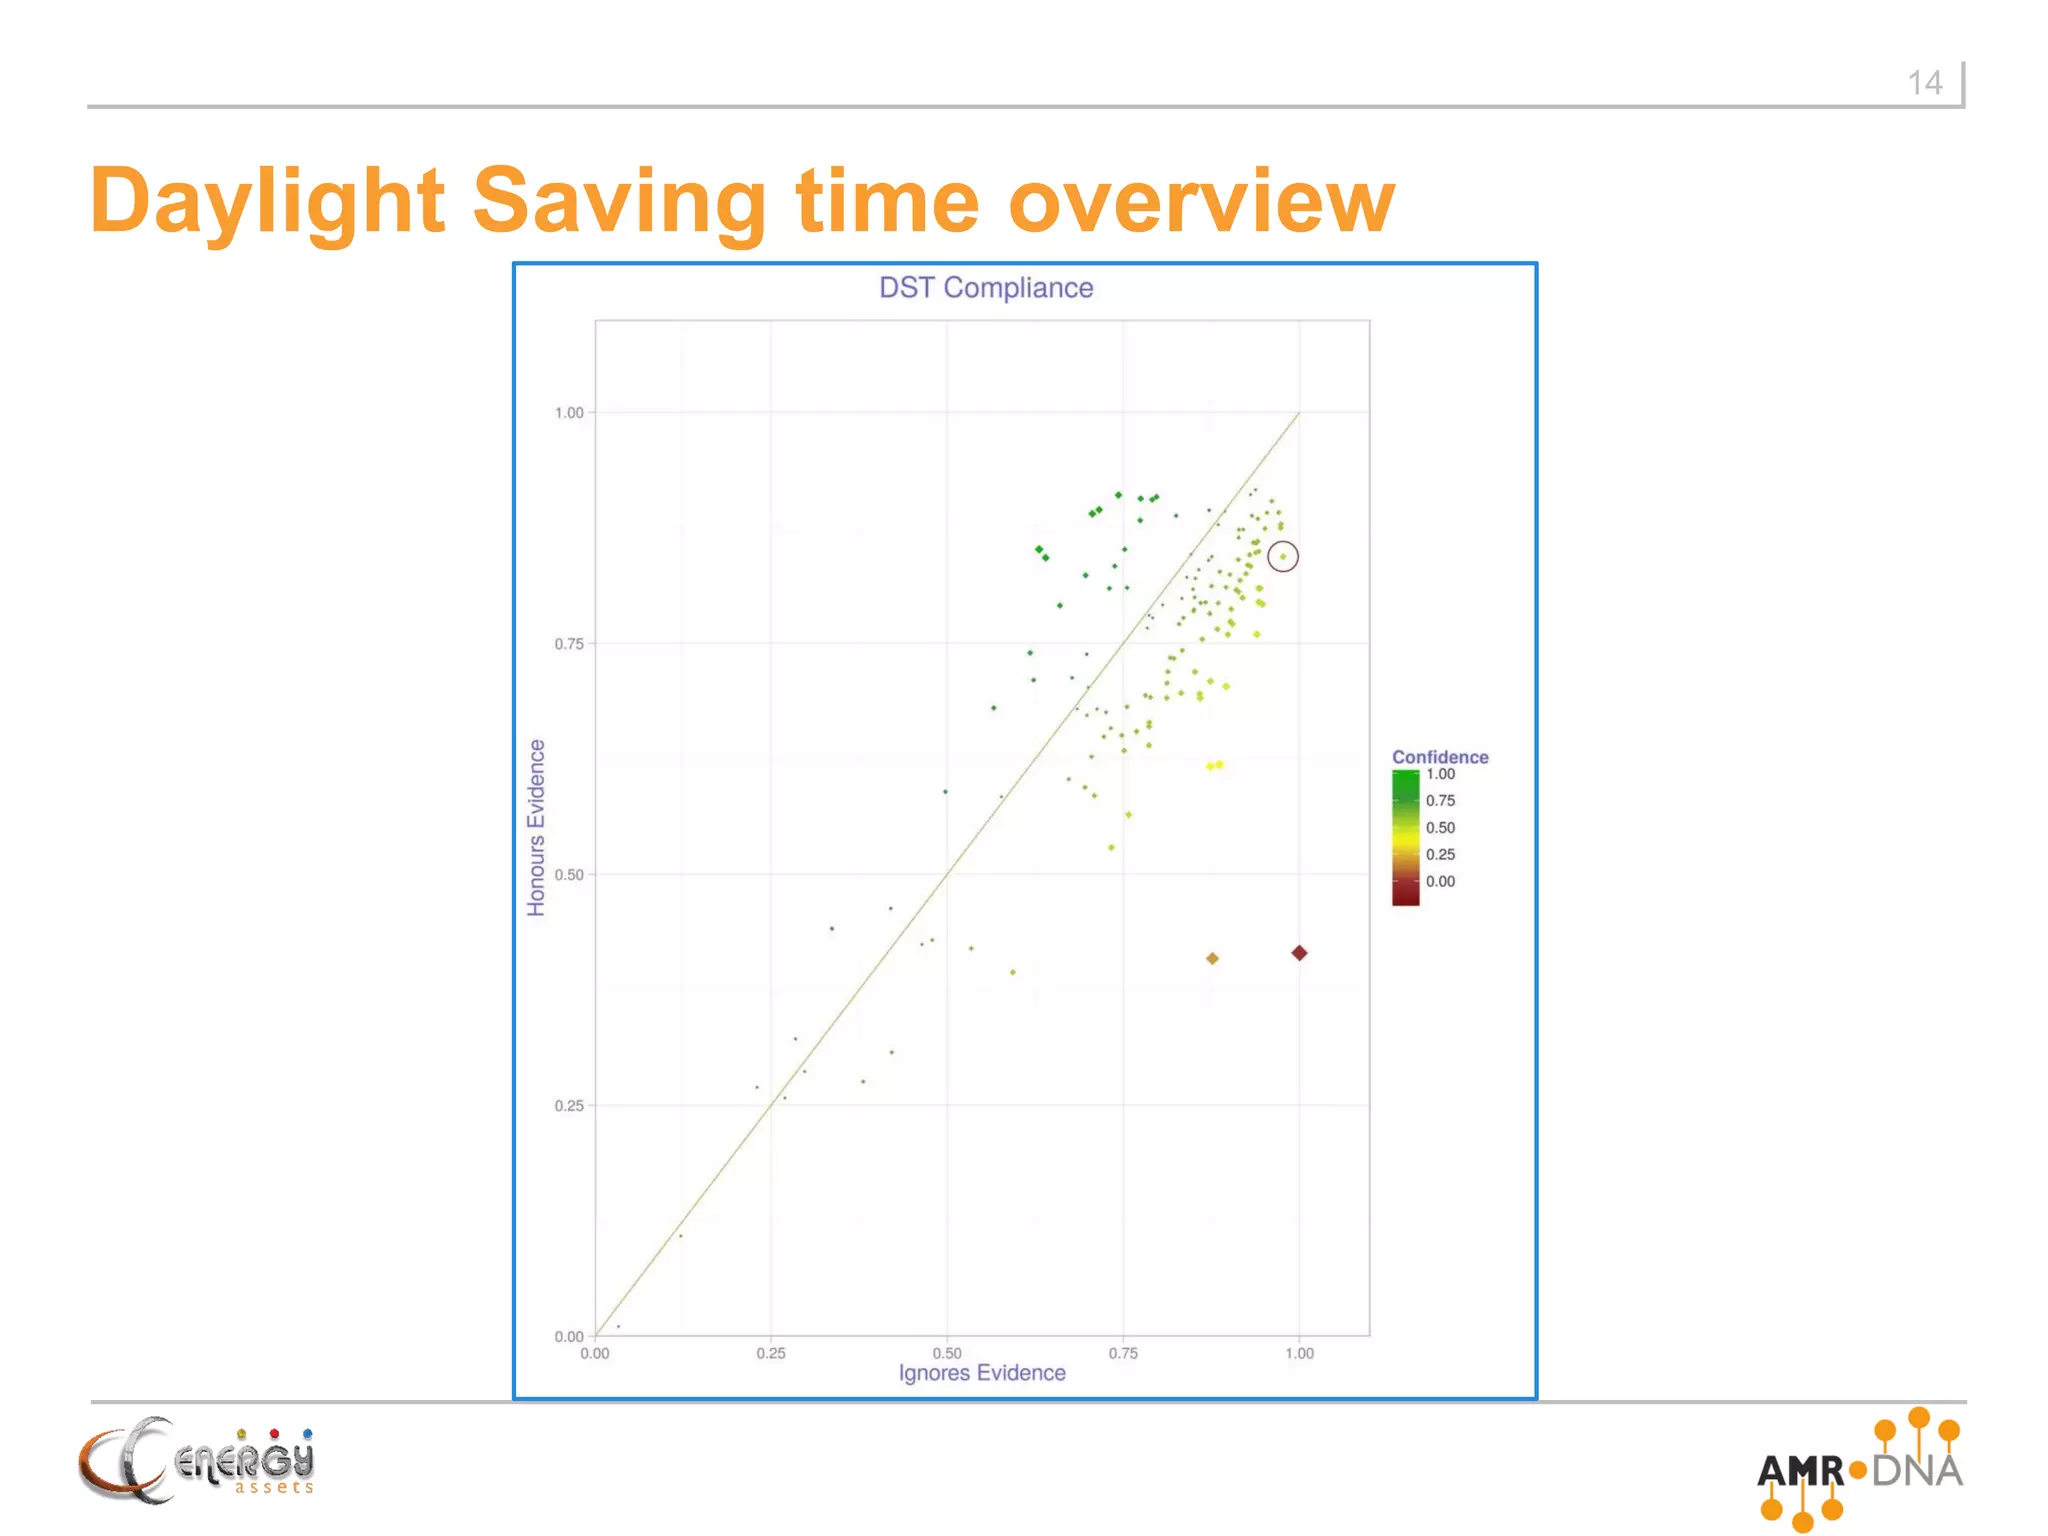
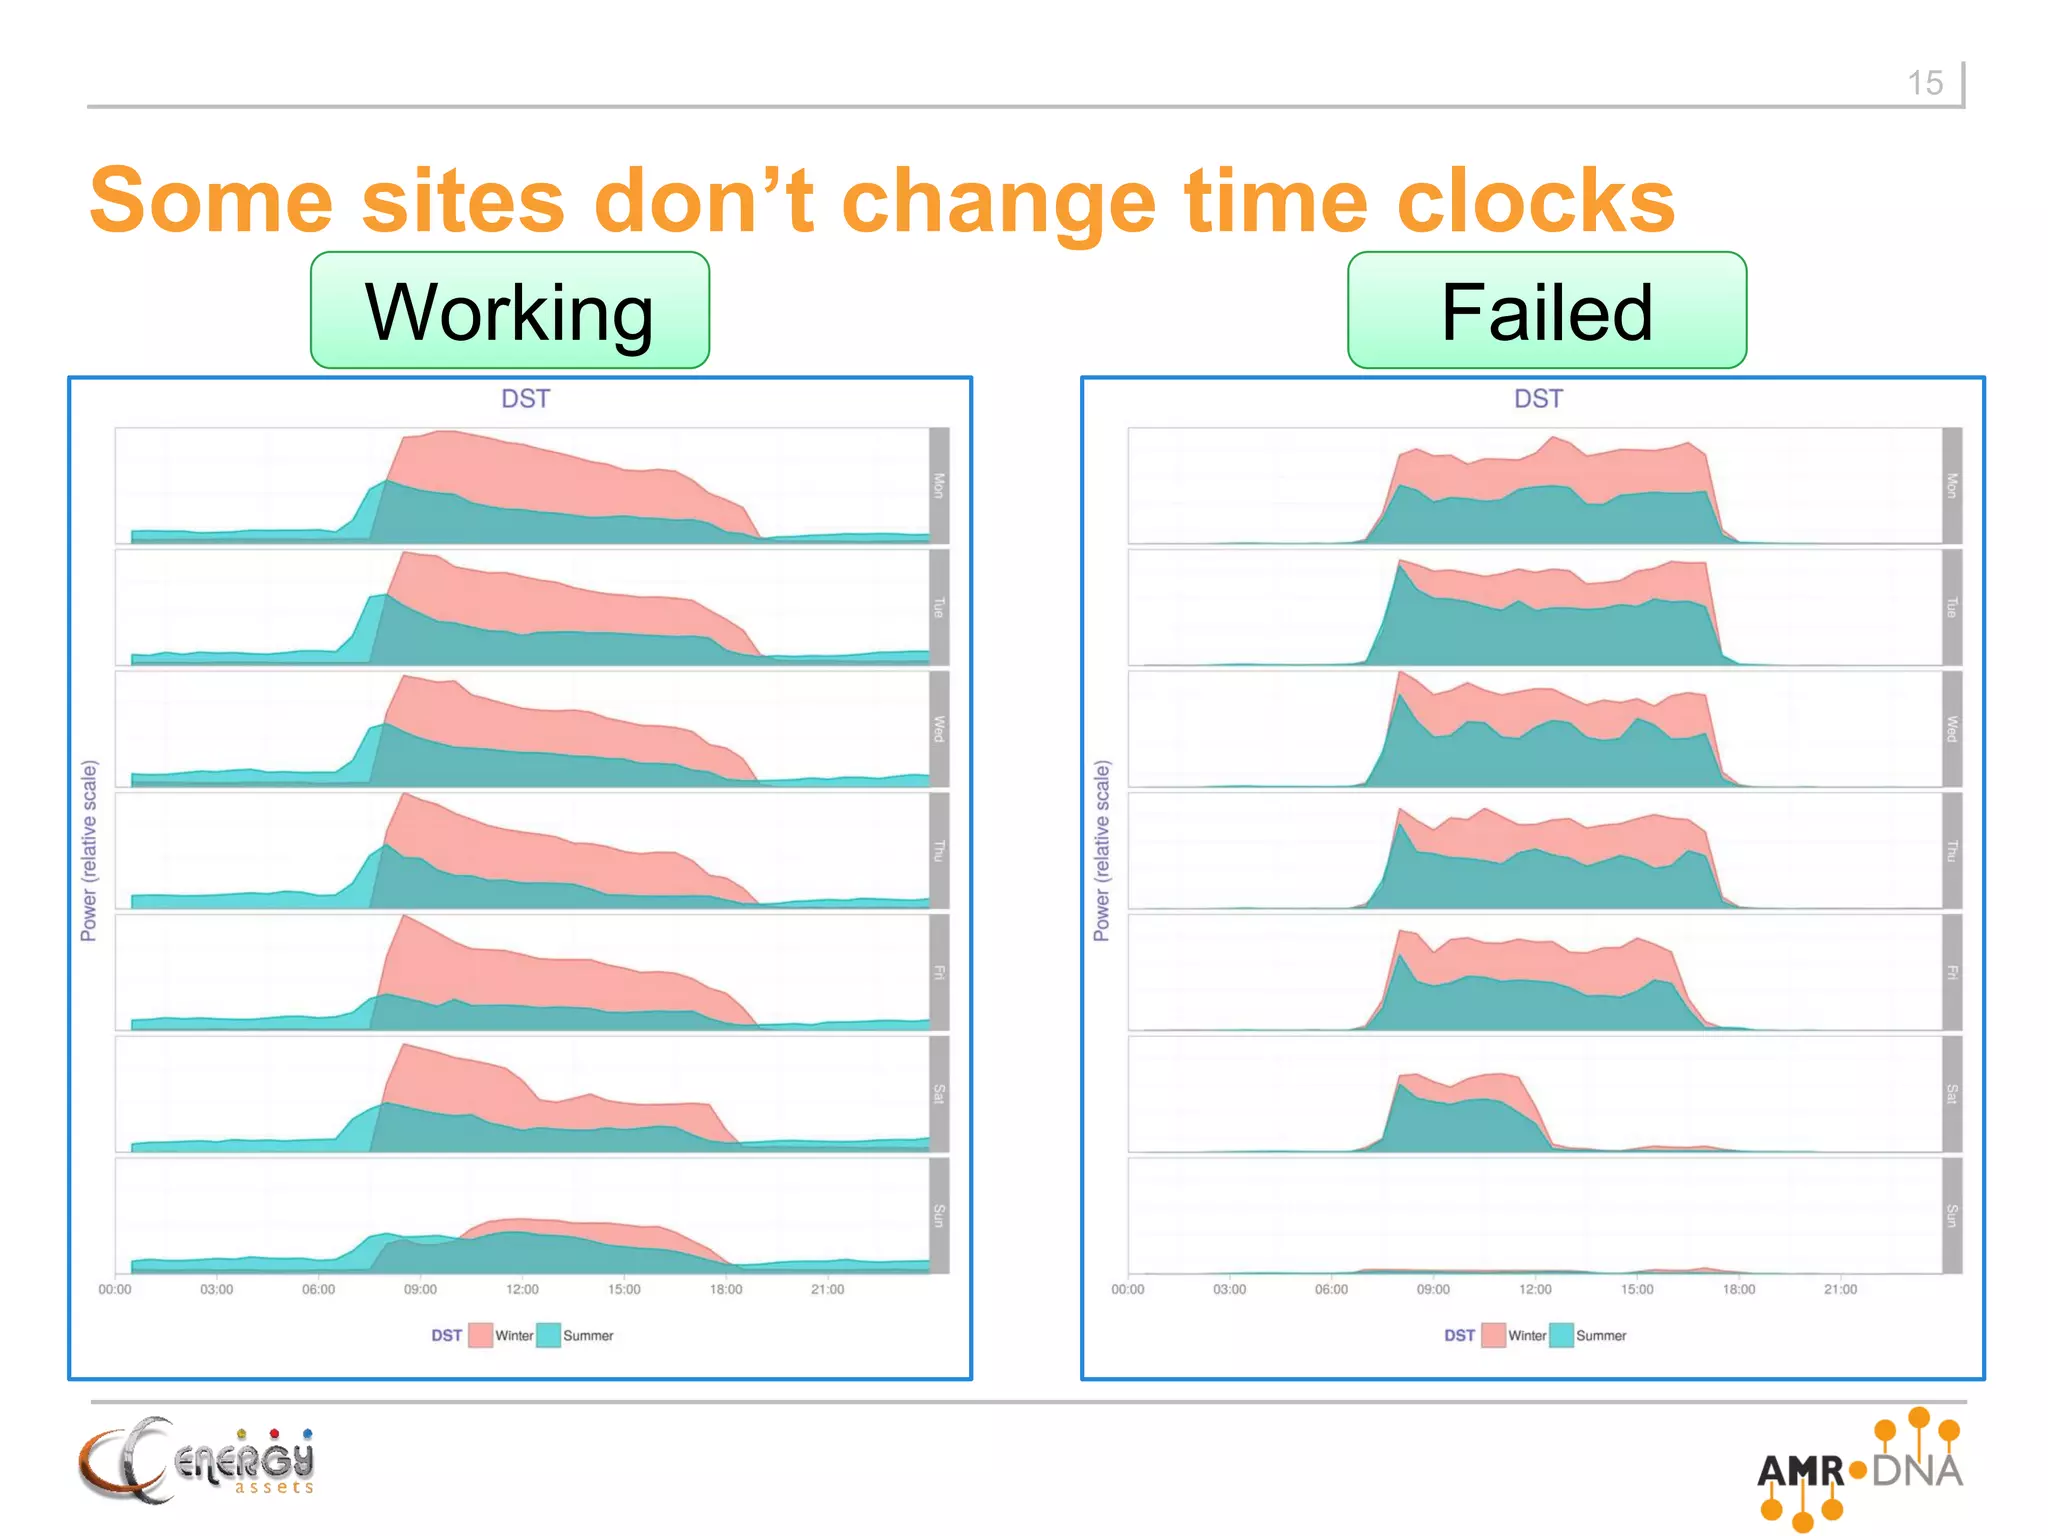
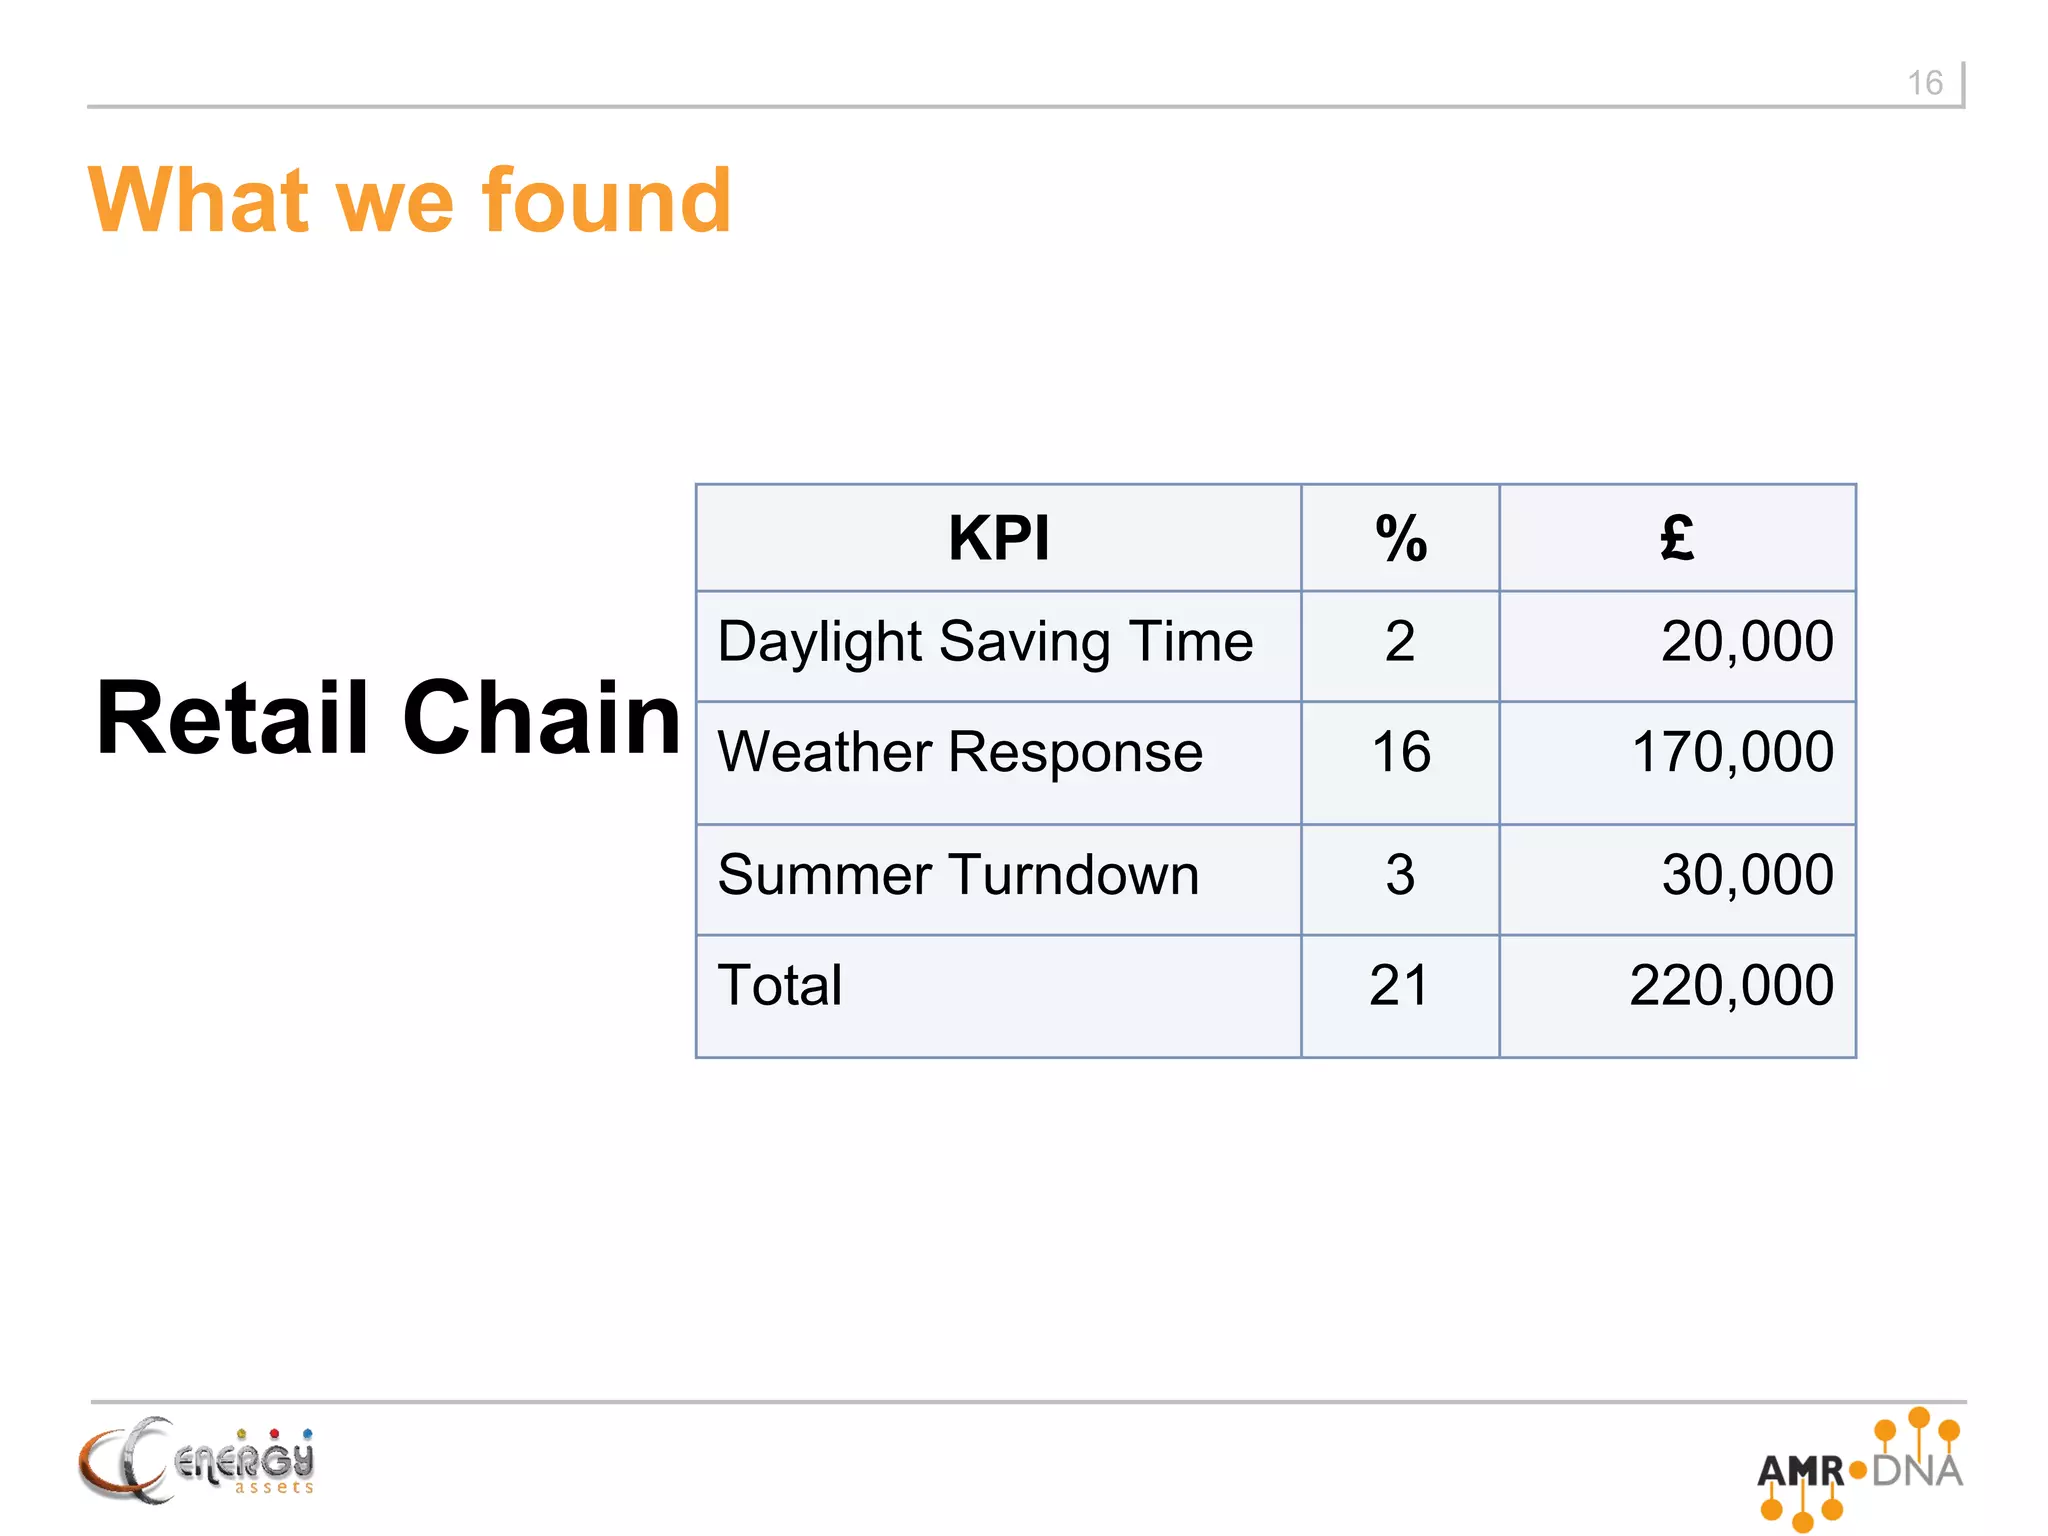
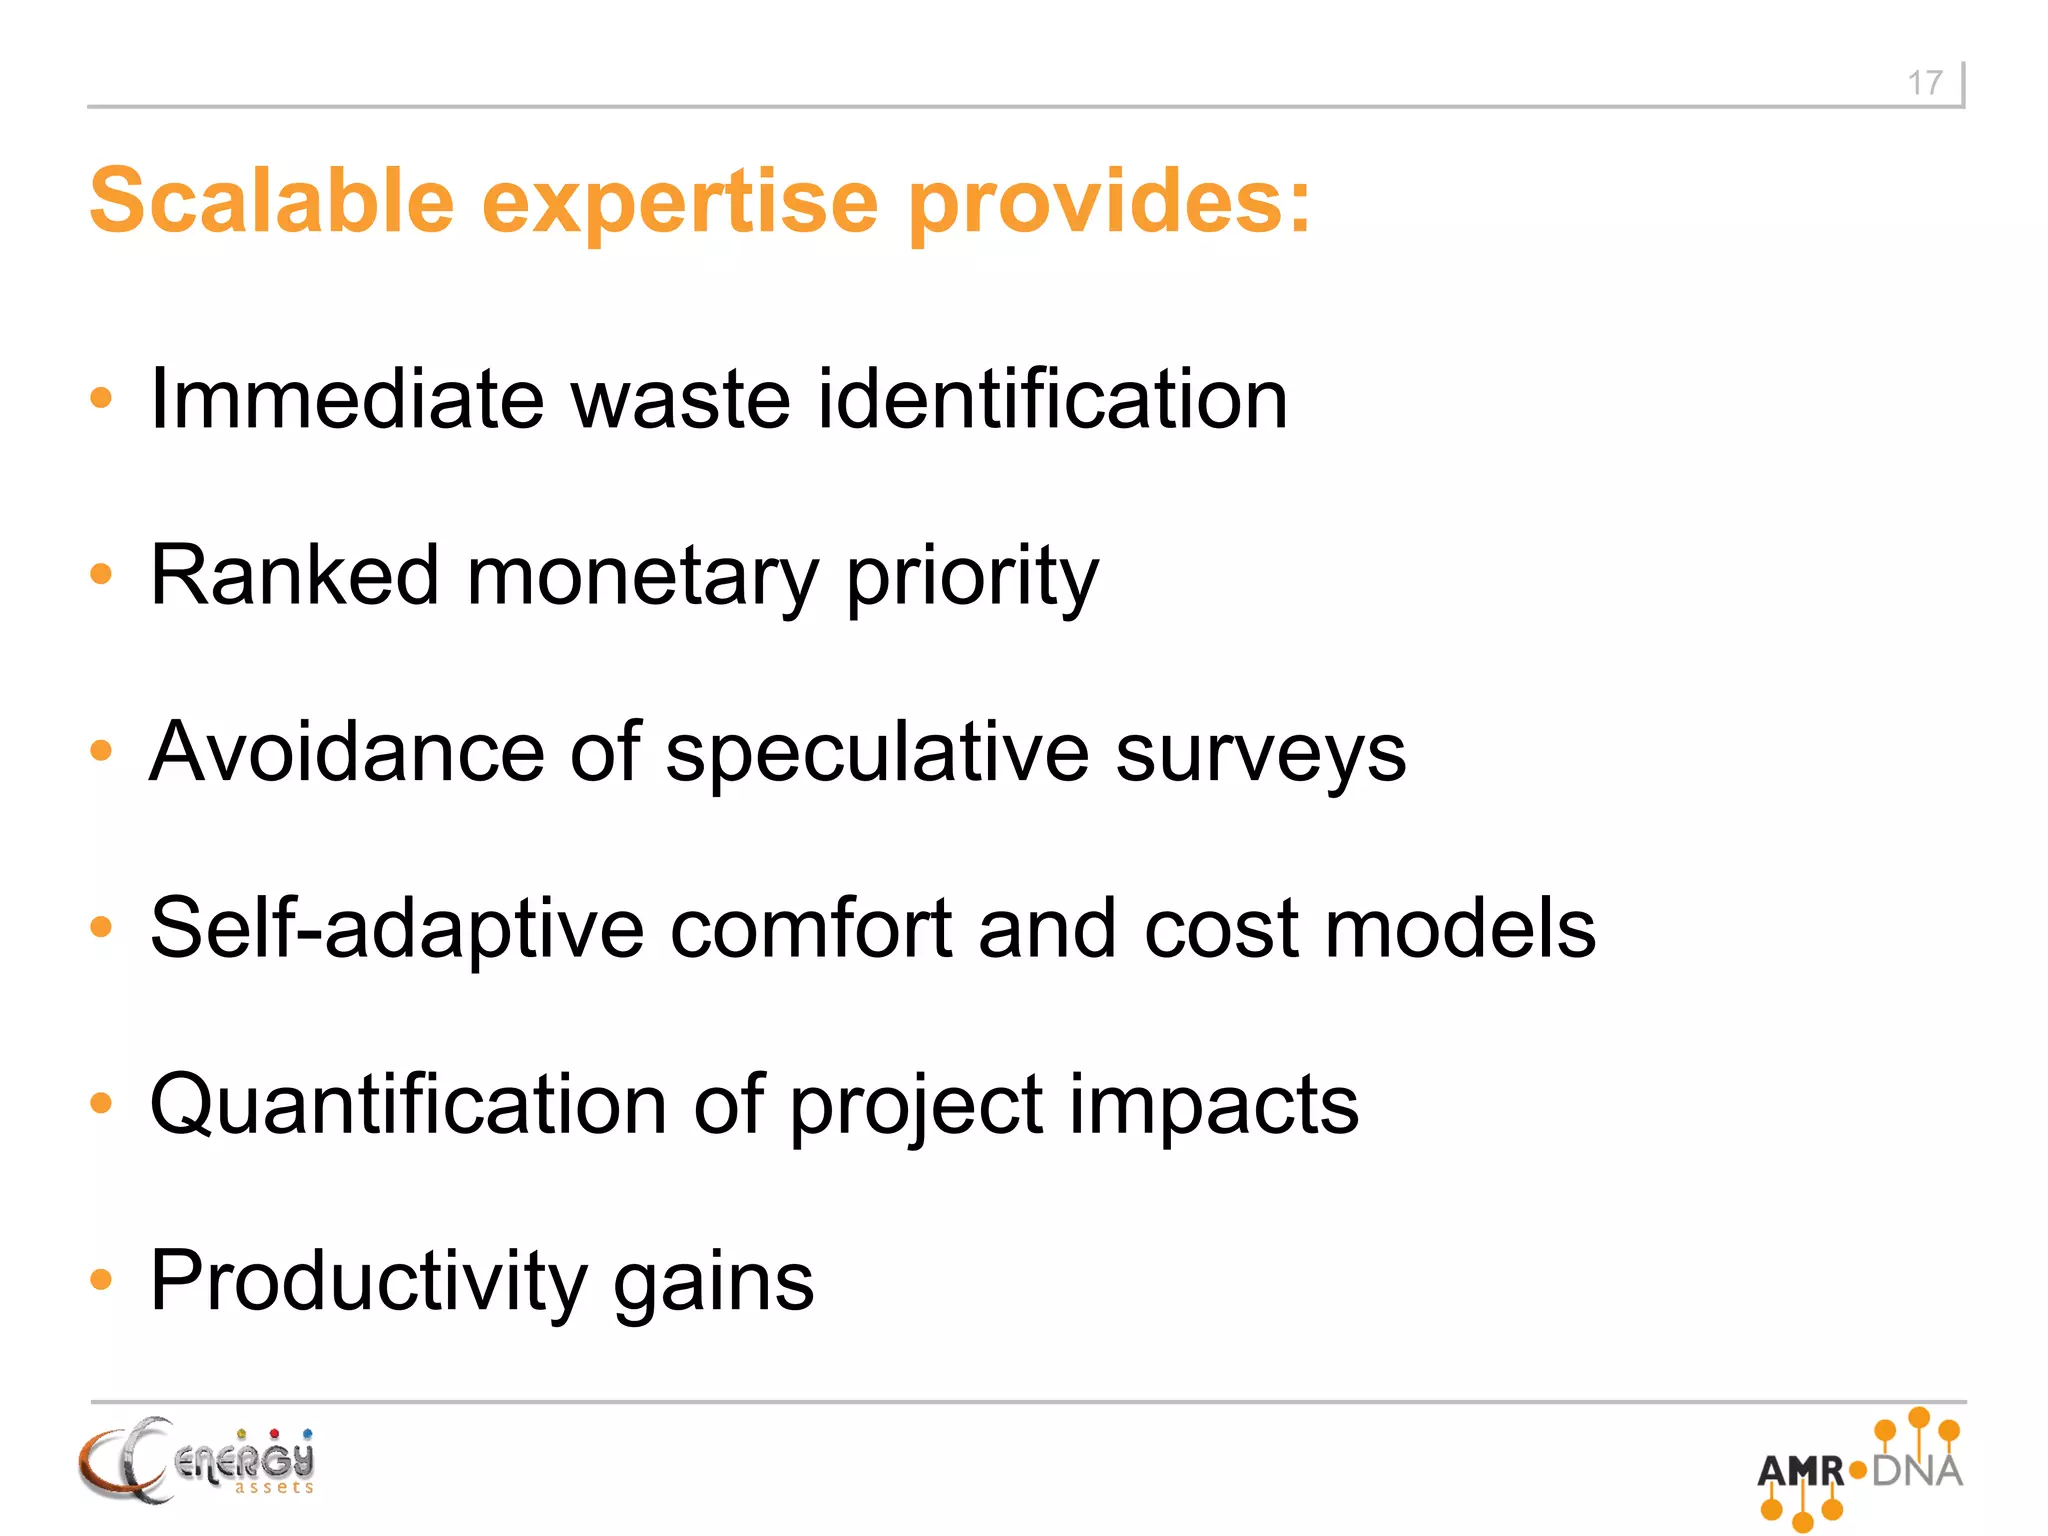
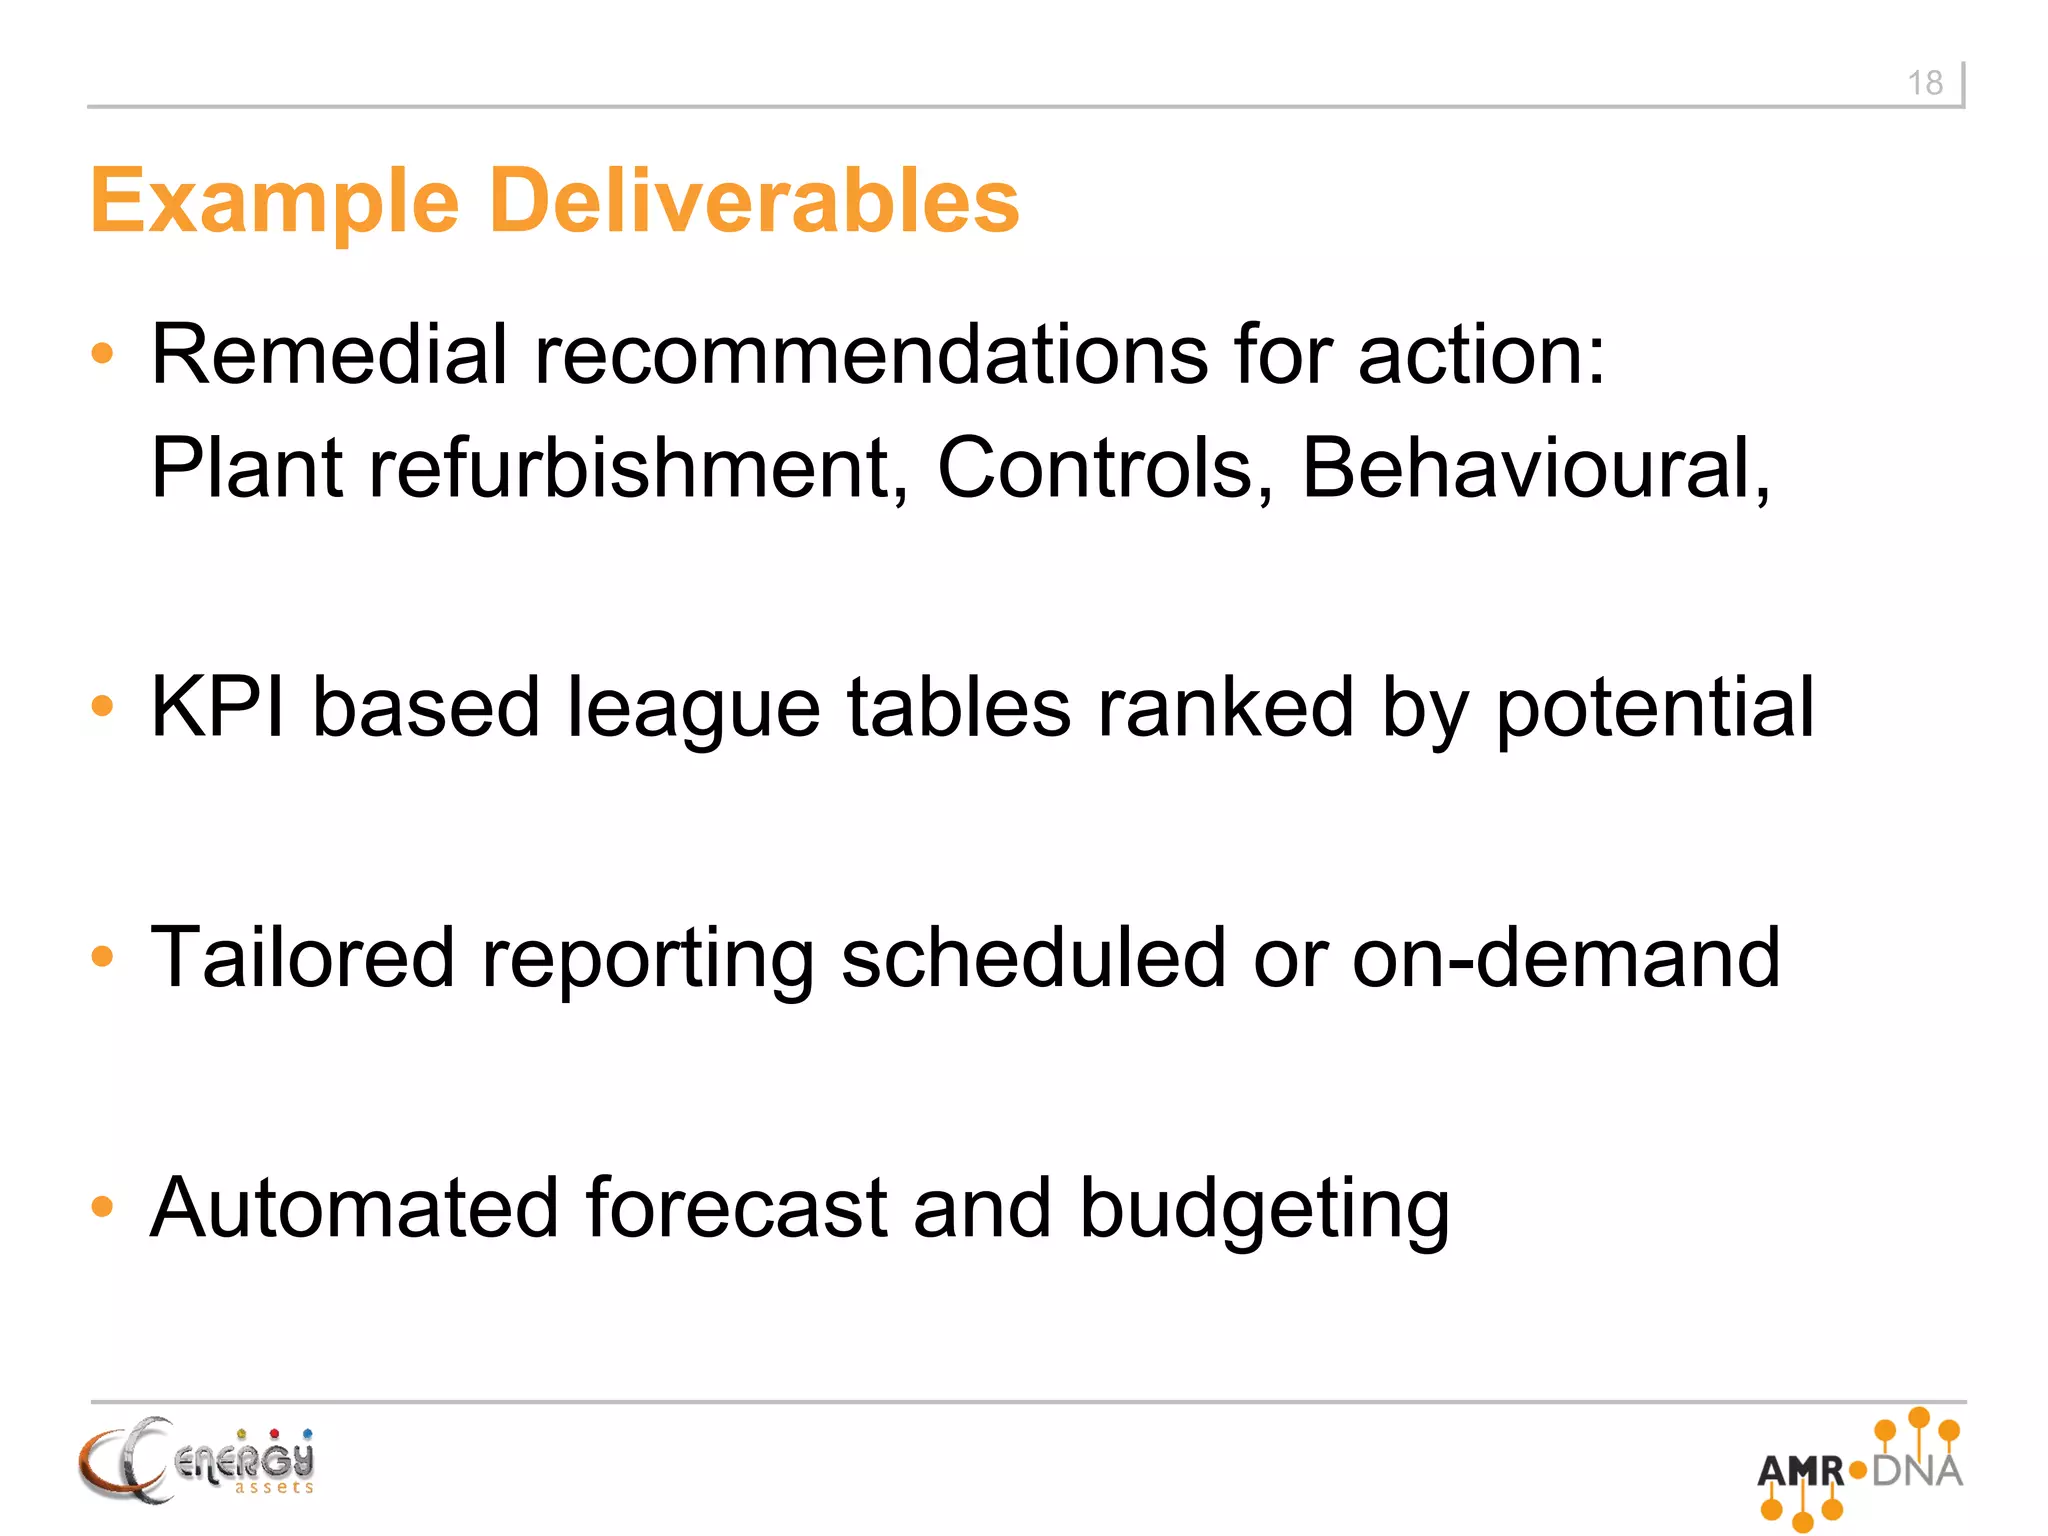


The document discusses the importance of utilizing data mining in energy management, emphasizing that effective measurement and pattern recognition are key to identifying waste and improving efficiency. It highlights challenges with traditional approaches and proposes automated tools for better monitoring and forecasting. The outcome includes actionable savings, productivity gains, and benefits for corporate social responsibility (CSR).


