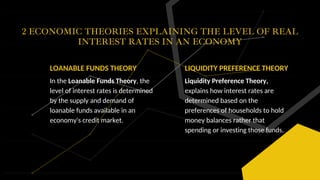
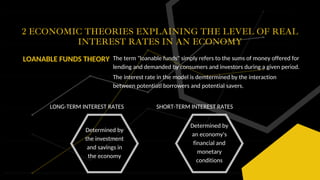
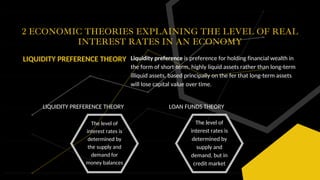
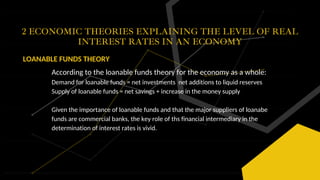
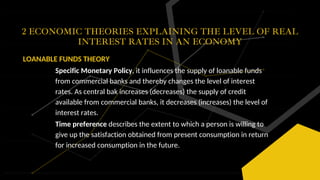
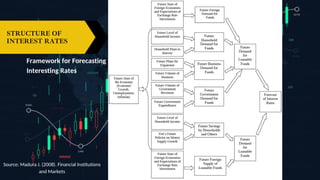
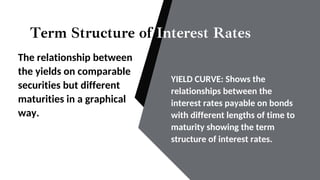
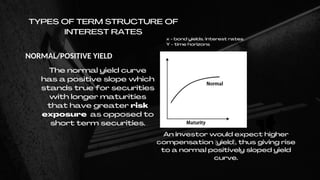
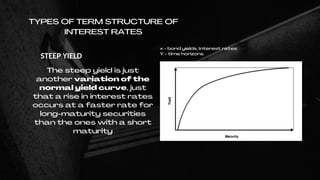
2. Interest rate determination
TABLE OF CONTENTS
Loanable funds theory
Level of interest rate in the economy
Liquidity preference theory
Understanding of the term structure of interest rates
Theories of term structure of interest rates
Spot rates and forward rates
Yield curves
3. 2.
3.
Learning
Objectives
1.
4.
Understand interest rates as one of
the key aspects of the financial
environment.
Explain the determinants of the
level of interest rates.
Explain the variety of interest
rates, and their term and
structure.
Distinguish the relationship between
interest rates and maturity of debt
instruments.
4. A rate of return paid by
a borrower of funds to a
lender of them, or a price
paid by a borrower for a
service, the right to make
use of funds for a
specified period.
One form of yield on
financial instruments.
INTEREST RATE
5. INTEREST RATE
Interest rate
at which the
banks are
lending - the
offer rate
Interest rate
payed for
deposits - the
bid rate
The
difference
between
them is
called
SPREAD.
6. INTEREST RATE
Interest rate
at which the
banks are
lending - the
offer rate
Interest rate
payed for
deposits - the
bid rate
It exists
between
selling and
buying rates
in local and
international
money and
capital
markets.
7. SPREAD
The spread is influenced by
the degree of competition
among financial institutions
The spread between offer
and bid rates provides a
cover for administrative
costs of the financial
intermediaries and
includes their profit.
8. SPREAD
The spread between banks
borrowing and ending rates
to their retail customers is
larger in general due to
considerably larger degree
of loan default risk.
The spread between offer
and bid rates provides a
cover for administrative
costs of the financial
intermediaries and
includes their profit.
9. SPREAD RATE V.S. BASE RATE
SPREAD OF INTEREST = LENDING RATE - DEPOSIT RATE
This covers operating costs for
banks providing loans and
deposits.
A negative spread is where a
deposit rate us higher than the
lending rate.
The base rate is the lowest rate at
which a bank will charge interest,
also known as the repo rate.
The rate is set by the monetary
policy with a view to controlling
inflation over the medium-term.
If the base rises, the rate of
interest charged on the loan will
rise to preserve the differential. If
it falls, so will the rate on the loan.
10. Risk Premium
An addition to the interest rate demanded by a lender to
take into account the risk that the borrower might
default on the loan entirely or may not repay on time
(default risk).
11. FACTORS THAT DETERMINE THE RISK PREMIUM FOR A
NON-GOVERNMENT SECURITY
perceived
ceditworthiness of
the issuer;
provisions of
securities such as
conversion
provision, call
provision, put
provision;
interest taxes;
expected
liquidity of a
security's issue
IN COMPARISON WITH THE GOVERNMENT SECURITY OF
THE SAME MATURITY
12. INTEREST RATE
STRUCTURE
Interest rate structure is the relationships between
the various rates of interest in an economy on
financial instruments of different lengths (terms) or
of different degress of risk.
Interest rate structure is assumed as stable and are
likely to move in the same direction in the
economy.
13. Nominal interest rate the
amount, in percentage
terms, of interest payable.
Real interest rate is the
difference between the nominal
rate of interest and the expected
rate of inflation.
It is a measure of the anticipated
opportunity cost of borrowing in
terms of goods ad services
forgone.
NOMINAL INTEREST RATE REAL INTEREST RATE
14. Year 10
34.9%
Year 7
27.9%
Year 5
23.3%
Year 3
9.3%
Year 1
4.7%
The Fiser Effect combines the real rate of interest and
expected inflation to create a (risk-free) nominal interest
rate.
Fisher Effect
Hence, the nominal interest rate is the market interest rate -
the rate you either pay or earn
15. The dependence between the real and nominal interest
rates is expressed using he following equation:
NOMINAL INTEREST RATE REAL INTEREST RATE
i = (1 + r) (1 + i ) - 1
e
where i is the nominal rate of interest, r is the real rate
of interest and , e is the expected rate of inflation.
i
e
16. Example:
Assume that a bank is providing a company with a loan of 1000 thous.
Euro for one year at a real rate of interest of 3%. At the end of the
year it expects to receive back 1030 thous. Euro of purchasing power
at current prices. However, if the bank expects a 10% rate of inflation
over the next year, it will want 1133 thous. Euro back (10% above
1030 thous. Euro). The interest rate required by the bank would be
13.3%.
i = (1 + 0.03)(1 + 0.1) - 1
= (1.03)(1.1) - 1
= 1.133 - 1
= 0.133 or 13.3%
17. When simplified, the equation becomes: i + r = i e
In the example, this would give 3% plus 10% = 13%.
The real rate of return is thus: r = i - i
When the assumption is made that r is stable over time, the equation
provides the Fisher effect. It suggests that changes in shirt-term interest
rates occur because of changes in the expected rate of inflation. If a
further assumption is made that expectations about the rate of inflation of
market participants are correct, then the key reason for changes in
interest rate is the changes in the current rate of inflation.
e
18. Year 10
34.9%
Year 7
27.9%
Year 5
23.3%
Year 3
9.3%
Year 1
4.7%
( l + r ) = (1 + R ) (1 + E ( i ) )
Fisher Equation
r = nominal interest rate
R = real rate of interest
E (i) = expectd annual rate of inflation
solving for r,
r = R + E ( i ) + ( R * E ( I ) )
19. Year 10
34.9%
Year 7
27.9%
Year 5
23.3%
Year 3
9.3%
Year 1
4.7%
If the borrower and lender agree that R = 6% and E = 7%, then
what would be the contract interest rate for a one-year loan?
Example: Loan Contract Interest Rate
Using the Fisher Equation, the contract is:
r = 0.06 + 0.07 + (0.06 * 0.07) = 0.1342 or 13.42%
20. 2 ECONOMIC THEORIES EXPLAINING THE LEVEL OF REAL
INTEREST RATES IN AN ECONOMY
LOANABLE FUNDS THEORY
In the Loanable Funds Theory, the
level of interest rates is determined
by the supply and demand of
loanable funds available in an
economy's credit market.
LIQUIDITY PREFERENCE THEORY
Liquidity Preference Theory,
explains how interest rates are
determined based on the
preferences of households to hold
money balances rather that
spending or investing those funds.
21. 2 ECONOMIC THEORIES EXPLAINING THE LEVEL OF REAL
INTEREST RATES IN AN ECONOMY
LOANABLE FUNDS THEORY The term "loanable funds" simply refers to the sums of money offered for
lending and demanded by consumers and investors during a given period.
The interest rate in the model is demtermined by the interaction
between potentiatl borrowers and potential savers.
LONG-TERM INTEREST RATES
Determined by
the investment
and savings in
the economy
SHORT-TERM INTEREST RATES
Determined by
an economy's
financial and
monetary
conditions
22. 2 ECONOMIC THEORIES EXPLAINING THE LEVEL OF REAL
INTEREST RATES IN AN ECONOMY
LIQUIDITY PREFERENCE THEORY Liquidity preference is preference for holding financial wealth in
the form of short-term, highly liquid assets rather than long-term
illiquid assets, based principally on the fer that long-term assets
will lose capital value over time.
LIQUIDITY PREFERENCE THEORY
The level of
interest rates is
determined by
the supply and
demand for
money balances
LOAN FUNDS THEORY
The level of
interest rates is
determined by
supply and
demand, but in
credit market
23. 2 ECONOMIC THEORIES EXPLAINING THE LEVEL OF REAL
INTEREST RATES IN AN ECONOMY
LOANABLE FUNDS THEORY
According to the loanable funds theory for the economy as a whole:
Demand for loanable funds = net investments net additions to liquid reserves
Supply of loanable funds = net savings + increase in the money supply
Given the importance of loanable funds and that the major suppliers of loanabe
funds are commercial banks, the key role of ths financial intermediary in the
determination of interest rates is vivid.
24. 2 ECONOMIC THEORIES EXPLAINING THE LEVEL OF REAL
INTEREST RATES IN AN ECONOMY
LOANABLE FUNDS THEORY
Specific Monetary Policy, it influences the supply of loanable funds
from commercial banks and thereby changes the level of interest
rates. As central bak increases (decreases) the supply of credit
available from commercial banks, it decreases (increases) the level of
interest rates.
Time preference describes the extent to which a person is willing to
give up the satisfaction obtained from present consumption in return
for increased consumption in the future.
25. FACTORS THAT AFFECT THE
CHANGE OF THE STRUCTURE
OF INTEREST RATE
TIME PERIOD
DEGREE OF RISK
TRANSACTION COSTS ASSOCIATED WITH
DIFFERENT FINANCIAL NSTRUMENTS
STRUCTURE OF INTEREST RATE
26. FACTORS THAT AFFECT THE
CHANGE OF THE STRUCTURE
OF INTEREST RATE
the behavior of the yield curve
composition of the maturity structure
sensitivity of the change in the interest rate,
and, default risk included and its relationship
with the yield curve
STRUCTURE OF INTEREST RATE
28. Term Structure of Interest Rates
The relationship between
the yields on comparable
securities but different
maturities in a graphical
way.
YIELD CURVE: Shows the
relationships between the
interest rates payable on bonds
with different lengths of time to
maturity showing the term
structure of interest rates.
29. TYPES OF TERM STRUCTURE OF
INTEREST RATES
NORMAL/POSITIVE YIELD
The normal yield curve
has a positive slope which
stands true for securities
with longer maturities
that have greater risk
exposure as opposed to
short term securities.
An investor would expect higher
compensation (yield), thus giving rise
to a normal positively sloped yield
curve.
x - bond yields/interest rates
Y - time horizons
30. TYPES OF TERM STRUCTURE OF
INTEREST RATES
STEEP YIELD
The steep yield is just
another variation of the
normal yield curve, just
that a rise in interest rates
occurs at a faster rate for
long-maturity securities
than the ones with a short
maturity
x - bond yields/interest rates
Y - time horizons
31. TYPES OF TERM STRUCTURE OF
INTEREST RATES
INVERTED/NEGATIVE YIELD
An inverted curve forms
when there is a high
expectation of long-
maturity yields falling
below short maturity
yields in the future.
An inverted yield curve is an
important indicator of the imminent
economic slowdown
x - bond yields/interest rates
Y - time horizons
32. TYPES OF TERM STRUCTURE OF
INTEREST RATES
HUMPED/BELL-SHAPED YIELD
This type of curve is a
typical and very
infrequent. It indicated
that yields for medium-
term maturity are higher
than both long and short
terms, eventually a
slowdown.
x - bond yields/interest rates
Y - time horizons
33. TYPES OF TERM STRUCTURE OF
INTEREST RATES
FLAT CURVE
A flat curve indicates
similar returns for long-
term, medium-term, and
short-term maturities.
x - bond yields/interest rates
Y - time horizons
34. THE EXPECTATIONS THEORY/PURE EXPECTATIONS THEORY
EXAMPLE: A 3-year bond would yield
approximately the same return
as three 1-year bonds.
TERM STRUCTURE THEORIES
Expectations theory states that current long-term rates can
be used to predict short-term rates of future. It simplifies
the return of one bond as a combination of the return of
other bonds.
35. Year 10
34.9%
Year 7
27.9%
Year 5
23.3%
Year 3
9.3%
Year 1
4.7%
E ( i ) Supply of funds provided by investors in short-term (such as 3-month) markets, and in long-term
markets. Therefore, the yield curve becomes upward sloping as shown here.
Market for 3-Month
(Short term)
Risk-free Debt
Impact of a Sudden Expectation of Higher Interest Rates
Market for 3-Month
(Short term)
Risk-free Debt
Market for 3-Month
(Short term)
Risk-free Debt
36. Year 10
34.9%
Year 7
27.9%
Year 5
23.3%
Year 3
9.3%
Year 1
4.7%
Impact of a Sudden Expectation of Lower Interest Rates
E ( i ) Supply of funds provided by investors in long-term (such as 10-year) markets, and in short-term
(such as 3-month) markets. Demand for fund borrowers in short-term markets and in long-term markets.
Therefore, the yield curve becomes downward sloping as shown here.
37. QUESTIONS
03
Why interest rates tend to decrease
recessionary periods?
What is the relationship between yield and
liquidity of the securities?
38. LIQUIDITY PREFERENCE THEORY
The price change for a long term debt security is more than that for a
short term debt security.
Liquidity restrictions on long-term bonds prevent the investor from
selling it whenever he wants.
The investor requires an incentive to compensate for the various risks he
is exposed to, primarily price risk and liquidity risk.
Less liquidity leads to an increase in yields, while more liquidity lads to
falling yields, thus definin the shape of upward and downward slope
curves.
KEY POINTS:
TERM STRUCTURE THEORIES
This theory perfects the more commonly accepted understanding of liquidity preferences of
investors. Investors have a general bias towards short-term securities, which have a higher liquidity
as compared to long-term securities, which get one's money tied up for a long time.
39. Year 10
34.9%
Year 7
27.9%
Year 5
23.3%
Year 3
9.3%
Year 1
4.7%
Impact of Liquidity Premium on the Yield Curve under three scenarios
40. MARKET SEGMENTATION THEORY/ SEGMENTATION THEORY
Preferences of investors for short term and long term securities.
An investor tries to match the maturities of his assets and liabilities.
Any mismatch can lead to capital loss or income loss.
Securities with varying maturities form a number of different
supply and demand curves, which then eventually inspire the final
yield curve.
Low supply and high demand lead to an increase in interest rates.
TERM STRUCTURE THEORIES
This theory is related to the supply-demand dynamics of a
market. The yield curve shape is governed by the following
aspects:
41. PREFERRED HABITAT THEORY
Few main theories that dictates the shape of a yield curve:
Keynesian Economic Theory
Substitutability Theory
TERM STRUCTURE THEORIES
This theory states that investor preferences can be flexible, depending
on their risk tolerance level. They can choose to invest in bonds outside
their general preference also if they are appropriately compensated for
their risk exposure.
43. Indicator of the overall health of the
economy - An upward sloping and
steep curve indicates good economics
health while inverted, flat, and
humped curves indicate a slowdown.
Knowing how interest rates might
change in the future, investors are
able to make informed decisions.
ADVANTAGES V.S. DISADVANTAGES
Yield curve risk - Investors who hold
securities with yields depending on
the market interest rates are exposed
to yield curve risk to hedge against
which they need to form well-
differentiated portfolios.
44. It also serves as an indicator of inflation.
Financial organizations have a heavy
dependency on the term structure of
interest rates since it helps in
determining rates of lending and
savings.
Yield curves give an idea of how
overpriced or underpriced the debt
securities may be.
ADVANTAGES V.S. DISADVANTAGES
Maturity matching to hedge against
yield curve risk is not a
straightforward tasl and might not
give the desired end results.
45. Term Structure of Interest
The term structure of interest rates
eventually is only a predicted
estimation that might not always be
accurate, but it has hardly ever fallen
out of place.
46. Forward
interest rates
and yield curve
The forward rate can be interpreted
as the market expectation of the
future interest under the assumption
that: the expectations theory of the
yield curve is correct and there is no
risk premium.
Forward interest rates are rates for
periods commencing at points of
time in the future. They are implied
by current rates for differing
maturities.
47. QUESTIONS
03
What is the meaning of the forward rate in
the context of the term structure of
interest rates?
48. The yield curve based on zero coupon
bonds is known as the spot yield
curve.
It is regarded as more informative than a yield
curve that relates redemption yields to
maturities of coupon bearing bonds. The
redemption date is not the only maturity date.
49. Coupon-bearing bonds may have
different redemption yields, despite
having common redemption dates,
because of differences in the coupon
payments.
The forward yield curve relates
forward interest rates to the points of
time to which they relate.
Yield curves based on coupon-bearing
bonds may not provide a single
redemption yield corresponding to a
redemption (final matury) date.
50. QUESTIONS
03
Why might forward rates consistently
overestimate future interest rates?
How liquidity premium affects the
estimate of a forward interest rate?
51. Forward yield curve
The series of forward rates
produces a forward yield
curve . The forward yield
curve requires the use of
zero coupon bonds for the
calculations.
This forms also the basis for
calculation of short-term interest
rate futures - which frequently take
the form of three-month interest
rate futures, are instruments
suitable for the reduction of the
risks of interest rate changes.
52. Three- month interest rate futures are notional
commitments to borrow or deposit for a three- month
period that commences on the futures maturity date.
They provide means whereby borrowers or investors can
(at least approximately) predetermine interest rates for
future periods.