


![A STUDY ON FINANCIAL PERFORMANCE OF STEEL AUTHORITY OF INDIA LIMITED
It is also called as “Return on Capital Employed”. It indicates the percentage of
return on the total capital employed in the business.
Operating profit
RETURN ON INVESTMENT ------------------------------- X 100
Capital employed
The term ‘operating profit ‘ means ‘profit before interest and tax’ and the term ‘
capital employed ‘ means sum-total of long term funds employed in the business. i.e.
Share capital + Reserve and surplus + long term loans – [non business assets +
fictitious assets]
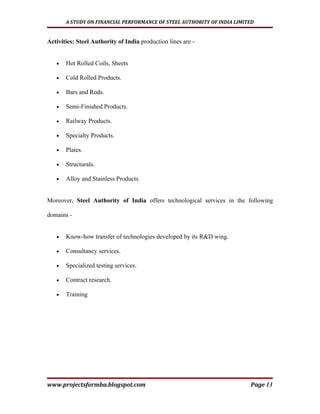
Table No.9
Table showing Return on Investment
OPERATING CAPTITAL RETURN ON
YEAR PROFIT EMPLOYED INVESTMENT
(Rs. In Crores (Rs. In Crores) (In %)
2001 1023 18265 5.60
www.projectsformba.blogspot.com Page 63](https://image.slidesharecdn.com/financialanalysisofsail-101220163422-phpapp02/85/Financial-analysis-of_SAIL-63-320.jpg)


The document discusses the history and present status of the Indian steel industry. It notes that the industry has grown significantly since liberalization in the 1990s. Current production levels are around 49 million tons per year, and targets have been set to reach 110 million tons by 2019-2020. However, per capita consumption of steel in India remains relatively low at 35 kg compared to global averages. For India to continue developing its economy, the steel industry will need to further expand production and consumption levels to support infrastructure growth across the country.