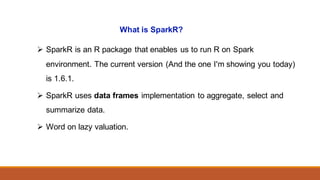
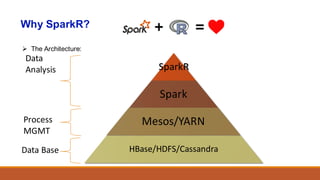
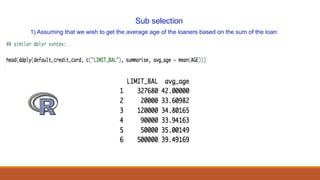
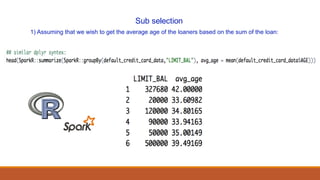
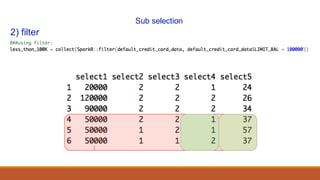
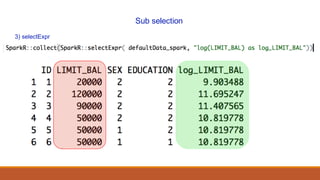
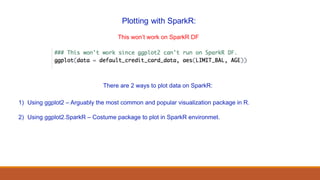
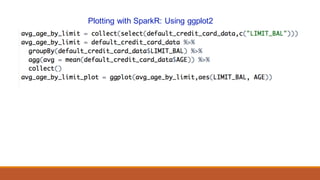
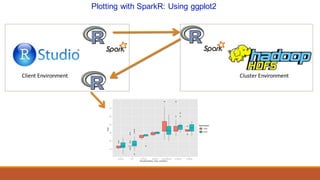
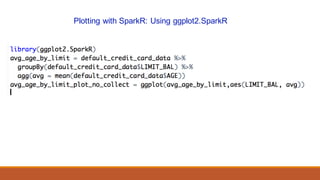
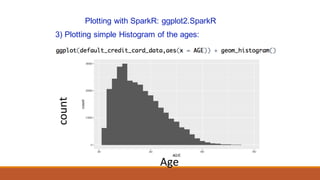
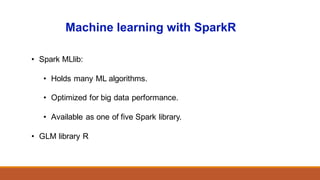
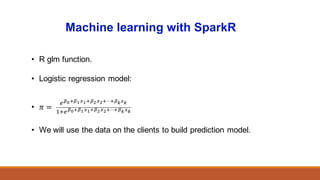
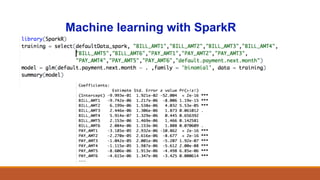
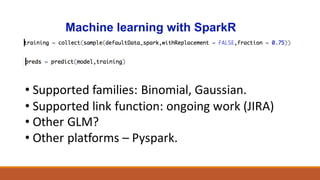
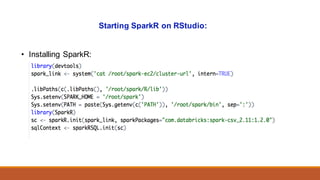
SlideShare a Scribd company logo
Introduction	to	SparkR
Nitay	Alon
Data	Scientist,	IBM
• Target Audience: data scientist / R users / Big Data developers.
• Goals: Introduction to SparkR.
• Natural transition for R users.
Today's talk:
• What is SparkR?
• Simple EDA (Exploratoty data analysis)
• Plotting with SparkR
• Simple regression with SparkR
• Installing and configuring SparkR.
Today's talk:
What is SparkR?
Ø SparkR is an R package that enables us to run R on Spark
environment. The current version (And the one I'm showing you today)
is 1.6.1.
Ø SparkR uses data frames implementation to aggregate, select and
summarize data.
Ø Word on lazy valuation.
Why Spark?
Ø https://spark.apache.org/docs/latest/sparkr.html
Ø Speed.
Ø Easy to use (Installation and working)
Ø Integrality with hadoop: Spark enables you to work with HDFS.
Ø In memory.
Ø Replacing MapReduce.
Why R?
Ø R vs Python.
Ø Fast growing language.
Ø Support for (almost) any DS related task.
Ø Thousands of packages.
Ø Visualization..
Why SparkR?
Ø SparkR sits on top of Spark.
Ø Expose the RDD API of Spark as distributed list in
R.
Why SparkR?
Ø The Architecture:
SparkR
Spark
Mesos/YARN
HBase/HDFS/Cassandra
Data	
Analysis
Process	
MGMT
Data	Base
Loading the data:
SparkR DF HDFSSparkR
Loading the data:
Local	CSV SparkR DF
First look at the data: Same Function as R
First look at the data:
1) Assuming that we wish to get the average age of the loaners based on the sum of the loan:
Sub selection
1) Assuming that we wish to get the average age of the loaners based on the sum of the loan:
Sub selection
Sub selection
Main methods for subset selection:
1) select – select a subset based on given column and returns selected columns
2) Filter – select all the rows according to column condition
3) selectExpr – modify column (or add on) according to SQL query.
1) Select:
Sub selection
Sub selection
2) filter
Sub selection
3) selectExpr
Plotting with SparkR:
There are 2 ways to plot data on SparkR:
1) Using ggplot2 – Arguably the most common and popular visualization package in R.
2) Using ggplot2.SparkR – Costume package to plot in SparkR environmet.
This won’t work on SparkR DF
Plotting with SparkR: Using ggplot2
Client	Environment Cluster	Environment
Plotting with SparkR: Using ggplot2.SparkR
Client	Environment Cluster	Environment
Plotting with SparkR: ggplot2.SparkR
3) Plotting simple Histogram of the ages:
count
Age
Plotting with SparkR: ggplot2.SparkR
4) Supported plots:
• Bar
• Box
Plotting with SparkR: ggplot2.SparkR
4) Supported plots:
• Histogram
• Frequency
• Stat_sum
• Bin2d – (heatmaps)
5) Supported methods:
• Positions : stack, fill, dodge.
• Facets: wrap, grid, null.
• Scales: x_log, y_log.
Comparing ggplot2 and ggplot2.SparkR
Criteria ggplot2 ggplot2.SparkR
Plotting	option Full Partial
Plotting in	Big	data	
environment
Require collect,	
select,	groupBy,	and	
other	functions
Easy	to	use,	as	if the	
data	frame	is	stored	
localy
Scaling Limited	by	the size	of	
the	single	node
Linearly	growth	with	
the	number	of	nodes.
• Spark MLlib:
• Holds many ML algorithms.
• Optimized for big data performance.
• Available as one of five Spark library.
• GLM library R
Machine learning with SparkR
• R glm function.
• Logistic regression model:
• 𝜋 =	
$%&'%()('%*)*'⋯'%,),
-.$%&'%()('%*)*'⋯'%,),
• We will use the data on the clients to build prediction model.
Machine learning with SparkR
• Supported	families:	Binomial,	Gaussian.
• Supported	link	function:	ongoing	work	(JIRA)
• Other	GLM?
• Other	platforms	– Pyspark.
What’s next?
• SparkR 1.6	+
• Incorporating	MLlib with	R.
• More	algorithms.
• More	visualization.
• More	power	for	you	to	enhance	your	analytics.
IBM’s	Analytics	Team
‫שאלות‬?
Starting SparkR on RStudio:
• Installing SparkR:

More Related Content

Similar to Final_show

Spark Summit EU 2015: Lessons from 300+ production users
Spark Summit EU 2015: Lessons from 300+ production usersSpark Summit EU 2015: Lessons from 300+ production users
Spark Summit EU 2015: Lessons from 300+ production users
Databricks
 
Ehtsham Elahi, Senior Research Engineer, Personalization Science and Engineer...
Ehtsham Elahi, Senior Research Engineer, Personalization Science and Engineer...Ehtsham Elahi, Senior Research Engineer, Personalization Science and Engineer...
Ehtsham Elahi, Senior Research Engineer, Personalization Science and Engineer...
MLconf
 
Extreme Apache Spark: how in 3 months we created a pipeline that can process ...
Extreme Apache Spark: how in 3 months we created a pipeline that can process ...Extreme Apache Spark: how in 3 months we created a pipeline that can process ...
Extreme Apache Spark: how in 3 months we created a pipeline that can process ...
Josef A. Habdank
 
夏俊鸾:Spark——基于内存的下一代大数据分析框架
夏俊鸾:Spark——基于内存的下一代大数据分析框架夏俊鸾:Spark——基于内存的下一代大数据分析框架
夏俊鸾:Spark——基于内存的下一代大数据分析框架
hdhappy001
 
SCALABLE MONITORING USING PROMETHEUS WITH APACHE SPARK
SCALABLE MONITORING USING PROMETHEUS WITH APACHE SPARKSCALABLE MONITORING USING PROMETHEUS WITH APACHE SPARK
SCALABLE MONITORING USING PROMETHEUS WITH APACHE SPARK
zmhassan
 
Apache spark-melbourne-april-2015-meetup
Apache spark-melbourne-april-2015-meetupApache spark-melbourne-april-2015-meetup
Apache spark-melbourne-april-2015-meetup
Ned Shawa
 
Scalable Monitoring Using Prometheus with Apache Spark Clusters with Diane F...
 Scalable Monitoring Using Prometheus with Apache Spark Clusters with Diane F... Scalable Monitoring Using Prometheus with Apache Spark Clusters with Diane F...
Scalable Monitoring Using Prometheus with Apache Spark Clusters with Diane F...
Databricks
 
Apache Spark
Apache SparkApache Spark
Apache Spark
Uwe Printz
 
Spark Streaming Tips for Devs and Ops
Spark Streaming Tips for Devs and OpsSpark Streaming Tips for Devs and Ops
Spark Streaming Tips for Devs and Ops
Francisco Pérez Paradas
 
Spark Streaming Tips for Devs and Ops by Fran perez y federico fernández
Spark Streaming Tips for Devs and Ops by Fran perez y federico fernándezSpark Streaming Tips for Devs and Ops by Fran perez y federico fernández
Spark Streaming Tips for Devs and Ops by Fran perez y federico fernández
J On The Beach
 
Adios hadoop, Hola Spark! T3chfest 2015
Adios hadoop, Hola Spark! T3chfest 2015Adios hadoop, Hola Spark! T3chfest 2015
Adios hadoop, Hola Spark! T3chfest 2015
dhiguero
 
MongoDB for Time Series Data: Sharding
MongoDB for Time Series Data: ShardingMongoDB for Time Series Data: Sharding
MongoDB for Time Series Data: Sharding
MongoDB
 
Spark tutorial
Spark tutorialSpark tutorial
Spark tutorial
Sahan Bulathwela
 
Build Large-Scale Data Analytics and AI Pipeline Using RayDP
Build Large-Scale Data Analytics and AI Pipeline Using RayDPBuild Large-Scale Data Analytics and AI Pipeline Using RayDP
Build Large-Scale Data Analytics and AI Pipeline Using RayDP
Databricks
 
Big data distributed processing: Spark introduction
Big data distributed processing: Spark introductionBig data distributed processing: Spark introduction
Big data distributed processing: Spark introduction
Hektor Jacynycz García
 
Apache Spark: What's under the hood
Apache Spark: What's under the hoodApache Spark: What's under the hood
Apache Spark: What's under the hood
Adarsh Pannu
 
Apache Spark II (SparkSQL)
Apache Spark II (SparkSQL)Apache Spark II (SparkSQL)
Apache Spark II (SparkSQL)
Datio Big Data
 
Accelerating NLP with Dask on Saturn Cloud: A case study with CORD-19
Accelerating NLP with Dask on Saturn Cloud: A case study with CORD-19Accelerating NLP with Dask on Saturn Cloud: A case study with CORD-19
Accelerating NLP with Dask on Saturn Cloud: A case study with CORD-19
Sujit Pal
 
ggplot2.SparkR: Rebooting ggplot2 for Scalable Big Data Visualization by Jong...
ggplot2.SparkR: Rebooting ggplot2 for Scalable Big Data Visualization by Jong...ggplot2.SparkR: Rebooting ggplot2 for Scalable Big Data Visualization by Jong...
ggplot2.SparkR: Rebooting ggplot2 for Scalable Big Data Visualization by Jong...
Spark Summit
 
MLconf seattle 2015 presentation
MLconf seattle 2015 presentationMLconf seattle 2015 presentation
MLconf seattle 2015 presentation
ehtshamelahi
 

Similar to Final_show (20)

Spark Summit EU 2015: Lessons from 300+ production users
Spark Summit EU 2015: Lessons from 300+ production usersSpark Summit EU 2015: Lessons from 300+ production users
Spark Summit EU 2015: Lessons from 300+ production users
 
Ehtsham Elahi, Senior Research Engineer, Personalization Science and Engineer...
Ehtsham Elahi, Senior Research Engineer, Personalization Science and Engineer...Ehtsham Elahi, Senior Research Engineer, Personalization Science and Engineer...
Ehtsham Elahi, Senior Research Engineer, Personalization Science and Engineer...
 
Extreme Apache Spark: how in 3 months we created a pipeline that can process ...
Extreme Apache Spark: how in 3 months we created a pipeline that can process ...Extreme Apache Spark: how in 3 months we created a pipeline that can process ...
Extreme Apache Spark: how in 3 months we created a pipeline that can process ...
 
夏俊鸾:Spark——基于内存的下一代大数据分析框架
夏俊鸾:Spark——基于内存的下一代大数据分析框架夏俊鸾:Spark——基于内存的下一代大数据分析框架
夏俊鸾:Spark——基于内存的下一代大数据分析框架
 
SCALABLE MONITORING USING PROMETHEUS WITH APACHE SPARK
SCALABLE MONITORING USING PROMETHEUS WITH APACHE SPARKSCALABLE MONITORING USING PROMETHEUS WITH APACHE SPARK
SCALABLE MONITORING USING PROMETHEUS WITH APACHE SPARK
 
Apache spark-melbourne-april-2015-meetup
Apache spark-melbourne-april-2015-meetupApache spark-melbourne-april-2015-meetup
Apache spark-melbourne-april-2015-meetup
 
Scalable Monitoring Using Prometheus with Apache Spark Clusters with Diane F...
 Scalable Monitoring Using Prometheus with Apache Spark Clusters with Diane F... Scalable Monitoring Using Prometheus with Apache Spark Clusters with Diane F...
Scalable Monitoring Using Prometheus with Apache Spark Clusters with Diane F...
 
Apache Spark
Apache SparkApache Spark
Apache Spark
 
Spark Streaming Tips for Devs and Ops
Spark Streaming Tips for Devs and OpsSpark Streaming Tips for Devs and Ops
Spark Streaming Tips for Devs and Ops
 
Spark Streaming Tips for Devs and Ops by Fran perez y federico fernández
Spark Streaming Tips for Devs and Ops by Fran perez y federico fernándezSpark Streaming Tips for Devs and Ops by Fran perez y federico fernández
Spark Streaming Tips for Devs and Ops by Fran perez y federico fernández
 
Adios hadoop, Hola Spark! T3chfest 2015
Adios hadoop, Hola Spark! T3chfest 2015Adios hadoop, Hola Spark! T3chfest 2015
Adios hadoop, Hola Spark! T3chfest 2015
 
MongoDB for Time Series Data: Sharding
MongoDB for Time Series Data: ShardingMongoDB for Time Series Data: Sharding
MongoDB for Time Series Data: Sharding
 
Spark tutorial
Spark tutorialSpark tutorial
Spark tutorial
 
Build Large-Scale Data Analytics and AI Pipeline Using RayDP
Build Large-Scale Data Analytics and AI Pipeline Using RayDPBuild Large-Scale Data Analytics and AI Pipeline Using RayDP
Build Large-Scale Data Analytics and AI Pipeline Using RayDP
 
Big data distributed processing: Spark introduction
Big data distributed processing: Spark introductionBig data distributed processing: Spark introduction
Big data distributed processing: Spark introduction
 
Apache Spark: What's under the hood
Apache Spark: What's under the hoodApache Spark: What's under the hood
Apache Spark: What's under the hood
 
Apache Spark II (SparkSQL)
Apache Spark II (SparkSQL)Apache Spark II (SparkSQL)
Apache Spark II (SparkSQL)
 
Accelerating NLP with Dask on Saturn Cloud: A case study with CORD-19
Accelerating NLP with Dask on Saturn Cloud: A case study with CORD-19Accelerating NLP with Dask on Saturn Cloud: A case study with CORD-19
Accelerating NLP with Dask on Saturn Cloud: A case study with CORD-19
 
ggplot2.SparkR: Rebooting ggplot2 for Scalable Big Data Visualization by Jong...
ggplot2.SparkR: Rebooting ggplot2 for Scalable Big Data Visualization by Jong...ggplot2.SparkR: Rebooting ggplot2 for Scalable Big Data Visualization by Jong...
ggplot2.SparkR: Rebooting ggplot2 for Scalable Big Data Visualization by Jong...
 
MLconf seattle 2015 presentation
MLconf seattle 2015 presentationMLconf seattle 2015 presentation
MLconf seattle 2015 presentation
 

Final_show

  • 2. • Target Audience: data scientist / R users / Big Data developers. • Goals: Introduction to SparkR. • Natural transition for R users. Today's talk:
  • 3. • What is SparkR? • Simple EDA (Exploratoty data analysis) • Plotting with SparkR • Simple regression with SparkR • Installing and configuring SparkR. Today's talk:
  • 4. What is SparkR? Ø SparkR is an R package that enables us to run R on Spark environment. The current version (And the one I'm showing you today) is 1.6.1. Ø SparkR uses data frames implementation to aggregate, select and summarize data. Ø Word on lazy valuation.
  • 5. Why Spark? Ø https://spark.apache.org/docs/latest/sparkr.html Ø Speed. Ø Easy to use (Installation and working) Ø Integrality with hadoop: Spark enables you to work with HDFS. Ø In memory. Ø Replacing MapReduce.
  • 6. Why R? Ø R vs Python. Ø Fast growing language. Ø Support for (almost) any DS related task. Ø Thousands of packages. Ø Visualization..
  • 7. Why SparkR? Ø SparkR sits on top of Spark. Ø Expose the RDD API of Spark as distributed list in R.
  • 8. Why SparkR? Ø The Architecture: SparkR Spark Mesos/YARN HBase/HDFS/Cassandra Data Analysis Process MGMT Data Base
  • 9. Loading the data: SparkR DF HDFSSparkR
  • 11. First look at the data: Same Function as R
  • 12. First look at the data:
  • 13. 1) Assuming that we wish to get the average age of the loaners based on the sum of the loan: Sub selection
  • 14. 1) Assuming that we wish to get the average age of the loaners based on the sum of the loan: Sub selection
  • 15. Sub selection Main methods for subset selection: 1) select – select a subset based on given column and returns selected columns 2) Filter – select all the rows according to column condition 3) selectExpr – modify column (or add on) according to SQL query.
  • 19. Plotting with SparkR: There are 2 ways to plot data on SparkR: 1) Using ggplot2 – Arguably the most common and popular visualization package in R. 2) Using ggplot2.SparkR – Costume package to plot in SparkR environmet. This won’t work on SparkR DF
  • 20. Plotting with SparkR: Using ggplot2
  • 21. Plotting with SparkR: Using ggplot2 Client Environment Cluster Environment
  • 22. Plotting with SparkR: Using ggplot2.SparkR
  • 23. Plotting with SparkR: Using ggplot2.SparkR Client Environment Cluster Environment
  • 24. Plotting with SparkR: ggplot2.SparkR 3) Plotting simple Histogram of the ages: count Age
  • 25. Plotting with SparkR: ggplot2.SparkR 4) Supported plots: • Bar • Box
  • 26. Plotting with SparkR: ggplot2.SparkR 4) Supported plots: • Histogram • Frequency • Stat_sum • Bin2d – (heatmaps) 5) Supported methods: • Positions : stack, fill, dodge. • Facets: wrap, grid, null. • Scales: x_log, y_log.
  • 27. Comparing ggplot2 and ggplot2.SparkR Criteria ggplot2 ggplot2.SparkR Plotting option Full Partial Plotting in Big data environment Require collect, select, groupBy, and other functions Easy to use, as if the data frame is stored localy Scaling Limited by the size of the single node Linearly growth with the number of nodes.
  • 28. • Spark MLlib: • Holds many ML algorithms. • Optimized for big data performance. • Available as one of five Spark library. • GLM library R Machine learning with SparkR
  • 29. • R glm function. • Logistic regression model: • 𝜋 = $%&'%()('%*)*'⋯'%,), -.$%&'%()('%*)*'⋯'%,), • We will use the data on the clients to build prediction model. Machine learning with SparkR
  • 31. Machine learning with SparkR • Supported families: Binomial, Gaussian. • Supported link function: ongoing work (JIRA) • Other GLM? • Other platforms – Pyspark.
  • 32. What’s next? • SparkR 1.6 + • Incorporating MLlib with R. • More algorithms. • More visualization. • More power for you to enhance your analytics.
  • 35. Starting SparkR on RStudio: • Installing SparkR: