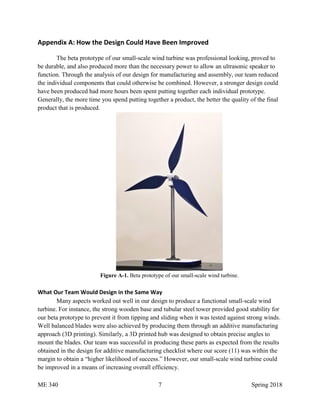
This document summarizes the design process of a small-scale wind turbine created by a team to power an ultrasonic mosquito repellent in Heredia, Costa Rica. The team generated concepts using brainstorming techniques and created prototypes to test designs. Their final "beta" prototype met all design criteria of producing 0.3W of power while being durable, portable, and aesthetically pleasing. The turbine was tested against a leaf blower to validate durability. Appendices provide suggestions for further improving the design and instructions for setup and use.
![ME 340 1 Spring 2018
Executive Summary: Design for Small-Scale Wind Turbine to Power an
Ultrasonic Mosquito Repellent
Trevor Durako, Asher Odhner, Abhinit Kothari, and Eva Wu Wu
Team 8.7, ME 340, Mechanical Engineering Department, Pennsylvania State University
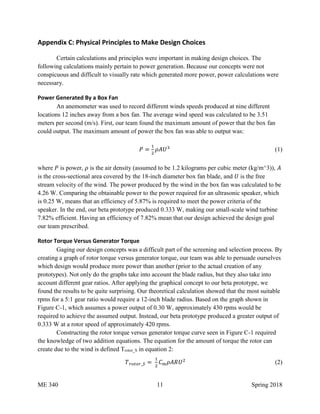
Our team was tasked with designing a small-scale wind turbine to address a particular
problem in Heredia, Costa Rica. In Heredia, mosquito borne illnesses are a threat among all
individuals. Choosing Heredia involved researching wind speeds because wind turbines require
adequate wind to be effective. On average, Heredia has wind speeds in the range of 13 to 17
miles per hour (mph). According to the Department of Energy, wind speeds of around 15 mph
are sufficient for producing power using the wind [1]. With our location specified, we then had
to more formally address the associated problem.
Heredia has been plagued with mosquito borne diseases such as Malaria, Dengue, and
the Zika Virus all create a negative impact on their population [2]. Ultrasonic speakers are
becoming an increasingly popular method of dealing with mosquitos in a safe manner. The
required power for an ultrasonic speaker is in the range of 0.25 to 0.5 watts (W). 0.25 to 0.5 W of
power seemed to be a reasonable amount to generate using a small-scale wind turbine. Therefore,
we decided to create a small-scale wind turbine that could power an ultrasonic mosquito
repellent.
Based on the problem, customer needs were developed and associated with our design
process. The three most important needs were power produced, aesthetics, and durability. Power
is the main factor that drives the ultrasonic speaker and was the most important criteria that was
considered throughout the entire design process. Aesthetics and durability define how the
product appeals to the customer and how long it can last without ensuing failure, respectively.
Our team also came up with three less important needs: weight, cost, and portability. The aim of
our small-scale turbine was to produce 0.3 W of power, be aesthetically pleasing (good color
coordination), cost less than $20, and be durable. In the end, our team ended up meeting all of
our customer needs and design criteria.
This paper presents the design process that was used to fabricate our wind turbine.
Starting with a brief description of the concept generation and selection process, this document
then moves onto the prototype section. The prototype section explains the sequence in which we
generated different prototypes and the changes that were introduced while going through
different designs. In the last part of the prototype section, a short section is included to describe
the performance of our beta prototype. Also, three appendices have been placed at the end of this
document. Appendix A talks about future design improvements, Appendix B gives instructions
for how the small-scale turbine should be set up, and Appendix C explains various calculations
and principles that were considered in choosing a particular design.](https://image.slidesharecdn.com/finalreportwindturbineproject-190719185638/85/Final-report-wind-turbine-project-1-320.jpg)
![ME 340 2 Spring 2018
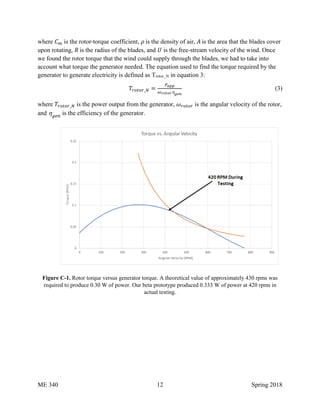
Concept Generation, Screening, and Selection
Three main techniques were applied to generate multiple concepts: brainstorming,
Negative Brainstorming, and the 6-3-5 brainstorming method. Brainstorming was a traditional
method that our team commonly used while considering new ideas. The new ideas were
specifically based on the components, which included the blades, gearbox, hub, tower, and
nacelle. In addition, other more complex systems in which the blades pitch could be adjustable
were discussed. Brainstorming created a pathway to be open and improvise rough ideas such as
an adjustable blade design. Another method that our team used during concept generation was
Negative Brainstorming. Unlike brainstorming, Negative Brainstorming considers ideas that
should not be implemented because they will negatively impact the design [3]. Negative
Brainstorming eliminated a large amount of the negative ideas early in the process. Lastly, the 6-
3-5 method allowed us to create ideas on paper through sketches and writings. This method
involved our entire team and required us to individually write down three ideas regarding certain
components of a wind turbine. After five minutes, each team member passed their papers to the
right. Once the original paper made its way back to the team member who started it, the ideas
could be discussed in greater detail.
Our team needed to narrow down to one final design. The first step that was used
involved a concept screening matrix. Out of five concepts, the screening matrix brought the
search down to two concepts which were to be chosen from. The difficult part about using a
concept scoring matrix was deciding how to determine which design could produce power better
than another design. Our solution for this problem was to create a graph displaying how the rotor
torque compared to the generator torque to generate a specific amount of power. The graph can
be viewed in Figure C-1 located in Appendix C. In addition to power, the concept scoring matrix
also took into account portability, aesthetics, cost, durability, and assembly time.
The final selection process utilized an AHP scoring matrix. In the scoring matrix, weights
were taken into account to fine tune how each design fits specific customer needs. Power,
durability, and aesthetics had the greatest effect on the final concept selection. Once each
customer need was scored appropriately based on the design, the scores were added up. Based on
the scoring matrix, the design that our team chose to continue with was concept 1.
Sequence of Prototypes
In order to effectively learn the process of taking an idea to a manufacturable product, our
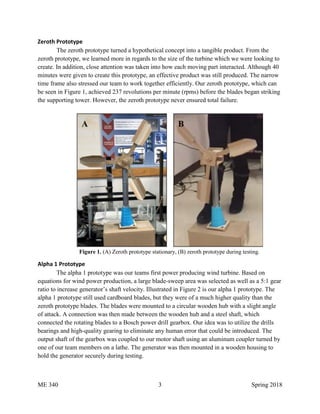
team constructed several prototypes. The zeroth prototype was our first rendition and was made
using basic craft supplies such as cardboard and hot glue. The prototype labeled “alpha 1,” was
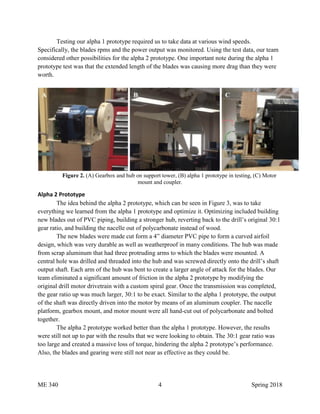
our first power producing design. Following the alpha 1 prototype is the alpha 2 prototype,
which carried many of alpha 1’s physical features. The last and final prototype created was the
beta prototype, which took on a many new features through significant design changes. Our team
learned various lessons throughout the creation of each prototype and was able to make design
changes along the way.](https://image.slidesharecdn.com/finalreportwindturbineproject-190719185638/85/Final-report-wind-turbine-project-2-320.jpg)
![ME 340 13 Spring 2018
References
[1] "Average Wind Speed In Heredia," [Online]. Available: https://weather-and-
climate.com/average-monthly-Wind-speed,heredia-cr,Costa-Rica.
[2] W. Anders, "Dengue Rates Fall, But Still a Problem in These Parts of Costa Rica," 7 March
2018. [Online]. Available: https://news.co.cr/dengue-rates-fall-still-problem-parts-costa-
rica/61294/.
[3] "Creativity Techniques," [Online]. Available:
https://www.mycoted.com/Category:Creativity_Techniques.](https://image.slidesharecdn.com/finalreportwindturbineproject-190719185638/85/Final-report-wind-turbine-project-13-320.jpg)


