Aids knowing no boundaries in 3 rd world countries
Final - Profile of HIV 2010 Dallas County_writing sample_Janina Daniels
1. 13-24
5%
25-34
17%
35-44
30%
45-54
34%
55+
14%
0-1
<1%
2-12
<1%
Profile of HIV in Dallas County, 2010
0
25
50
75
100
125
150
2002 2003 2004 2005 2006 2007 2008 2009 2010
IncidenceRateper100,000
Year
New HIV Diagnoses Rates by Age Groups, 2002 - 2010
Total <2 2-12 13-24
25-34 35-44 45-54 55+
0
200
400
600
800
1000
1200
2002 2003 2004 2005 2006 2007 2008 2009 2010
PrevalenceRateper100,000
Year
Total White Black
Hispanic Other
0
20
40
60
80
100
120
2002 2003 2004 2005 2006 2007 2008 2009 2010
IncidenceRateper100,000
Year
Total White Black
Hispanic Other
HIV in Dallas County by Age Groups New HIV Diagnoses by Exposure
Modes, 2010
Male
79%
Female
21%
New HIV Diagnoses by Gender,
2010
HIV in Dallas County by Race/Ethnicity
Black
50%
White
24%
Hispanic
24%
Other
2%
Black
40%
White
39%
Hispanic
19%
Other
2%
0-1
<1%
13-24
25%
25-34
30%
35-44
25%
45-54
15%
55+
5%
New Diagnoses People Living with HIV
Dallas County Health and Human Services, 2377 N Stemmons Fwy, Dallas, Texas 75207
0
2000
4000
6000
8000
10000
12000
14000
600
800
1000
1200
1400
1600
1800
2000
2200
2400
2600
2002 2003 2004 2005 2006 2007 2008 2009 2010
NumberofPeopleLivingwithHIV
AnnualNumberofCasesReported
Year
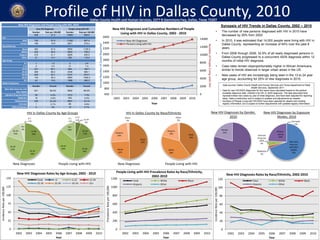
New HIV Diagnoses and Cumulative Numbers of People
Living with HIV in Dallas County, 2002 - 2010
New HIV Diagnoses
Persons Living with HIV
Men who
have sex
with Men
(MSM)
70%
MSM/IDU
2%
Injection
Drug Use
(IDU)
4%
Hetero-
sexual
24%
Perinatal
<1%
People Living with HIVNew Diagnoses
People Living with HIV Prevalence Rates by Race/Ethnicity,
2002-2010 New HIV Diagnoses Rates by Race/Ethnicity, 2002-2010
Data sources: Dallas County Health and Human Services and Texas Department of State
Health Services, September 2011
• Data for new HIV/AIDS diagnoses for this report were calculated based on the earliest
available diagnosis date, whether it be HIV or AIDS diagnosis. The data described here
represent these new cases by year of initial diagnosis, and have been adjusted for reporting
delay. Data is preliminary and is subject to updates and adjustments as needed.
• Numbers of People Living with HIV/AIDS have been adjusted for deaths with existing
registry information, but is subject to further adjustments with updated registry information.
Synopsis of HIV Trends in Dallas County, 2002 – 2010
• The number of new persons diagnosed with HIV in 2010 have
decreased by 29% from 2002.
• In 2010, it was estimated that 14,000 people were living with HIV in
Dallas County, representing an increase of 64% over the past 8
years.
• From 2006 through 2009, 32.9% of all newly diagnosed persons in
Dallas County progressed to a concurrent AIDS diagnosis within 12
months of initial HIV diagnosis.
• Case rates remain disproportionately higher in African Americans,
similar to trends observed in larger urban areas in the US.
• New cases of HIV are increasingly being seen in the 13 to 24 year
age group, accounting for 25% of new diagnoses in 2010.
New HIV Diagnoses and People Living with HIV, 2010
New HIV Diagnoses People Living with HIV
Number Rate per 100,000 Number Rate per 100,000
908 37.3 13883 569.9
Sex
Male 720 57.9 11262 907.4
Female 188 15.9 2621 219.4
Race/Ethnicity
Black 452 91.5 5559 1125.3
White 220 28.5 5463 708.2
Hispanic 215 21.1 2605 255.0
Other 21 14.1 256 115.4
Age Group
0-1 1 1.2 2 2.4
2-12 0 0.0 31 7.3
13-24 231 60.1 694 180.7
25-34 268 66.2 2348 580.1
35-44 225 53.1 4127 973.7
45-54 140 46.3 4693 1550.3
55+ 43 10.5 1988 485.2
Mode of Exposure
Number Percent Number Percent
Men Who Have Sex with
Men (MSM)
631 69.5% 9562 68.9%
Injection Drug Use (IDU) 38 4.2% 1012 7.3%
MSM/IDU 18 2.0% 550 4.0%
Heterosexual 220 24.2% 2657 19.1%
Perinatal 1 0.1% 86 0.6%
Other/Unknown 0 0% 16 0.1%